SlideShare ist ein Scribd-Unternehmen logo
1 von 16
Downloaden Sie, um offline zu lesen
Vivimed Labs Ltd.
                                                                                                                                           BUY

 Target Price ` 468                 CMP ` 343                                                                                FY14 PE 5.5x

          Index Details            We initiate coverage on Vivimed Labs Ltd as a BUY with a Price
 Sensex              18,154        Objective of ` 468 (target 7.5x FY14 EPS). At CMP of ` 343, the stock is
 Nifty                 5,522       trading at 6.0x and 5.5x its estimated earnings for FY13 & FY14
 BSE 100              9,568
                                   representing a potential upside of ~36% over a period of 24 months.
                                   Vivimed Labs Ltd is a diversified global company with a unique
 Industry           Pharma
                                   portfolio of products in the Specialty Chemicals and Pharmaceuticals
                                   categories. Niche product portfolio in specialty chemicals coupled with
          Scrip Details            significant inorganic growth through its recent acquisitions in the
 Mkt Cap (` cr)           348      pharma space should help the company post an earnings growth of
 BVPS (`)                 194      31.7% CAGR over the period FY11 to FY14.
 O/s Shares (Cr)          1.4
                                     Niche product portfolio and expansions to drive future growth
 AvgVol Lacs)              0.7
 52 Week H/L        354/213        The matured Home and Personal care (H&PC) global markets are expected to
 Div Yield (%)            0.6      grow at CAGR of 3.2% to USD 368 bn by 2015 while in India the H&PC markets


                                                                                                                                                            STOCK POINTER
                                   are expected to grow at a faster pace of 12.2% to USD 8 bn by 2015. Vivimed
 FVPS (`)                 10.0
                                   being well embedded as a global quality supplier of active ingredient to the H&PC
                                   industry is best placed to benefit from this growth. We expect Vivimed’s overall
   Shareholding Pattern            revenues to grow at a CAGR of 39.9% to ` 1139.9 crore over the forecast period of
 Shareholders              %       FY11-14 with 50.0% of the revenues coming for the specialty chemicals product
                                   portfolio and the balance from the capacity expansions and inorganic growth in the
 Promoters                43.6
                                   pharmaceutical space.
 DIIs                     1.6
 FIIs                     18.2      Recent acquisitions to fuel revenue growth
 Public                   36.6
                                   In a strategic move, to enhance presence across the value chain and hasten entry
 Total                    100
                                   to the regulated markets (which generally has a 36-48 months penetration lead
                                   time), Vivimed acquired Uquifa, a 75 year old API and intermediates manufacturing
      Vivimed vs. Sensex           company. Considering Vivimed’s, strong track record of successful acquisitions, we
                                   expect the company to effectively leverage these acquisitions and add value.
                                   Besides Uquifa, Vivimed has also acquired two small formulation companies Klar
                                   Sehen Pvt Ltd & Octtantis Nobel Labs for a consideration of ` 24 crore and ` 5
                                   crore, respectively. These acquisitions would help Vivimed reduce costs by
                                   achieving manufacturing synergies and expand sales and profitability by increasing
                                   market and client penetration. We expect, Vivimed to earn revenues to the tune of `
                                   352 crore in FY14 from these acquisitions.


 Key Financials (` in Cr)
              Net                                                    EPS Growth            RONW            ROCE                           EV/
 Y/E Mar                EBITDA               PAT          EPS                                                            P/E (X)
           Revenue                                                       (%)                (%)             (%)                        EBITDA(X)
 2011        416.0         84.1              48.8         48.0            -                 24.8            16.4           7.1            11.9
 2012E       636.2        126.5              58.9         42.3          -12.0               13.0            14.8           8.1             7.9
 2013E       982.1        176.7              91.6         57.1          35.0                16.9            16.6           6.0             5.7
 2014E      1139.9        205.5             111.6         62.4           9.3                17.2            17.5           5.5             4.9


- 1 of 16 -                                                                                                                       Thursday 16th Feb, 2012
                     This document is for private circulation, and must be read in conjunction with the disclaimer on the last page.
 Significant entry barriers to ensure limited competition leading
                                  to sustainability of revenues

                                In the active ingredients market where product quality has precedence over price,
                                becoming a preferred supplier to global majors is a strenuous and prolonged process.
                                Vivimed with its quality offering has established strong relationships with global
                                majors and over time has embedded itself within these multinationals and now is a
                                supplier across a wide range of products.

                                  Valuation

                                At the CMP of ` 343, Vivimed is trading at 6.0x and 5.5x its estimated earnings for
                                FY13 and FY14. We initiate coverage on Vivimed Labs Ltd as a BUY with a Price
                                Objective of ` 468 (7.5x FY14 EPS) over a period of 24 months.

                                We have valued the stock at 36% premium to its historical average valuation of 5.5x
                                considering the robust product portfolio and the recent acquisitions. Vivimed’s
                                earnings are expected to grow at a 31.7% CAGR over the forecast period FY11-14
                                which is far ahead of the sector’s growth. Post the integration of the acquisitions, we
                                expect Vivimed to be re-rated considering its enhanced global presence and
                                broadened product portfolio. Though, mounting debt remains an overhang on the
                                stock.


                                                                                                                                th
- 2 of 16 -                                                                                                        Thursday 16 Feb, 2012
              This document is for private circulation, and must be read in conjunction with the disclaimer on the last page.
 Company background
                                    Vivimed was established in 1989 as a single product (VIV-20) and single location
                                    company. Since then the company has grown by leaps and bounds to emerge as a
                                    preferred supplier of several key ingredients to MNCs in the specialty chemicals &
                                    pharmaceutical segments.

                                    In the specialty chemical division, Vivimed is engaged in the manufacturing and
                                    marketing of active ingredients within the Home & Personal Care products, and
                                    Industrial care products. While, in the pharmaceutical division, the company provides
                                    contract manufacturing services as well as undertakes manufacturing and marketing
                                    of branded formulations. In addition, Vivimed through timely acquisitions of James
                                    Robinson, Harmet International as well as the recent acquisition of Uquifa, has
                                    maintained its growth trajectory as well as further enhanced its presence in the global
                                    markets.


                                                 Vivimed Labs- Business Organization


                                                             VIVIMED LABS


                    Specialty
                                                                                        Pharmaceuticals
                    Chemicals


                                                              CRAMs                        Formulations                   APIs
         Active                 Industrial
      Ingredients                 Care

                                                                                                                            Uquifa
                                                         Vivimed Labs India
                                                                                                                        Prod.,Sales and
                                                         (Prod, Dist & R&D)
                                                                                           Klar Sehen Prod &               Marketing
                                                                                               Marketing
                    Vivimed Labs
               (Marketing &Distribution)

                                                         Creative Healthcare                 Octtantis Nobel
                   Vivimed Labs UK                          (Prod & Dist)                     Distribution
              (Sales, Marketing and R&D)


                  Vivimed Labs USA
                (Production, Sales and
                        R&D)


  Source: Vivimed, Ventura Research

                                                                                                                                    th
- 3 of 16 -                                                                                                            Thursday 16 Feb, 2012
                  This document is for private circulation, and must be read in conjunction with the disclaimer on the last page.
Headquartered in Hyderabad, Vivimed operates out of 9 manufacturing facilities (6
                                    domestic and 3 overseas), 3 R&D facilities (1 domestic and 2 overseas). It has a
                                    customer base spread across 50 countries with SBUs based in America (Vivimed Labs
                                    USA Inc) and Europe (Vivimed Labs Europe) along with a marketing office in China.


                                                        Manufacturing Plants of Vivimed Labs

         Plant                    Location                 Manufacturing                                         Details
         Bidar               Northern Karnataka         Specialty Chemicals                  Sunscreens, Anti Microbial and Preservatives
     Bonthapally                 Hyderabad                Specialty Chemicals                        Home & Personal Care actives
      Jeedimetla                 Hyderabad               Formulation and R&D                              Dosage formulations
       Haridwar                 Uttarakhand                  Formulations                      Sterile products - Small Volume Parentals
       Kashipur                 Uttarakhand                  Formulations                Non-Sterile Syrups, tablets, Capulses and dry powders.
     Cuernavaca                    Mexico                         APIs                            Acquired through Uquifa Acquisition
     Sant Celoni                   Spain                          APIs                            Acquired through Uquifa Acquisition
     Llica de Vall                 Spain                          APIs                            Acquired through Uquifa Acquisition
     Chouttuppal*                Hyderabad                   Formulations                                  Tablets & Capsules
     Srikakulam**                    AP                           SEZ                                  Synthetic organic chemicals
Source: Vivimed, Ventura Research


                                     Niche product portfolio and expansions to drive future growth
                                    The matured Home and Personal Care (H&PC) global markets are expected to grow
                                    to USD 368 bn by 2015 while the Indian H&PC markets are expected to grow at a
                                    faster pace of 12.2% to USD 8 bn by 2015. Vivimed being well embedded as a global
                                    quality supplier of the active ingredient to the H&PC industry is best placed to benefit
                                    from this growth. We expect Vivimed’s overall revenues to grow at a CAGR of 39.9%
                                    to ` 1139.9 crore over the forecast period of FY11-14 with 50.0% of the revenues
                                    coming for the specialty chemicals product portfolio and the balance from the
                                    capacity expansions and inorganic growth in the pharmaceutical space.

                                                                            Revenue and Profitability trend
                                                                Rs. Crore                                                        (%)
                                                        1200                                                                       25%

                                                        1000                                                          Triclosan           Triclosan CaGp
                                                                                                Triclosan               CaGp 20%            Avobenzone
                                                         800                                      CaGp               Avobenzone          Climbazole Ben 4
                                                                             Triclosan         Avobenzone            Climbazole 15%             TCC
                                                         Triclosan             CaGp            Climbazole               Ben 4                  Starcat
                                       Triclossan        600
                                                           CaGp             Avobenzone            Ben 4                 TCC                    ZnPTO
                                         CaGP           Avobenzone          Climbazole                                 Starcat 10%
                                                                                                  TCC                                           SAP*
                                                         400                                                           ZnPTO
                                                         200                                                                    5%

                                                            0                                                                     0%
                                                                   FY10        FY11        FY12E         FY13E       FY14E

                                                                     Revenue          EBIDTA Margin(%)           PAT Margin(%)

                                                    Source: Vivimed, Ventura Research
                                                                                           Avis
                                                                         Avis             Ben-4
                                         Avis            Avis           Ben-4            Dantuff-z
                                        Ben 4           Ben 4          Dantuff-z          Etone
                                                                        Etone            Co-Guars
                                                                                          Vivinol                                             th
  - 4 of 16 -                                                                                                                      Thursday 16 Feb, 2012
                  This document is for private circulation, and must be read in conjunction with the disclaimer on the last page.
 Specialty chemical business - a major contributor to growth
                                Led by ` 25 crore worth of expansions at its existing two specialty chemical plants,
                                we expect the specialty chemical division to grow at a three year CAGR of 21.7% to `
                                570.3 crore by FY14. Vivimeds portfolio of active ingredients caters to nearly 75% of
                                the global H&PC market (USD 268 bn, 3.2% CAGR) and with these enhanced
                                capacities the company is expected to benefit immensely.


                                                             Specialty Chemicals-Revenue and EBITDA Margin
                                                             Rs. Crore                                                 (%)
                                                       600                                                                   25

                                                       500                                                                   20
                                                       400
                                                                                                                             15
                                                       300
                                                                                                                             10
                                                       200

                                                       100                                                                   5

                                                        0                                                                    -
                                                                  FY11         FY12E              FY13E        FY14E

                                                                         Revenue            EBIDTA Margin RHS (%)

                                                  Source: Vivimed, Ventura Research


                                                   H&PC Products dominates the specialty segments business
                                                                                                 1%     1%
                                                                                            2%

                                                                                                                                  Hair Care
                                                                                                 6%
                                            Pharmace                                                                              Antimicrobles
                                                                                           6%                26%
                                             uticals                                                                              Sun Care
                                              22%
                                                                                                                                  Intermediaries
                                                                                      9%
                                                                                                                                  Oral Care
                                                                                                                                  Photohromics

                                                                                      13%                                         Other Chemicals
                                                             Specialty
                                                             Chemicals
                                                                                                             18%                  Imaging
                                                               78%                                                                Skin Care

                                                                                                  18%                             Preservatives


                                   Source: Vivimed, Ventura Research


                                                                                                                                   th
- 5 of 16 -                                                                                                         Thursday 16 Feb, 2012
              This document is for private circulation, and must be read in conjunction with the disclaimer on the last page.
Robust Industry growth to support revenue growth
                               Global Personal Care Market                                   Domestic Personal Care Ingredient Market
                      USD bn                                                                 USD mn
          400                                                         368              900
                                                                354                                                                  800
                                                   328   341                           800
          350                                315
                               291     303
          300          280                                                             700

          250                                                                          600

          200                                                                          500

          150                                                                          400              350

          100                                                                          300

              50                                                                       200

                  0                                                                    100
                       2008 2009 2010 2011 2012 2013 2014 2015                           0
                                                                                                        2009                        2015

     Source:Vivimed,Ventura Research                                               Source:Vivimed,Ventura Research


                      Global Personal Care Ingredient Market                             Global Personal Care Ingredient Market Breakup
                  USD bn                                                                                  Oral Others
          20                                                                                              Care 6%
                                                                                                           9%
                                                                15
          15

                                  10
          10
                                                                                                                                  Skin
                                                                                                                                  care
                                                                                                               Hair               50%
              5                                                                                                Care
                                                                                                               35%

              0
                                 2009                          2015

       Source:Vivimed,Ventura Research                                              Source:Vivimed,Ventura Research


                                             James Robinson acquisition - complete portfolio offering in the Hair care
                                             segment.

                                             Vivimed’s product portfolio is dominated by the products in the Sun Care, Hair Care
                                             and Anti microbial segments. Post the acquisition of James Robinson’s, Vivimed has
                                             a complete portfolio of Hair Care products catering to each sub segment of
                                             Shampoos, Conditioners, and Hair Dyes. Vivimed also has a tie up with International
                                             Specialty Products (ISP) for the joint marketing of various sunscreen products thus
                                             expanding its base in Sun Care segment.


                                                                                                                                           th
- 6 of 16 -                                                                                                                 Thursday 16 Feb, 2012
                       This document is for private circulation, and must be read in conjunction with the disclaimer on the last page.
Product portfolio in Home & Personal Care

                       Divisions            Products                 Description & End Uses                    Key Clients
                                         VIV-20           Antibacterial For Toothpastes & Mouthwash
                                                                                                                Unilever,
                                         VIVCAL-G         Nutraceutical, Dental enamel protection
                       Oral Care                                                                               P&G, Dabur,
                                         VIVHEX           Antibacterial for Mouthwash                             BDF
                                         VIVHEX-G         Antibacterial for Mouthwash
                                         AVIS             Broad Spectrum UV-A Filter
                                         CINNAMON         UV- B Category 1 Filter
                                                                                                                Unilever,
                                         BEN-3            Oil Soluble UV-A & UV -B Filter
                        Sun Care                                                                              P&G, L'Oreal,
                                         Ben-4            Water Soluble UV-A & UV -B Filter                      BDF
                                         OCTYNE-B         Oil Soluble UV- B Filter
                                         ETONE            UA-A & UV- B Filter
                                         VINTOX           Anti-Oxidant & Anti-aging Molecule
                                         VIVINOL          Skin Lightening agent                                   BASF,
                       Skin Care
                                         TRU ALOE         Skin Moisturizer                                       Sederma
                                         C-VITE           Anti Wrinkle
                                         DANTUFF-Z        Broad Spectrum Anti Dandruff agent
                                         DANTUFF-C        Anti-Fungal agent in transparent Shampoos
                                         DANTUFF-K        Anti dandruff & Anti-Fungal agent
                        Hair Care                                                                             Unilever, ITC,
                                         VIPIROX          Anti dandruff agent
                                                                                                                  Dabur
                                         VIVIDINE         Hair growth agent
                                         CO-GUAR          Emollients & Conditioners
                                         COSVAT           Anti-Fungal & Anti bacterial
                     Preservatives
                                         VIVILIDE         Wide Spectrum bacteriostatic
                                                                                                                 Unilever,
                                         VIVMAX           Antimicrobial & Germicidal
                     Antimicrobials                                                                             BASF, J&J
                                         VIV-20           Antibacterial For Cosmetic & Toiletries
                 Source: Vivimed, Ventura Research


                                      Industrial segment to complement growth in H&PC
                                     In addition to Home & Personal Care segment, Vivimed caters to the Industrial
                                     Segment with products in photo chromatic dyes and imaging chemicals. In the photo
                                     chromatic segment, Vivimed is a world leader in the development of innovative photo
                                     chromic dyes manufactured and marketed under the name of Reversacol.
                                                     Product Portfolio in Industrial Care

     Category        Key Products                     Description                             End Uses                     Key Clients
   Photochromic                                                                      Lenses, toys, films, Clothes,      Keystone, Corning,
                      Reversacol            Patented high Performance dyes
       Dyes                                                                          Cosmetics like nail Varnish          Mildex Optical
                      Phenidone           Black and White development agent
      Imaging
                      Dimezone           Black and white developing agent Anti-          X-rays, Photography             Kodak, Fuji, LG
     Chemicals
                     Nitroindazole                  fogging agent
 Source: Vivimed, Ventura Research


                                                                                                                                  th
- 7 of 16 -                                                                                                          Thursday 16 Feb, 2012
                This document is for private circulation, and must be read in conjunction with the disclaimer on the last page.
 SEZ facility on the cards
                                Vivimed is also establishing a SEZ in Andhra Pradesh at a cost of ` 120 crore to cater
                                to the growing export demand of synthetic organic chemicals in the H&PC segment.
                                In addition, the company is expanding its product base by foraying into new segments
                                with the development of a Skin lightening ingredient and chemicals for Printed
                                Electronics. Since the SEZ is expected to commission post FY14, we have not
                                factored these in our revenues.

                                 Product portfolio and expansions in Pharma to further enhance
                                  value
                                Vivimed has a wide range of formulation products across therapeutic segments with
                                significant presence in CRAMs.This segment is poised for major growth fuelled by
                                capacity expansions and acquisitions. Vivimed is setting up a green field plant in
                                Hyderabad, at an investment of ` 40 crore and is undertaking some de-bottlenecking
                                exercises at its existing Jeedimetla plant. Further the company has acquired Uquifa,
                                Klar Sehen and Octtantis Nobel in the API and branded formulations space. Aided by
                                these expansions and recent acquisitions, we expect the revenues to receive a major
                                boost and grow at a CAGR of 78.8% to ` 569.6 crore over the forecast period (2011-
                                14).

                                                               Pharma - Revenue and EBIDTA Margin
                                                           Rs. Crore                                             (%)
                                                    600                                                                25

                                                    500                                                                20
                                                    400
                                                                                                                       15
                                                    300
                                                                                                                       10
                                                    200

                                                    100                                                                5

                                                       0                                                               -
                                                                FY11        FY12E          FY13E         FY14E

                                                                       Revenue         EBIDTA Margin RHS (%)


                                                   Source: Vivimed, Ventura Research


                                                                                                                                th
- 8 of 16 -                                                                                                        Thursday 16 Feb, 2012
              This document is for private circulation, and must be read in conjunction with the disclaimer on the last page.
Vivimed Pharmaceutical Product Portfolio

                                  CAPSULES/TABLETS                     SYRUPS & LIQUIDS                     SMALL VOLUME

                                                                                                               PARENTALS


                                       FLEXASUR                            CODAREX                             OTRIVIN
                                       SPASMOCIP PLUS                      INALGEL                             NASIVION MOIST
                                       CODARIN                             VISCODYNE                           NASIVION
                                       BUTAPROXIVON                        BROZEDEX                            CANDBIOTIC EAR
                                       VALENZIA TABLETS                    CELADRIN                            DROP
                                       ARACHITOL TABLET                    MITS CODEINE                        OTRIVIN NASAL
                                       C PINK TABLET                       LINCTUS                             SPRAY
                                                                           CANDID LOTION                       TOBROP
                                                                           CANDID MOUTH
                                                                           PAINT
                                                                                   MERCK
                                         CRAMS                                     NOVARTIS
                                                                                   RANBAXY
                                                                                   GLENMARK
                                                                                   CIPLA
                                                                                   LUPIN


                             Source: Vivimed, Ventura Research
                                     Recent acquisitions to fuel revenue growth
                                In a strategic move, to enhance presence across the value chain and hasten entry to
                                the regulated markets (which generally has a 36-48 months penetration time),
                                Vivimed acquired Uquifa, a 75 year old API and intermediates manufacturing
                                company. Considering Vivimed’s, strong track record of successful acquisitions, we
                                expect the company to effectively leverage the acquisition and add value. Besides
                                Uquifa, Vivimed has also acquired two small formulation companies Klar Sehen Pvt
                                Ltd & Octtantis Nobel Labs for a consideration of ` 24 crore and ` 5 crore
                                respectively. These acquisitions would help Vivimed reduce costs by achieving
                                manufacturing synergies and expand sales and profitability by increasing market and
                                client penetration. We estimate Vivimed to earn revenues to the tune of ` 352 crore in
                                FY14 from these acquisitions.


                                                                                                                                th
- 9 of 16 -                                                                                                        Thursday 16 Feb, 2012
              This document is for private circulation, and must be read in conjunction with the disclaimer on the last page.
Profile of Major strategic acquisitions
                           James Robinson         Harmet              Klar Sehen Pvt           Octtantis     Nobel    Uquifa, Spain &
    Acquisition            Ltd                    International       Ltd                      Labs                   Mexico
          Year of
                                   2008                 2009                  2011                    2011                   2011
        Acquisition
          Cost of
                                USD 21 mn            USD 3 mn              Rs 24 crore             Rs 5 crore             USD 55 mn
        Acquisition
           Stake                   100%                100%                   100%                    60%                    100%
                           Photochromic Dyes                                                                                Active
                                                     Sales and                                 Pharmaceuticals &
                              and Imaging                             Ophthalmic Products                               Pharmaceutical
                                                     Distribution                                Nutraceuticals
         Products              Chemicals                                                                                   Products

                                                                          Complements           Strong marketing
                                                   Direct entry to                                                    Foray into booming
        Rationale of          Niche product                           Vivimed’s portfolio in    field force to help
                                                   the developed                                                          generic API
        Acquisition             portfolio.                                 high growth         expand distribution
                                                      markets.                                                             segment.
                                                                      ophthalmic segment.              reach.


    Source: Vivimed, Ventura research

                                    Uquifa- a unique value proposition
                                   Vivimed has acquired it for a consideration of USD 55 million (` 286 crore) funded
                                   through a debt equity mix of 65:35. Vivimed’s equity infusion of USD 20 million is via
                                   an SPV (Vivimed Labs Spain S.L), debt financing of USD 25 million has been
                                   provided by Exim Bank and balance USD 10 million is by the way of deferred
                                   payments.
                                                               Benefits of Uquifa acquisition


                                              Source: Vivimed, Ventura Research

                                    Other two acquisitions in branded formulations to enhance
                                     presence in domestic biz
                                   In addition to Uquifa, Vivimed in its acquisition spree acquired two formulation
                                   companies in India, Klar Sehen Pvt Ltd (KSPL) (100% stake) and Octtantis Nobel

                                                                                                                                    th
- 10 of 16 -                                                                                                          Thursday 16 Feb, 2012
                This document is for private circulation, and must be read in conjunction with the disclaimer on the last page.
Labs (50% stake) in 2011 for ` 24 crore and ` 5 crore respectively with presence in
                                  manufacturing and marketing of branded formulations.
                                                                  Benefits KSPL and Octtantis acquisition

                                                                      Presence in North-
                                                150 MRs               East, Bihar & AP                Strong
                                                                                                    Distribution
                                                                                                      Reach


                                                                 KSPL

                                                                                                                            Presence in
                                                                                                    Octtantis              Pharmaceutical
                                                                                                     Nobel                 & Nutraceutical
                                             50 Trade
                                                                   cGMP compliant
                                                                                                     Labs                     Segment
                                              Marks
                                                                  manuf acturing f acility
                                                                     at Kolkata &
                                                                       Hyderbad
                                          Source: Vivimed, Ventura Research

                                  Significant entry barriers to ensure limited competition and
                                   sustainability of growth
                                  In the active ingediants market where product quality has precedence over price,
                                  becoming a preferred supplier to global majors is a strenuous and prolonged process.
                                  Vivimed with its quality offering has established strong relationships with global
                                  majors and over a time period has embedded itself within these multinationals and
                                  now is a supplier across a wide range of products.
                                                  Timeline of Product Basket Expansion
                                                                  Unilever


                                    L’oreal
                                                                                                       P&G


      Source: Vivimed, Ventura Research

                                                                                                                                  th
- 11 of 16 -                                                                                                          Thursday 16 Feb, 2012
                This document is for private circulation, and must be read in conjunction with the disclaimer on the last page.
Typical time-line to be embedded as a vendor to an MNC is 5-7 years thus raising the
                                       competitive bar. Further, the contracts are long term in nature ensuring stable
                                       revenues for a longer period of time. Considering these huge entry barriers, and
                                       expanding product portfolio of Vivimed, we are very comfortable with regards to
                                       revenue visibility.
                                                                           Activity                             Timelines

                                                                    Sample Quantities                        3 to 6 months


                                                                   Small/Trial Batches                       6 to 9 months


                                                                   Stabilization period                    15 to 18 months


                                                                  Commercial Quantities                      6 to 9 Months


                                       Source: Vivimed, Ventura Research


                                       Vivimed’s strong skill set for innovations, research based idea-generation right from
                                       creation of a molecule to partnering with a manufacturer provides the company with a
                                       significant competitive edge.

                                      KEY CONCERNS
                                        Mounting debt, a key risk to profitability
                                       Especially in the current high interest environment, Vivimed’s debt by FY14 would be
                                       very high at `515 crore (debt equity ratio of 0.8). Since along with debt, significant
                                       equity dilution has already been done leaving with very little scope for further
                                       expansion of equity. As the cash flows are strong, we forsee no issues with regards
                                       to debt serviceability. However, a sharp deterioration of economic environment & rise
                                       in interest rates can impact adversely.
                                    Debt to Equity                                                    Interest Coverage to Debt/EBIDTA
                     (Rs.Crore)                                          (%)                  (%)
           1400                                                                1.8      7.0                                                             4.0

           1200                                                                1.6      6.0                                                             3.5
                                                                               1.4                                                                      3.0
           1000                                                                         5.0
                                                                               1.2
                                                                                                                                                        2.5
               800                                                             1        4.0
                                                                               0.8                                                                      2.0
               600                                                                      3.0
                                                                               0.6                                                                      1.5
               400
                                                                               0.4      2.0
                                                                                                                                                        1.0
               200                                                             0.2      1.0                                                             0.5
                 0                                                             0
                                                                                        0.0                                                             0.0
                          FY11       FY12E        FY12E          FY14E
                                                                                                    FY11          FY12E          FY13E        FY14E

                                     Debt       Debt to Equity
                                                                                                       Interest Coverage Ratio      Debt/EBIDTA (RHS)


        Source:Vivimed, Ventura Research                                              Source: Vivimed, Ventura Research

                                                                                                                                                 th
- 12 of 16 -                                                                                                                       Thursday 16 Feb, 2012
                     This document is for private circulation, and must be read in conjunction with the disclaimer on the last page.
 Foreign Exchange Risk
                                 Vivimed derives ~ 44% (FY11) of its revenue from the export markets which are set
                                 to rise further considering the recent acquisition abroad. Any adverse movement in
                                 the USD/INR in the wake of current global economic turmoil might affect company’s
                                 revenue and profitability adversely.

                                  Financial performance
                                 Vivimed Ltd has witnessed a steady 59.1% yoy growth in its top line to ` 168.0 crore
                                 in Q3FY12 as against ` 105.6 crore in Q3FY11 led by consolidation of the recently
                                 acquired pharmaceutical companies. The EBITDA margins stood at healthy 19.8%.
                                 While, the PAT margins stood at 9.5%.

                                 We believe that Vivimed would register a strong growth in revenues in quarters to
                                 come led by strong product portfolio and recent acquisitions. In our view, the recent
                                 acquisitions would help the company maintain margins and foster a strong growth
                                 thus adding significant value. Further, the expansions would ensure growth in the
                                 current portfolio base ensuring a double benefit with mounting debt being the only
                                 concern.


                                                                  Quarterly Financial Performance
                                               Particulars                     Q3FY12      Q3FY11        FY11        FY10
                                               Net Sales                          168.0       105.6        416.9       343.4
                                               Growth %                            59.1                     21.4
                                               Total Expenditure                  136.4        81.4        331.9       279.1
                                               EBITDA                              33.2        24.2         85.0        64.3
                                               EBITDA Margin %                     19.8        22.9         20.3        18.7
                                               Depreciation                         6.9         1.5          9.1         8.7
                                               EBIT (EX OI)                        26.3        22.7         75.9        55.6
                                               Other Income                         0.0         0.0         0.01         6.8
                                               EBIT                                26.3        22.7         75.9        62.4
                                               Margin %                            15.7        21.5         18.2        18.1
                                               Interest                             5.9         6.0         20.6        22.8
                                               Exceptional items                    0.0           0          0.0         0.0
                                               PBT                                 20.4        16.7         55.3        39.6
                                               Margin %                            12.1        15.8         13.2        11.5
                                               Provision for Tax                    4.4         3.4          6.4         8.6
                                               PAT                                 16.0        13.3         48.8        31.0
                                               PAT Margin (%)                       9.5        12.6         11.7         9.0
                                              Source: Vivimed, Ventura Research


                                                                                                                                 th
- 13 of 16 -                                                                                                         Thursday 16 Feb, 2012
               This document is for private circulation, and must be read in conjunction with the disclaimer on the last page.
 Financial outlook
                                 Aided by strategic acquisitions and continuous expansions, we expect Vivimed
                                 revenues to grow at a CAGR of 39.9 % to ` 1139.9 crore over the forecast period of
                                 FY11-14. In addition, we haven’t factored additional revenues coming in from the
                                 launch of new products which should also help boost revenues and profitability. We
                                 expect Vivimed to maintain ~18% EBITDA margin (excl OI) over the forecasted
                                 period amidst volatile raw material prices. Consequently, we expect the PAT to grow
                                 at a CAGR of 31.7% to ` 111.6 crore in FY14E as compared to ` 48.8 crore in FY11.

                                                                       Revenue and profitability trend

                                                        Rs. Crore                                                         (%)
                                                1200                                                                        25%

                                                1000                                                                       20%
                                                 800
                                                                                                                           15%
                                                 600
                                                                                                                           10%
                                                 400

                                                 200                                                                       5%

                                                    0                                                                      0%
                                                           FY10         FY11        FY12E         FY13E       FY14E

                                                             Revenue           EBIDTA Margin(%)           PAT Margin(%)

                                               Source: Vivimed, Ventura Research


                                  Valuation
                                 At the CMP of ` 343, Vivimed is trading at 6.0x and 5.5x its estimated earnings for
                                 FY13 and FY14. We initiate coverage on Vivimed Labs Ltd as a BUY with a Price
                                 Objective of ` 468 (7.5x FY14 EPS) over a period of 24 months.

                                 We have valued the stock at 36%% premium to its historical average valuation of
                                 5.5x considering the robust product portfolio and the recent acquisitions. However,
                                 post the integration of the acquisitions, we expect Vivimed to be re-rated considering
                                 its enhanced global presence and broadened product portfolio. Vivimed’s earnings
                                 are expected to grow at a 31.7% CAGR over the forecast period FY11-14 which is far
                                 ahead of the sector’s growth.


                                                                                                                                    th
- 14 of 16 -                                                                                                              Thursday 16 Feb, 2012
               This document is for private circulation, and must be read in conjunction with the disclaimer on the last page.
P/E
                                                         800
                                                         700
                                                         600
                                                         500
                                                         400
                                                         300
                                                         200
                                                         100
                                                          0
                                                          Apr-07                 Apr-09             Apr-11               Apr-13
                                                                    CMP       3X          4X      5X         6X     7X


                                                                                    P/Adj.BV
                                                         800
                                                         700
                                                         600
                                                         500
                                                         400
                                                         300
                                                         200
                                                         100
                                                          0
                                                          Apr-07                 Apr-09             Apr-11               Apr-13
                                                               CMP        0.8X        1X         1.2X        1.4X    1.6X


                                                                                   EV/EBIDTA
                                                        1600
                                                        1400
                                                        1200
                                                        1000
                                                         800
                                                         600
                                                         400
                                                         200
                                                           0
                                                           Apr-07                Apr-09             Apr-11           Apr-13
                                                               EV     3.45X        4.45X        5.45X    6.45X      7.45X

                                                 Source: Ventura Research


                                                                                                                                      th
- 15 of 16 -                                                                                                                Thursday 16 Feb, 2012
               This document is for private circulation, and must be read in conjunction with the disclaimer on the last page.
Financials & Projections
    Y/E March, Fig in Rs. Cr          FY 2011 FY 2012e FY 2013e FY 2014e              Y/E March, Fig in Rs. Cr            FY 2011 FY 2012e FY 2013e FY 2014e
    Profit & Loss Statement                                                           Per Share Data (Rs)
    Net Sales                             416.0       636.2      982.1     1139.9     EPS                                     48.0       42.3        57.1         62.4
    % Chg.                                             52.9       54.4        16.1    Cash EPS                                53.9       73.5      106.8         127.8
    Total Expenditure                     331.9       509.7      805.3       934.5    DPS                                      2.0         2.0        2.0          2.0
    % Chg.                                             53.6       58.0        16.0    Book Value                            193.5       326.3      337.8         363.2
    EBDITA                                 84.1       126.5      176.7       205.5    Capital, Liquidity, Returns Ratio
    EBDITA Margin %                        20.2        19.9       18.0        18.0    Debt / Equity (x)                        1.6         0.9        0.9          0.8
    Other Income                             0.9        0.9         1.1        1.2    Current Ratio (x)                        4.6         2.6        3.6          3.5
    PBDIT                                  85.0       127.5      177.8       206.7    ROE (%)                                 24.8       13.0        16.9         17.2
    Depreciation                             9.1       26.1       27.2        29.0    ROCE (%)                                16.4       14.8        16.6         17.5
    Interest                               20.6        26.8       34.7        36.5    Dividend Yield (%)                       0.6         0.6        0.6          0.6
    PBT                                    55.3        74.5      116.0       141.3    Valuation Ratio (x)
    Tax Provisions                           6.4       15.7       24.4        29.7    P/E                                      7.1         8.1        6.0          5.5
    Reported PAT                           48.8        58.9       91.6       111.6    P/BV                                     1.8         1.1        1.0          0.9
    PAT Margin (%)                         11.7         9.3         9.3        9.8    EV/Sales                                 2.4         1.6        1.0          0.9
                                                                                      EV/EBIDTA                               11.9         7.9        5.7          4.9
    Raw Materials / Sales (%)              58.1        59.0       61.0        61.0    Efficiency Ratio (x)
    Manpower cost / Sales (%)                4.8        5.0         5.0        5.0    Inventory (days)                        74.1       75.0        75.0         75.0
    Other Exp / Sales (%)                    7.4        7.3         7.3        7.3    Debtors (days)                        111.9       110.0      110.0         110.0
    Tax Rate (%)                           11.6        21.0       21.0        21.0    Creditors (days)                        41.0       45.0        45.0         45.0


    Balance Sheet                                                                     Cash Flow statement
    Share Capital                          10.2      140.9        76.1        17.9    Profit After Tax                        48.8       58.9        91.6        111.6
    Reserves & Surplus                    186.5      313.7       466.4       632.0    Depreciation                             9.1       26.1        27.2         29.0
    Minority Interest & Others               0.0        0.0         0.0        0.0    Working Capital Changes               -106.2      -25.3      -170.6        -69.0
    Total Loans                           307.7      391.7       511.8       514.5    Others                                   0.5         1.2        0.0          0.0
    Deferred Tax Liability                 14.7        14.7       14.7        14.7    Operating Cash Flow                    -47.8       60.9       -51.8         71.6
    Total Liabilities                     519.1      861.0      1069.0     1179.0     Capital Expenditure                    -28.7      -35.8       -55.2        -84.7
    Goodwill                               84.6        32.6       32.6        32.6    Change in Investment                     9.4     -315.0         0.0          0.0
    Gross Block                           223.3      791.8       823.0       877.7    Cash Flow from Investing               -19.3     -350.8       -55.2        -84.7
    Less: Acc. Depreciation                43.5      251.7       278.8       307.8    Proceeds from equity issue               1.9      201.2         0.0          0.0
    Net Block                             179.7      540.1       544.2       569.9    Inc/ Dec in Debt                        72.4       84.0      120.1           2.7
    Capital Work in Progress                1.7       18.0        42.0        72.0    Dividend and DDT                        -1.7       -3.3       -3.8          -4.2
    Investments                              0.0        0.0         0.0        0.0    Cash Flow from Financing                72.5      281.9      116.3          -1.5
    Net Current Assets                    246.4      263.6       443.5       497.8    Net Change in Cash                       5.5        -8.0        9.2        -14.6
    Misc Expenses                            6.7        6.7         6.7        6.7    Opening Cash Balance                     5.6       11.1         3.1         12.3
    Total Assets                          519.1      861.0      1069.0     1179.0     Closing Cash Balance                    11.1         3.1       12.3         -2.3


Ventura Securities Limited

Corporate Office: C-112/116, Bldg No. 1, Kailash Industrial Complex, Park Site, Vikhroli (W), Mumbai – 400079

This report is neither an offer nor a solicitation to purchase or sell securities. The information and views expressed herein are believed to be reliable, but no
responsibility (or liability) is accepted for errors of fact or opinion. Writers and contributors may be trading in or have positions in the securities mentioned in their
articles. Neither Ventura Securities Limited nor any of the contributors accepts any liability arising out of the above information/articles. Reproduction in whole or
in part without written permission is prohibited. This report is for private circulation.


                                                                                                                                                            th
   - 16 of 16 -                                                                                                                             Thursday 16 Feb, 2012
                        This document is for private circulation, and must be read in conjunction with the disclaimer on the last page.

Weitere ähnliche Inhalte

Was ist angesagt?

Summer training report
Summer training reportSummer training report
Summer training reportMohini Sahu
 
Sandesara Group Corporate Presentation
Sandesara Group Corporate PresentationSandesara Group Corporate Presentation
Sandesara Group Corporate PresentationAICL Communications
 
Company report venus remedies ltd
Company report  venus remedies ltdCompany report  venus remedies ltd
Company report venus remedies ltdFour-S
 
Ranbaxy - Strategy management
Ranbaxy - Strategy managementRanbaxy - Strategy management
Ranbaxy - Strategy managementArchana Patel
 
Chevron Upstream & Gas
Chevron Upstream & GasChevron Upstream & Gas
Chevron Upstream & Gasfinance1
 
Cadila ru4 qfy2010-300410
Cadila ru4 qfy2010-300410Cadila ru4 qfy2010-300410
Cadila ru4 qfy2010-300410Angel Broking
 
Bc 03252010 pres
Bc 03252010 presBc 03252010 pres
Bc 03252010 presvijimba
 
Research Report-SRF
Research Report-SRFResearch Report-SRF
Research Report-SRFAshok Lodha
 
Biocon Investor Presentation_March_2012_9M
Biocon Investor Presentation_March_2012_9MBiocon Investor Presentation_March_2012_9M
Biocon Investor Presentation_March_2012_9MBiocon
 
Roth ligand higgins-foehr 3-12-12
Roth   ligand higgins-foehr 3-12-12Roth   ligand higgins-foehr 3-12-12
Roth ligand higgins-foehr 3-12-12Jennifer Capuzelo
 
Orchid chemical ru4 qfy2010-270510
Orchid chemical ru4 qfy2010-270510Orchid chemical ru4 qfy2010-270510
Orchid chemical ru4 qfy2010-270510Angel Broking
 
The Performance of Every Dividend Aristocrat During The Great Recession
The Performance of Every Dividend Aristocrat During The Great RecessionThe Performance of Every Dividend Aristocrat During The Great Recession
The Performance of Every Dividend Aristocrat During The Great RecessionSure Dividend
 

Was ist angesagt? (18)

Summer training report
Summer training reportSummer training report
Summer training report
 
Sandesara Group Corporate Presentation
Sandesara Group Corporate PresentationSandesara Group Corporate Presentation
Sandesara Group Corporate Presentation
 
Company report venus remedies ltd
Company report  venus remedies ltdCompany report  venus remedies ltd
Company report venus remedies ltd
 
Ranbaxy - Strategy management
Ranbaxy - Strategy managementRanbaxy - Strategy management
Ranbaxy - Strategy management
 
Page Industries
Page IndustriesPage Industries
Page Industries
 
Chevron Upstream & Gas
Chevron Upstream & GasChevron Upstream & Gas
Chevron Upstream & Gas
 
Cadila ru4 qfy2010-300410
Cadila ru4 qfy2010-300410Cadila ru4 qfy2010-300410
Cadila ru4 qfy2010-300410
 
Bc 03252010 pres
Bc 03252010 presBc 03252010 pres
Bc 03252010 pres
 
Research Report-SRF
Research Report-SRFResearch Report-SRF
Research Report-SRF
 
Biocon Investor Presentation_March_2012_9M
Biocon Investor Presentation_March_2012_9MBiocon Investor Presentation_March_2012_9M
Biocon Investor Presentation_March_2012_9M
 
Roth ligand higgins-foehr 3-12-12
Roth   ligand higgins-foehr 3-12-12Roth   ligand higgins-foehr 3-12-12
Roth ligand higgins-foehr 3-12-12
 
24444632 ranbaxy-ppt
24444632 ranbaxy-ppt24444632 ranbaxy-ppt
24444632 ranbaxy-ppt
 
Orchid chemical ru4 qfy2010-270510
Orchid chemical ru4 qfy2010-270510Orchid chemical ru4 qfy2010-270510
Orchid chemical ru4 qfy2010-270510
 
Shiv Vani Oil
Shiv Vani Oil Shiv Vani Oil
Shiv Vani Oil
 
The Performance of Every Dividend Aristocrat During The Great Recession
The Performance of Every Dividend Aristocrat During The Great RecessionThe Performance of Every Dividend Aristocrat During The Great Recession
The Performance of Every Dividend Aristocrat During The Great Recession
 
Ligand Bio Presentation
Ligand Bio PresentationLigand Bio Presentation
Ligand Bio Presentation
 
Colgate Palmolive
Colgate PalmoliveColgate Palmolive
Colgate Palmolive
 
Wockhardt ltd result update
Wockhardt ltd result updateWockhardt ltd result update
Wockhardt ltd result update
 

Ähnlich wie Vivimed labs ltd

ICICI Direct aurobindo_pharma_initiating coverage March 2011
ICICI Direct aurobindo_pharma_initiating coverage March 2011ICICI Direct aurobindo_pharma_initiating coverage March 2011
ICICI Direct aurobindo_pharma_initiating coverage March 2011MasterSun Goldbird
 
Vivimed labs ltd_3QFY15 Presentation
Vivimed labs ltd_3QFY15 PresentationVivimed labs ltd_3QFY15 Presentation
Vivimed labs ltd_3QFY15 PresentationJigar Savla
 
BP Equities_Granules India Ltd_Initiating Coverage_BUY_Trgt 179_27th Apr 2016
BP Equities_Granules India Ltd_Initiating Coverage_BUY_Trgt 179_27th Apr 2016BP Equities_Granules India Ltd_Initiating Coverage_BUY_Trgt 179_27th Apr 2016
BP Equities_Granules India Ltd_Initiating Coverage_BUY_Trgt 179_27th Apr 2016nik18031991
 
chemicals-jublingr-lxchem-7-9-22-pl.pdf
chemicals-jublingr-lxchem-7-9-22-pl.pdfchemicals-jublingr-lxchem-7-9-22-pl.pdf
chemicals-jublingr-lxchem-7-9-22-pl.pdfssuser7a4aeb
 
Fibrocell Science ($FCSC) Rodman & Renshaw update October 2011
Fibrocell Science ($FCSC) Rodman & Renshaw update October 2011Fibrocell Science ($FCSC) Rodman & Renshaw update October 2011
Fibrocell Science ($FCSC) Rodman & Renshaw update October 2011ProActive Capital Resources Group
 
Dai Ichi Karkaria: Buy at CMP and add on declines
Dai Ichi Karkaria: Buy at CMP and add on declinesDai Ichi Karkaria: Buy at CMP and add on declines
Dai Ichi Karkaria: Buy at CMP and add on declinesIndiaNotes.com
 
Hem Securities recommend Camlin Fine Sciences for a target of 145Hem camlin 2...
Hem Securities recommend Camlin Fine Sciences for a target of 145Hem camlin 2...Hem Securities recommend Camlin Fine Sciences for a target of 145Hem camlin 2...
Hem Securities recommend Camlin Fine Sciences for a target of 145Hem camlin 2...IndiaNotes.com
 
Icm aniacs report final
Icm aniacs report finalIcm aniacs report final
Icm aniacs report finalGeorge Cotton
 
Orchid chemicals event update-10-06-10
Orchid chemicals event update-10-06-10Orchid chemicals event update-10-06-10
Orchid chemicals event update-10-06-10Angel Broking
 
Orchid chemicals event update-10-06-10
Orchid chemicals event update-10-06-10Orchid chemicals event update-10-06-10
Orchid chemicals event update-10-06-10Angel Broking
 
Profarma 2Q12
Profarma 2Q12Profarma 2Q12
Profarma 2Q12Profarma
 
Beximco Pharmaceuticals Presentation - In Bangladesh
Beximco  Pharmaceuticals Presentation - In BangladeshBeximco  Pharmaceuticals Presentation - In Bangladesh
Beximco Pharmaceuticals Presentation - In BangladeshTasvir A R Chowdhury
 
Annual Report 2008
Annual Report 2008Annual Report 2008
Annual Report 2008guest2f467f
 

Ähnlich wie Vivimed labs ltd (20)

Bajaj corp initiating coverage report
Bajaj corp initiating coverage reportBajaj corp initiating coverage report
Bajaj corp initiating coverage report
 
Gcpl
GcplGcpl
Gcpl
 
Jefferies pharma (1)
Jefferies   pharma (1)Jefferies   pharma (1)
Jefferies pharma (1)
 
ICICI Direct aurobindo_pharma_initiating coverage March 2011
ICICI Direct aurobindo_pharma_initiating coverage March 2011ICICI Direct aurobindo_pharma_initiating coverage March 2011
ICICI Direct aurobindo_pharma_initiating coverage March 2011
 
Vivimed labs ltd_3QFY15 Presentation
Vivimed labs ltd_3QFY15 PresentationVivimed labs ltd_3QFY15 Presentation
Vivimed labs ltd_3QFY15 Presentation
 
BP Equities_Granules India Ltd_Initiating Coverage_BUY_Trgt 179_27th Apr 2016
BP Equities_Granules India Ltd_Initiating Coverage_BUY_Trgt 179_27th Apr 2016BP Equities_Granules India Ltd_Initiating Coverage_BUY_Trgt 179_27th Apr 2016
BP Equities_Granules India Ltd_Initiating Coverage_BUY_Trgt 179_27th Apr 2016
 
chemicals-jublingr-lxchem-7-9-22-pl.pdf
chemicals-jublingr-lxchem-7-9-22-pl.pdfchemicals-jublingr-lxchem-7-9-22-pl.pdf
chemicals-jublingr-lxchem-7-9-22-pl.pdf
 
Wockhardt ltd
Wockhardt ltdWockhardt ltd
Wockhardt ltd
 
Fibrocell Science ($FCSC) Rodman & Renshaw update October 2011
Fibrocell Science ($FCSC) Rodman & Renshaw update October 2011Fibrocell Science ($FCSC) Rodman & Renshaw update October 2011
Fibrocell Science ($FCSC) Rodman & Renshaw update October 2011
 
FinAccAnalysisBiogen
FinAccAnalysisBiogenFinAccAnalysisBiogen
FinAccAnalysisBiogen
 
Dai Ichi Karkaria: Buy at CMP and add on declines
Dai Ichi Karkaria: Buy at CMP and add on declinesDai Ichi Karkaria: Buy at CMP and add on declines
Dai Ichi Karkaria: Buy at CMP and add on declines
 
Hem Securities recommend Camlin Fine Sciences for a target of 145Hem camlin 2...
Hem Securities recommend Camlin Fine Sciences for a target of 145Hem camlin 2...Hem Securities recommend Camlin Fine Sciences for a target of 145Hem camlin 2...
Hem Securities recommend Camlin Fine Sciences for a target of 145Hem camlin 2...
 
Icm aniacs report final
Icm aniacs report finalIcm aniacs report final
Icm aniacs report final
 
Orchid chemicals event update-10-06-10
Orchid chemicals event update-10-06-10Orchid chemicals event update-10-06-10
Orchid chemicals event update-10-06-10
 
Orchid chemicals event update-10-06-10
Orchid chemicals event update-10-06-10Orchid chemicals event update-10-06-10
Orchid chemicals event update-10-06-10
 
parag ppt.pdf
parag  ppt.pdfparag  ppt.pdf
parag ppt.pdf
 
Profarma 2Q12
Profarma 2Q12Profarma 2Q12
Profarma 2Q12
 
Solazyme Q3 2012 earnings
Solazyme Q3 2012 earningsSolazyme Q3 2012 earnings
Solazyme Q3 2012 earnings
 
Beximco Pharmaceuticals Presentation - In Bangladesh
Beximco  Pharmaceuticals Presentation - In BangladeshBeximco  Pharmaceuticals Presentation - In Bangladesh
Beximco Pharmaceuticals Presentation - In Bangladesh
 
Annual Report 2008
Annual Report 2008Annual Report 2008
Annual Report 2008
 

Mehr von Vinit Bolinjkar LION bolinjkar.vinit@gmail.com

Mehr von Vinit Bolinjkar LION bolinjkar.vinit@gmail.com (20)

Burger King Equity Research & Valuation Webinar Slide Deck| School of Market ...
Burger King Equity Research & Valuation Webinar Slide Deck| School of Market ...Burger King Equity Research & Valuation Webinar Slide Deck| School of Market ...
Burger King Equity Research & Valuation Webinar Slide Deck| School of Market ...
 
Varun Beverages Equity Research & Valuation | School of Market Studies Webina...
Varun Beverages Equity Research & Valuation | School of Market Studies Webina...Varun Beverages Equity Research & Valuation | School of Market Studies Webina...
Varun Beverages Equity Research & Valuation | School of Market Studies Webina...
 
Voltas Equity Research & Valuation | School of Market Studies Webinar Learnin...
Voltas Equity Research & Valuation | School of Market Studies Webinar Learnin...Voltas Equity Research & Valuation | School of Market Studies Webinar Learnin...
Voltas Equity Research & Valuation | School of Market Studies Webinar Learnin...
 
HUL Equity Research & Valuation | School of Market Studies Webinar Learning S...
HUL Equity Research & Valuation | School of Market Studies Webinar Learning S...HUL Equity Research & Valuation | School of Market Studies Webinar Learning S...
HUL Equity Research & Valuation | School of Market Studies Webinar Learning S...
 
Get LinkedIn₹ - Ask Me Anything
Get LinkedIn₹ - Ask Me AnythingGet LinkedIn₹ - Ask Me Anything
Get LinkedIn₹ - Ask Me Anything
 
#Coronavirus Important Facts We Should Know
#Coronavirus Important Facts We Should Know#Coronavirus Important Facts We Should Know
#Coronavirus Important Facts We Should Know
 
Metal Pipe Stocks - Technical Analysis (Weekly Charts)
Metal Pipe Stocks - Technical Analysis (Weekly Charts)Metal Pipe Stocks - Technical Analysis (Weekly Charts)
Metal Pipe Stocks - Technical Analysis (Weekly Charts)
 
Webinar: 10 Businesses With Superlative Moats
Webinar: 10 Businesses With Superlative MoatsWebinar: 10 Businesses With Superlative Moats
Webinar: 10 Businesses With Superlative Moats
 
Multibagger stock picking_using_8_criteria_elimination
Multibagger stock picking_using_8_criteria_eliminationMultibagger stock picking_using_8_criteria_elimination
Multibagger stock picking_using_8_criteria_elimination
 
Dematerialization: A Silent Revolution in the Indian Capital Markets
Dematerialization: A Silent Revolution in the Indian Capital MarketsDematerialization: A Silent Revolution in the Indian Capital Markets
Dematerialization: A Silent Revolution in the Indian Capital Markets
 
Ocl India - Explosive Growth Ahead
Ocl India - Explosive Growth AheadOcl India - Explosive Growth Ahead
Ocl India - Explosive Growth Ahead
 
South Indian Bank
South Indian BankSouth Indian Bank
South Indian Bank
 
India Union Budget 2014-15 | A Holistic Plan of Action
India Union Budget 2014-15 | A Holistic Plan of ActionIndia Union Budget 2014-15 | A Holistic Plan of Action
India Union Budget 2014-15 | A Holistic Plan of Action
 
Technical analysis-select-commodities-april-2013
Technical analysis-select-commodities-april-2013Technical analysis-select-commodities-april-2013
Technical analysis-select-commodities-april-2013
 
India budget-2013-14
India budget-2013-14India budget-2013-14
India budget-2013-14
 
Indian_Pharma_Sector_Technical_Outlook_Dec_2012
Indian_Pharma_Sector_Technical_Outlook_Dec_2012Indian_Pharma_Sector_Technical_Outlook_Dec_2012
Indian_Pharma_Sector_Technical_Outlook_Dec_2012
 
Initiating coverage gmdc_ltd_buy_for_36_per_appreciation
Initiating coverage gmdc_ltd_buy_for_36_per_appreciationInitiating coverage gmdc_ltd_buy_for_36_per_appreciation
Initiating coverage gmdc_ltd_buy_for_36_per_appreciation
 
Petronet lng
Petronet lngPetronet lng
Petronet lng
 
Initiating coverage Mahindra & Mahindra ltd
Initiating coverage  Mahindra & Mahindra ltdInitiating coverage  Mahindra & Mahindra ltd
Initiating coverage Mahindra & Mahindra ltd
 
Tata motors update
Tata motors updateTata motors update
Tata motors update
 

Kürzlich hochgeladen

Stock Market Brief Deck for 4/24/24 .pdf
Stock Market Brief Deck for 4/24/24 .pdfStock Market Brief Deck for 4/24/24 .pdf
Stock Market Brief Deck for 4/24/24 .pdfMichael Silva
 
Amil Baba In Pakistan amil baba in Lahore amil baba in Islamabad amil baba in...
Amil Baba In Pakistan amil baba in Lahore amil baba in Islamabad amil baba in...Amil Baba In Pakistan amil baba in Lahore amil baba in Islamabad amil baba in...
Amil Baba In Pakistan amil baba in Lahore amil baba in Islamabad amil baba in...amilabibi1
 
Managing Finances in a Small Business (yes).pdf
Managing Finances  in a Small Business (yes).pdfManaging Finances  in a Small Business (yes).pdf
Managing Finances in a Small Business (yes).pdfmar yame
 
NO1 WorldWide Genuine vashikaran specialist Vashikaran baba near Lahore Vashi...
NO1 WorldWide Genuine vashikaran specialist Vashikaran baba near Lahore Vashi...NO1 WorldWide Genuine vashikaran specialist Vashikaran baba near Lahore Vashi...
NO1 WorldWide Genuine vashikaran specialist Vashikaran baba near Lahore Vashi...Amil baba
 
Authentic No 1 Amil Baba In Pakistan Authentic No 1 Amil Baba In Karachi No 1...
Authentic No 1 Amil Baba In Pakistan Authentic No 1 Amil Baba In Karachi No 1...Authentic No 1 Amil Baba In Pakistan Authentic No 1 Amil Baba In Karachi No 1...
Authentic No 1 Amil Baba In Pakistan Authentic No 1 Amil Baba In Karachi No 1...First NO1 World Amil baba in Faisalabad
 
The Core Functions of the Bangko Sentral ng Pilipinas
The Core Functions of the Bangko Sentral ng PilipinasThe Core Functions of the Bangko Sentral ng Pilipinas
The Core Functions of the Bangko Sentral ng PilipinasCherylouCamus
 
NO1 Certified Ilam kala Jadu Specialist Expert In Bahawalpur, Sargodha, Sialk...
NO1 Certified Ilam kala Jadu Specialist Expert In Bahawalpur, Sargodha, Sialk...NO1 Certified Ilam kala Jadu Specialist Expert In Bahawalpur, Sargodha, Sialk...
NO1 Certified Ilam kala Jadu Specialist Expert In Bahawalpur, Sargodha, Sialk...Amil Baba Dawood bangali
 
Call Girls Near Delhi Pride Hotel, New Delhi|9873777170
Call Girls Near Delhi Pride Hotel, New Delhi|9873777170Call Girls Near Delhi Pride Hotel, New Delhi|9873777170
Call Girls Near Delhi Pride Hotel, New Delhi|9873777170Sonam Pathan
 
原版1:1复刻温哥华岛大学毕业证Vancouver毕业证留信学历认证
原版1:1复刻温哥华岛大学毕业证Vancouver毕业证留信学历认证原版1:1复刻温哥华岛大学毕业证Vancouver毕业证留信学历认证
原版1:1复刻温哥华岛大学毕业证Vancouver毕业证留信学历认证rjrjkk
 
(办理学位证)美国加州州立大学东湾分校毕业证成绩单原版一比一
(办理学位证)美国加州州立大学东湾分校毕业证成绩单原版一比一(办理学位证)美国加州州立大学东湾分校毕业证成绩单原版一比一
(办理学位证)美国加州州立大学东湾分校毕业证成绩单原版一比一S SDS
 
Financial Leverage Definition, Advantages, and Disadvantages
Financial Leverage Definition, Advantages, and DisadvantagesFinancial Leverage Definition, Advantages, and Disadvantages
Financial Leverage Definition, Advantages, and Disadvantagesjayjaymabutot13
 
212MTAMount Durham University Bachelor's Diploma in Technology
212MTAMount Durham University Bachelor's Diploma in Technology212MTAMount Durham University Bachelor's Diploma in Technology
212MTAMount Durham University Bachelor's Diploma in Technologyz xss
 
(办理原版一样)QUT毕业证昆士兰科技大学毕业证学位证留信学历认证成绩单补办
(办理原版一样)QUT毕业证昆士兰科技大学毕业证学位证留信学历认证成绩单补办(办理原版一样)QUT毕业证昆士兰科技大学毕业证学位证留信学历认证成绩单补办
(办理原版一样)QUT毕业证昆士兰科技大学毕业证学位证留信学历认证成绩单补办fqiuho152
 
The Triple Threat | Article on Global Resession | Harsh Kumar
The Triple Threat | Article on Global Resession | Harsh KumarThe Triple Threat | Article on Global Resession | Harsh Kumar
The Triple Threat | Article on Global Resession | Harsh KumarHarsh Kumar
 
《加拿大本地办假证-寻找办理Dalhousie毕业证和达尔豪斯大学毕业证书的中介代理》
《加拿大本地办假证-寻找办理Dalhousie毕业证和达尔豪斯大学毕业证书的中介代理》《加拿大本地办假证-寻找办理Dalhousie毕业证和达尔豪斯大学毕业证书的中介代理》
《加拿大本地办假证-寻找办理Dalhousie毕业证和达尔豪斯大学毕业证书的中介代理》rnrncn29
 
Vp Girls near me Delhi Call Now or WhatsApp
Vp Girls near me Delhi Call Now or WhatsAppVp Girls near me Delhi Call Now or WhatsApp
Vp Girls near me Delhi Call Now or WhatsAppmiss dipika
 
fca-bsps-decision-letter-redacted (1).pdf
fca-bsps-decision-letter-redacted (1).pdffca-bsps-decision-letter-redacted (1).pdf
fca-bsps-decision-letter-redacted (1).pdfHenry Tapper
 
government_intervention_in_business_ownership[1].pdf
government_intervention_in_business_ownership[1].pdfgovernment_intervention_in_business_ownership[1].pdf
government_intervention_in_business_ownership[1].pdfshaunmashale756
 

Kürzlich hochgeladen (20)

Stock Market Brief Deck for 4/24/24 .pdf
Stock Market Brief Deck for 4/24/24 .pdfStock Market Brief Deck for 4/24/24 .pdf
Stock Market Brief Deck for 4/24/24 .pdf
 
Amil Baba In Pakistan amil baba in Lahore amil baba in Islamabad amil baba in...
Amil Baba In Pakistan amil baba in Lahore amil baba in Islamabad amil baba in...Amil Baba In Pakistan amil baba in Lahore amil baba in Islamabad amil baba in...
Amil Baba In Pakistan amil baba in Lahore amil baba in Islamabad amil baba in...
 
Managing Finances in a Small Business (yes).pdf
Managing Finances  in a Small Business (yes).pdfManaging Finances  in a Small Business (yes).pdf
Managing Finances in a Small Business (yes).pdf
 
NO1 WorldWide Genuine vashikaran specialist Vashikaran baba near Lahore Vashi...
NO1 WorldWide Genuine vashikaran specialist Vashikaran baba near Lahore Vashi...NO1 WorldWide Genuine vashikaran specialist Vashikaran baba near Lahore Vashi...
NO1 WorldWide Genuine vashikaran specialist Vashikaran baba near Lahore Vashi...
 
Authentic No 1 Amil Baba In Pakistan Authentic No 1 Amil Baba In Karachi No 1...
Authentic No 1 Amil Baba In Pakistan Authentic No 1 Amil Baba In Karachi No 1...Authentic No 1 Amil Baba In Pakistan Authentic No 1 Amil Baba In Karachi No 1...
Authentic No 1 Amil Baba In Pakistan Authentic No 1 Amil Baba In Karachi No 1...
 
The Core Functions of the Bangko Sentral ng Pilipinas
The Core Functions of the Bangko Sentral ng PilipinasThe Core Functions of the Bangko Sentral ng Pilipinas
The Core Functions of the Bangko Sentral ng Pilipinas
 
NO1 Certified Ilam kala Jadu Specialist Expert In Bahawalpur, Sargodha, Sialk...
NO1 Certified Ilam kala Jadu Specialist Expert In Bahawalpur, Sargodha, Sialk...NO1 Certified Ilam kala Jadu Specialist Expert In Bahawalpur, Sargodha, Sialk...
NO1 Certified Ilam kala Jadu Specialist Expert In Bahawalpur, Sargodha, Sialk...
 
🔝+919953056974 🔝young Delhi Escort service Pusa Road
🔝+919953056974 🔝young Delhi Escort service Pusa Road🔝+919953056974 🔝young Delhi Escort service Pusa Road
🔝+919953056974 🔝young Delhi Escort service Pusa Road
 
Call Girls Near Delhi Pride Hotel, New Delhi|9873777170
Call Girls Near Delhi Pride Hotel, New Delhi|9873777170Call Girls Near Delhi Pride Hotel, New Delhi|9873777170
Call Girls Near Delhi Pride Hotel, New Delhi|9873777170
 
原版1:1复刻温哥华岛大学毕业证Vancouver毕业证留信学历认证
原版1:1复刻温哥华岛大学毕业证Vancouver毕业证留信学历认证原版1:1复刻温哥华岛大学毕业证Vancouver毕业证留信学历认证
原版1:1复刻温哥华岛大学毕业证Vancouver毕业证留信学历认证
 
(办理学位证)美国加州州立大学东湾分校毕业证成绩单原版一比一
(办理学位证)美国加州州立大学东湾分校毕业证成绩单原版一比一(办理学位证)美国加州州立大学东湾分校毕业证成绩单原版一比一
(办理学位证)美国加州州立大学东湾分校毕业证成绩单原版一比一
 
Financial Leverage Definition, Advantages, and Disadvantages
Financial Leverage Definition, Advantages, and DisadvantagesFinancial Leverage Definition, Advantages, and Disadvantages
Financial Leverage Definition, Advantages, and Disadvantages
 
Q1 2024 Newsletter | Financial Synergies Wealth Advisors
Q1 2024 Newsletter | Financial Synergies Wealth AdvisorsQ1 2024 Newsletter | Financial Synergies Wealth Advisors
Q1 2024 Newsletter | Financial Synergies Wealth Advisors
 
212MTAMount Durham University Bachelor's Diploma in Technology
212MTAMount Durham University Bachelor's Diploma in Technology212MTAMount Durham University Bachelor's Diploma in Technology
212MTAMount Durham University Bachelor's Diploma in Technology
 
(办理原版一样)QUT毕业证昆士兰科技大学毕业证学位证留信学历认证成绩单补办
(办理原版一样)QUT毕业证昆士兰科技大学毕业证学位证留信学历认证成绩单补办(办理原版一样)QUT毕业证昆士兰科技大学毕业证学位证留信学历认证成绩单补办
(办理原版一样)QUT毕业证昆士兰科技大学毕业证学位证留信学历认证成绩单补办
 
The Triple Threat | Article on Global Resession | Harsh Kumar
The Triple Threat | Article on Global Resession | Harsh KumarThe Triple Threat | Article on Global Resession | Harsh Kumar
The Triple Threat | Article on Global Resession | Harsh Kumar
 
《加拿大本地办假证-寻找办理Dalhousie毕业证和达尔豪斯大学毕业证书的中介代理》
《加拿大本地办假证-寻找办理Dalhousie毕业证和达尔豪斯大学毕业证书的中介代理》《加拿大本地办假证-寻找办理Dalhousie毕业证和达尔豪斯大学毕业证书的中介代理》
《加拿大本地办假证-寻找办理Dalhousie毕业证和达尔豪斯大学毕业证书的中介代理》
 
Vp Girls near me Delhi Call Now or WhatsApp
Vp Girls near me Delhi Call Now or WhatsAppVp Girls near me Delhi Call Now or WhatsApp
Vp Girls near me Delhi Call Now or WhatsApp
 
fca-bsps-decision-letter-redacted (1).pdf
fca-bsps-decision-letter-redacted (1).pdffca-bsps-decision-letter-redacted (1).pdf
fca-bsps-decision-letter-redacted (1).pdf
 
government_intervention_in_business_ownership[1].pdf
government_intervention_in_business_ownership[1].pdfgovernment_intervention_in_business_ownership[1].pdf
government_intervention_in_business_ownership[1].pdf
 

Vivimed labs ltd

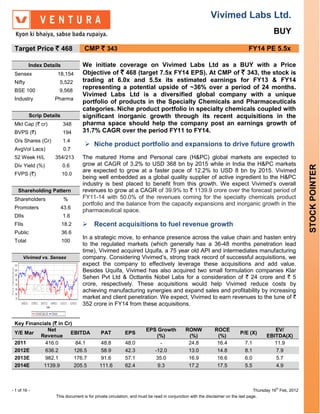
  • 1. Vivimed Labs Ltd. BUY Target Price ` 468 CMP ` 343 FY14 PE 5.5x Index Details We initiate coverage on Vivimed Labs Ltd as a BUY with a Price Sensex 18,154 Objective of ` 468 (target 7.5x FY14 EPS). At CMP of ` 343, the stock is Nifty 5,522 trading at 6.0x and 5.5x its estimated earnings for FY13 & FY14 BSE 100 9,568 representing a potential upside of ~36% over a period of 24 months. Vivimed Labs Ltd is a diversified global company with a unique Industry Pharma portfolio of products in the Specialty Chemicals and Pharmaceuticals categories. Niche product portfolio in specialty chemicals coupled with Scrip Details significant inorganic growth through its recent acquisitions in the Mkt Cap (` cr) 348 pharma space should help the company post an earnings growth of BVPS (`) 194 31.7% CAGR over the period FY11 to FY14. O/s Shares (Cr) 1.4  Niche product portfolio and expansions to drive future growth AvgVol Lacs) 0.7 52 Week H/L 354/213 The matured Home and Personal care (H&PC) global markets are expected to Div Yield (%) 0.6 grow at CAGR of 3.2% to USD 368 bn by 2015 while in India the H&PC markets STOCK POINTER are expected to grow at a faster pace of 12.2% to USD 8 bn by 2015. Vivimed FVPS (`) 10.0 being well embedded as a global quality supplier of active ingredient to the H&PC industry is best placed to benefit from this growth. We expect Vivimed’s overall Shareholding Pattern revenues to grow at a CAGR of 39.9% to ` 1139.9 crore over the forecast period of Shareholders % FY11-14 with 50.0% of the revenues coming for the specialty chemicals product portfolio and the balance from the capacity expansions and inorganic growth in the Promoters 43.6 pharmaceutical space. DIIs 1.6 FIIs 18.2  Recent acquisitions to fuel revenue growth Public 36.6 In a strategic move, to enhance presence across the value chain and hasten entry Total 100 to the regulated markets (which generally has a 36-48 months penetration lead time), Vivimed acquired Uquifa, a 75 year old API and intermediates manufacturing Vivimed vs. Sensex company. Considering Vivimed’s, strong track record of successful acquisitions, we expect the company to effectively leverage these acquisitions and add value. Besides Uquifa, Vivimed has also acquired two small formulation companies Klar Sehen Pvt Ltd & Octtantis Nobel Labs for a consideration of ` 24 crore and ` 5 crore, respectively. These acquisitions would help Vivimed reduce costs by achieving manufacturing synergies and expand sales and profitability by increasing market and client penetration. We expect, Vivimed to earn revenues to the tune of ` 352 crore in FY14 from these acquisitions. Key Financials (` in Cr) Net EPS Growth RONW ROCE EV/ Y/E Mar EBITDA PAT EPS P/E (X) Revenue (%) (%) (%) EBITDA(X) 2011 416.0 84.1 48.8 48.0 - 24.8 16.4 7.1 11.9 2012E 636.2 126.5 58.9 42.3 -12.0 13.0 14.8 8.1 7.9 2013E 982.1 176.7 91.6 57.1 35.0 16.9 16.6 6.0 5.7 2014E 1139.9 205.5 111.6 62.4 9.3 17.2 17.5 5.5 4.9 - 1 of 16 - Thursday 16th Feb, 2012 This document is for private circulation, and must be read in conjunction with the disclaimer on the last page.
  • 2.  Significant entry barriers to ensure limited competition leading to sustainability of revenues In the active ingredients market where product quality has precedence over price, becoming a preferred supplier to global majors is a strenuous and prolonged process. Vivimed with its quality offering has established strong relationships with global majors and over time has embedded itself within these multinationals and now is a supplier across a wide range of products.  Valuation At the CMP of ` 343, Vivimed is trading at 6.0x and 5.5x its estimated earnings for FY13 and FY14. We initiate coverage on Vivimed Labs Ltd as a BUY with a Price Objective of ` 468 (7.5x FY14 EPS) over a period of 24 months. We have valued the stock at 36% premium to its historical average valuation of 5.5x considering the robust product portfolio and the recent acquisitions. Vivimed’s earnings are expected to grow at a 31.7% CAGR over the forecast period FY11-14 which is far ahead of the sector’s growth. Post the integration of the acquisitions, we expect Vivimed to be re-rated considering its enhanced global presence and broadened product portfolio. Though, mounting debt remains an overhang on the stock. th - 2 of 16 - Thursday 16 Feb, 2012 This document is for private circulation, and must be read in conjunction with the disclaimer on the last page.
  • 3.  Company background Vivimed was established in 1989 as a single product (VIV-20) and single location company. Since then the company has grown by leaps and bounds to emerge as a preferred supplier of several key ingredients to MNCs in the specialty chemicals & pharmaceutical segments. In the specialty chemical division, Vivimed is engaged in the manufacturing and marketing of active ingredients within the Home & Personal Care products, and Industrial care products. While, in the pharmaceutical division, the company provides contract manufacturing services as well as undertakes manufacturing and marketing of branded formulations. In addition, Vivimed through timely acquisitions of James Robinson, Harmet International as well as the recent acquisition of Uquifa, has maintained its growth trajectory as well as further enhanced its presence in the global markets. Vivimed Labs- Business Organization VIVIMED LABS Specialty Pharmaceuticals Chemicals CRAMs Formulations APIs Active Industrial Ingredients Care Uquifa Vivimed Labs India Prod.,Sales and (Prod, Dist & R&D) Klar Sehen Prod & Marketing Marketing Vivimed Labs (Marketing &Distribution) Creative Healthcare Octtantis Nobel Vivimed Labs UK (Prod & Dist) Distribution (Sales, Marketing and R&D) Vivimed Labs USA (Production, Sales and R&D) Source: Vivimed, Ventura Research th - 3 of 16 - Thursday 16 Feb, 2012 This document is for private circulation, and must be read in conjunction with the disclaimer on the last page.
  • 4. Headquartered in Hyderabad, Vivimed operates out of 9 manufacturing facilities (6 domestic and 3 overseas), 3 R&D facilities (1 domestic and 2 overseas). It has a customer base spread across 50 countries with SBUs based in America (Vivimed Labs USA Inc) and Europe (Vivimed Labs Europe) along with a marketing office in China. Manufacturing Plants of Vivimed Labs Plant Location Manufacturing Details Bidar Northern Karnataka Specialty Chemicals Sunscreens, Anti Microbial and Preservatives Bonthapally Hyderabad Specialty Chemicals Home & Personal Care actives Jeedimetla Hyderabad Formulation and R&D Dosage formulations Haridwar Uttarakhand Formulations Sterile products - Small Volume Parentals Kashipur Uttarakhand Formulations Non-Sterile Syrups, tablets, Capulses and dry powders. Cuernavaca Mexico APIs Acquired through Uquifa Acquisition Sant Celoni Spain APIs Acquired through Uquifa Acquisition Llica de Vall Spain APIs Acquired through Uquifa Acquisition Chouttuppal* Hyderabad Formulations Tablets & Capsules Srikakulam** AP SEZ Synthetic organic chemicals Source: Vivimed, Ventura Research  Niche product portfolio and expansions to drive future growth The matured Home and Personal Care (H&PC) global markets are expected to grow to USD 368 bn by 2015 while the Indian H&PC markets are expected to grow at a faster pace of 12.2% to USD 8 bn by 2015. Vivimed being well embedded as a global quality supplier of the active ingredient to the H&PC industry is best placed to benefit from this growth. We expect Vivimed’s overall revenues to grow at a CAGR of 39.9% to ` 1139.9 crore over the forecast period of FY11-14 with 50.0% of the revenues coming for the specialty chemicals product portfolio and the balance from the capacity expansions and inorganic growth in the pharmaceutical space. Revenue and Profitability trend Rs. Crore (%) 1200 25% 1000 Triclosan Triclosan CaGp Triclosan CaGp 20% Avobenzone 800 CaGp Avobenzone Climbazole Ben 4 Triclosan Avobenzone Climbazole 15% TCC Triclosan CaGp Climbazole Ben 4 Starcat Triclossan 600 CaGp Avobenzone Ben 4 TCC ZnPTO CaGP Avobenzone Climbazole Starcat 10% TCC SAP* 400 ZnPTO 200 5% 0 0% FY10 FY11 FY12E FY13E FY14E Revenue EBIDTA Margin(%) PAT Margin(%) Source: Vivimed, Ventura Research Avis Avis Ben-4 Avis Avis Ben-4 Dantuff-z Ben 4 Ben 4 Dantuff-z Etone Etone Co-Guars Vivinol th - 4 of 16 - Thursday 16 Feb, 2012 This document is for private circulation, and must be read in conjunction with the disclaimer on the last page.
  • 5.  Specialty chemical business - a major contributor to growth Led by ` 25 crore worth of expansions at its existing two specialty chemical plants, we expect the specialty chemical division to grow at a three year CAGR of 21.7% to ` 570.3 crore by FY14. Vivimeds portfolio of active ingredients caters to nearly 75% of the global H&PC market (USD 268 bn, 3.2% CAGR) and with these enhanced capacities the company is expected to benefit immensely. Specialty Chemicals-Revenue and EBITDA Margin Rs. Crore (%) 600 25 500 20 400 15 300 10 200 100 5 0 - FY11 FY12E FY13E FY14E Revenue EBIDTA Margin RHS (%) Source: Vivimed, Ventura Research H&PC Products dominates the specialty segments business 1% 1% 2% Hair Care 6% Pharmace Antimicrobles 6% 26% uticals Sun Care 22% Intermediaries 9% Oral Care Photohromics 13% Other Chemicals Specialty Chemicals 18% Imaging 78% Skin Care 18% Preservatives Source: Vivimed, Ventura Research th - 5 of 16 - Thursday 16 Feb, 2012 This document is for private circulation, and must be read in conjunction with the disclaimer on the last page.
  • 6. Robust Industry growth to support revenue growth Global Personal Care Market Domestic Personal Care Ingredient Market USD bn USD mn 400 368 900 354 800 328 341 800 350 315 291 303 300 280 700 250 600 200 500 150 400 350 100 300 50 200 0 100 2008 2009 2010 2011 2012 2013 2014 2015 0 2009 2015 Source:Vivimed,Ventura Research Source:Vivimed,Ventura Research Global Personal Care Ingredient Market Global Personal Care Ingredient Market Breakup USD bn Oral Others 20 Care 6% 9% 15 15 10 10 Skin care Hair 50% 5 Care 35% 0 2009 2015 Source:Vivimed,Ventura Research Source:Vivimed,Ventura Research James Robinson acquisition - complete portfolio offering in the Hair care segment. Vivimed’s product portfolio is dominated by the products in the Sun Care, Hair Care and Anti microbial segments. Post the acquisition of James Robinson’s, Vivimed has a complete portfolio of Hair Care products catering to each sub segment of Shampoos, Conditioners, and Hair Dyes. Vivimed also has a tie up with International Specialty Products (ISP) for the joint marketing of various sunscreen products thus expanding its base in Sun Care segment. th - 6 of 16 - Thursday 16 Feb, 2012 This document is for private circulation, and must be read in conjunction with the disclaimer on the last page.
  • 7. Product portfolio in Home & Personal Care Divisions Products Description & End Uses Key Clients VIV-20 Antibacterial For Toothpastes & Mouthwash Unilever, VIVCAL-G Nutraceutical, Dental enamel protection Oral Care P&G, Dabur, VIVHEX Antibacterial for Mouthwash BDF VIVHEX-G Antibacterial for Mouthwash AVIS Broad Spectrum UV-A Filter CINNAMON UV- B Category 1 Filter Unilever, BEN-3 Oil Soluble UV-A & UV -B Filter Sun Care P&G, L'Oreal, Ben-4 Water Soluble UV-A & UV -B Filter BDF OCTYNE-B Oil Soluble UV- B Filter ETONE UA-A & UV- B Filter VINTOX Anti-Oxidant & Anti-aging Molecule VIVINOL Skin Lightening agent BASF, Skin Care TRU ALOE Skin Moisturizer Sederma C-VITE Anti Wrinkle DANTUFF-Z Broad Spectrum Anti Dandruff agent DANTUFF-C Anti-Fungal agent in transparent Shampoos DANTUFF-K Anti dandruff & Anti-Fungal agent Hair Care Unilever, ITC, VIPIROX Anti dandruff agent Dabur VIVIDINE Hair growth agent CO-GUAR Emollients & Conditioners COSVAT Anti-Fungal & Anti bacterial Preservatives VIVILIDE Wide Spectrum bacteriostatic Unilever, VIVMAX Antimicrobial & Germicidal Antimicrobials BASF, J&J VIV-20 Antibacterial For Cosmetic & Toiletries Source: Vivimed, Ventura Research  Industrial segment to complement growth in H&PC In addition to Home & Personal Care segment, Vivimed caters to the Industrial Segment with products in photo chromatic dyes and imaging chemicals. In the photo chromatic segment, Vivimed is a world leader in the development of innovative photo chromic dyes manufactured and marketed under the name of Reversacol. Product Portfolio in Industrial Care Category Key Products Description End Uses Key Clients Photochromic Lenses, toys, films, Clothes, Keystone, Corning, Reversacol Patented high Performance dyes Dyes Cosmetics like nail Varnish Mildex Optical Phenidone Black and White development agent Imaging Dimezone Black and white developing agent Anti- X-rays, Photography Kodak, Fuji, LG Chemicals Nitroindazole fogging agent Source: Vivimed, Ventura Research th - 7 of 16 - Thursday 16 Feb, 2012 This document is for private circulation, and must be read in conjunction with the disclaimer on the last page.
  • 8.  SEZ facility on the cards Vivimed is also establishing a SEZ in Andhra Pradesh at a cost of ` 120 crore to cater to the growing export demand of synthetic organic chemicals in the H&PC segment. In addition, the company is expanding its product base by foraying into new segments with the development of a Skin lightening ingredient and chemicals for Printed Electronics. Since the SEZ is expected to commission post FY14, we have not factored these in our revenues.  Product portfolio and expansions in Pharma to further enhance value Vivimed has a wide range of formulation products across therapeutic segments with significant presence in CRAMs.This segment is poised for major growth fuelled by capacity expansions and acquisitions. Vivimed is setting up a green field plant in Hyderabad, at an investment of ` 40 crore and is undertaking some de-bottlenecking exercises at its existing Jeedimetla plant. Further the company has acquired Uquifa, Klar Sehen and Octtantis Nobel in the API and branded formulations space. Aided by these expansions and recent acquisitions, we expect the revenues to receive a major boost and grow at a CAGR of 78.8% to ` 569.6 crore over the forecast period (2011- 14). Pharma - Revenue and EBIDTA Margin Rs. Crore (%) 600 25 500 20 400 15 300 10 200 100 5 0 - FY11 FY12E FY13E FY14E Revenue EBIDTA Margin RHS (%) Source: Vivimed, Ventura Research th - 8 of 16 - Thursday 16 Feb, 2012 This document is for private circulation, and must be read in conjunction with the disclaimer on the last page.
  • 9. Vivimed Pharmaceutical Product Portfolio CAPSULES/TABLETS SYRUPS & LIQUIDS SMALL VOLUME PARENTALS FLEXASUR CODAREX OTRIVIN SPASMOCIP PLUS INALGEL NASIVION MOIST CODARIN VISCODYNE NASIVION BUTAPROXIVON BROZEDEX CANDBIOTIC EAR VALENZIA TABLETS CELADRIN DROP ARACHITOL TABLET MITS CODEINE OTRIVIN NASAL C PINK TABLET LINCTUS SPRAY CANDID LOTION TOBROP CANDID MOUTH PAINT MERCK CRAMS NOVARTIS RANBAXY GLENMARK CIPLA LUPIN Source: Vivimed, Ventura Research  Recent acquisitions to fuel revenue growth In a strategic move, to enhance presence across the value chain and hasten entry to the regulated markets (which generally has a 36-48 months penetration time), Vivimed acquired Uquifa, a 75 year old API and intermediates manufacturing company. Considering Vivimed’s, strong track record of successful acquisitions, we expect the company to effectively leverage the acquisition and add value. Besides Uquifa, Vivimed has also acquired two small formulation companies Klar Sehen Pvt Ltd & Octtantis Nobel Labs for a consideration of ` 24 crore and ` 5 crore respectively. These acquisitions would help Vivimed reduce costs by achieving manufacturing synergies and expand sales and profitability by increasing market and client penetration. We estimate Vivimed to earn revenues to the tune of ` 352 crore in FY14 from these acquisitions. th - 9 of 16 - Thursday 16 Feb, 2012 This document is for private circulation, and must be read in conjunction with the disclaimer on the last page.
  • 10. Profile of Major strategic acquisitions James Robinson Harmet Klar Sehen Pvt Octtantis Nobel Uquifa, Spain & Acquisition Ltd International Ltd Labs Mexico Year of 2008 2009 2011 2011 2011 Acquisition Cost of USD 21 mn USD 3 mn Rs 24 crore Rs 5 crore USD 55 mn Acquisition Stake 100% 100% 100% 60% 100% Photochromic Dyes Active Sales and Pharmaceuticals & and Imaging Ophthalmic Products Pharmaceutical Distribution Nutraceuticals Products Chemicals Products Complements Strong marketing Direct entry to Foray into booming Rationale of Niche product Vivimed’s portfolio in field force to help the developed generic API Acquisition portfolio. high growth expand distribution markets. segment. ophthalmic segment. reach. Source: Vivimed, Ventura research  Uquifa- a unique value proposition Vivimed has acquired it for a consideration of USD 55 million (` 286 crore) funded through a debt equity mix of 65:35. Vivimed’s equity infusion of USD 20 million is via an SPV (Vivimed Labs Spain S.L), debt financing of USD 25 million has been provided by Exim Bank and balance USD 10 million is by the way of deferred payments. Benefits of Uquifa acquisition Source: Vivimed, Ventura Research  Other two acquisitions in branded formulations to enhance presence in domestic biz In addition to Uquifa, Vivimed in its acquisition spree acquired two formulation companies in India, Klar Sehen Pvt Ltd (KSPL) (100% stake) and Octtantis Nobel th - 10 of 16 - Thursday 16 Feb, 2012 This document is for private circulation, and must be read in conjunction with the disclaimer on the last page.
  • 11. Labs (50% stake) in 2011 for ` 24 crore and ` 5 crore respectively with presence in manufacturing and marketing of branded formulations. Benefits KSPL and Octtantis acquisition Presence in North- 150 MRs East, Bihar & AP Strong Distribution Reach KSPL Presence in Octtantis Pharmaceutical Nobel & Nutraceutical 50 Trade cGMP compliant Labs Segment Marks manuf acturing f acility at Kolkata & Hyderbad Source: Vivimed, Ventura Research  Significant entry barriers to ensure limited competition and sustainability of growth In the active ingediants market where product quality has precedence over price, becoming a preferred supplier to global majors is a strenuous and prolonged process. Vivimed with its quality offering has established strong relationships with global majors and over a time period has embedded itself within these multinationals and now is a supplier across a wide range of products. Timeline of Product Basket Expansion Unilever L’oreal P&G Source: Vivimed, Ventura Research th - 11 of 16 - Thursday 16 Feb, 2012 This document is for private circulation, and must be read in conjunction with the disclaimer on the last page.
  • 12. Typical time-line to be embedded as a vendor to an MNC is 5-7 years thus raising the competitive bar. Further, the contracts are long term in nature ensuring stable revenues for a longer period of time. Considering these huge entry barriers, and expanding product portfolio of Vivimed, we are very comfortable with regards to revenue visibility. Activity Timelines Sample Quantities 3 to 6 months Small/Trial Batches 6 to 9 months Stabilization period 15 to 18 months Commercial Quantities 6 to 9 Months Source: Vivimed, Ventura Research Vivimed’s strong skill set for innovations, research based idea-generation right from creation of a molecule to partnering with a manufacturer provides the company with a significant competitive edge.  KEY CONCERNS  Mounting debt, a key risk to profitability Especially in the current high interest environment, Vivimed’s debt by FY14 would be very high at `515 crore (debt equity ratio of 0.8). Since along with debt, significant equity dilution has already been done leaving with very little scope for further expansion of equity. As the cash flows are strong, we forsee no issues with regards to debt serviceability. However, a sharp deterioration of economic environment & rise in interest rates can impact adversely. Debt to Equity Interest Coverage to Debt/EBIDTA (Rs.Crore) (%) (%) 1400 1.8 7.0 4.0 1200 1.6 6.0 3.5 1.4 3.0 1000 5.0 1.2 2.5 800 1 4.0 0.8 2.0 600 3.0 0.6 1.5 400 0.4 2.0 1.0 200 0.2 1.0 0.5 0 0 0.0 0.0 FY11 FY12E FY12E FY14E FY11 FY12E FY13E FY14E Debt Debt to Equity Interest Coverage Ratio Debt/EBIDTA (RHS) Source:Vivimed, Ventura Research Source: Vivimed, Ventura Research th - 12 of 16 - Thursday 16 Feb, 2012 This document is for private circulation, and must be read in conjunction with the disclaimer on the last page.
  • 13.  Foreign Exchange Risk Vivimed derives ~ 44% (FY11) of its revenue from the export markets which are set to rise further considering the recent acquisition abroad. Any adverse movement in the USD/INR in the wake of current global economic turmoil might affect company’s revenue and profitability adversely.  Financial performance Vivimed Ltd has witnessed a steady 59.1% yoy growth in its top line to ` 168.0 crore in Q3FY12 as against ` 105.6 crore in Q3FY11 led by consolidation of the recently acquired pharmaceutical companies. The EBITDA margins stood at healthy 19.8%. While, the PAT margins stood at 9.5%. We believe that Vivimed would register a strong growth in revenues in quarters to come led by strong product portfolio and recent acquisitions. In our view, the recent acquisitions would help the company maintain margins and foster a strong growth thus adding significant value. Further, the expansions would ensure growth in the current portfolio base ensuring a double benefit with mounting debt being the only concern. Quarterly Financial Performance Particulars Q3FY12 Q3FY11 FY11 FY10 Net Sales 168.0 105.6 416.9 343.4 Growth % 59.1 21.4 Total Expenditure 136.4 81.4 331.9 279.1 EBITDA 33.2 24.2 85.0 64.3 EBITDA Margin % 19.8 22.9 20.3 18.7 Depreciation 6.9 1.5 9.1 8.7 EBIT (EX OI) 26.3 22.7 75.9 55.6 Other Income 0.0 0.0 0.01 6.8 EBIT 26.3 22.7 75.9 62.4 Margin % 15.7 21.5 18.2 18.1 Interest 5.9 6.0 20.6 22.8 Exceptional items 0.0 0 0.0 0.0 PBT 20.4 16.7 55.3 39.6 Margin % 12.1 15.8 13.2 11.5 Provision for Tax 4.4 3.4 6.4 8.6 PAT 16.0 13.3 48.8 31.0 PAT Margin (%) 9.5 12.6 11.7 9.0 Source: Vivimed, Ventura Research th - 13 of 16 - Thursday 16 Feb, 2012 This document is for private circulation, and must be read in conjunction with the disclaimer on the last page.
  • 14.  Financial outlook Aided by strategic acquisitions and continuous expansions, we expect Vivimed revenues to grow at a CAGR of 39.9 % to ` 1139.9 crore over the forecast period of FY11-14. In addition, we haven’t factored additional revenues coming in from the launch of new products which should also help boost revenues and profitability. We expect Vivimed to maintain ~18% EBITDA margin (excl OI) over the forecasted period amidst volatile raw material prices. Consequently, we expect the PAT to grow at a CAGR of 31.7% to ` 111.6 crore in FY14E as compared to ` 48.8 crore in FY11. Revenue and profitability trend Rs. Crore (%) 1200 25% 1000 20% 800 15% 600 10% 400 200 5% 0 0% FY10 FY11 FY12E FY13E FY14E Revenue EBIDTA Margin(%) PAT Margin(%) Source: Vivimed, Ventura Research  Valuation At the CMP of ` 343, Vivimed is trading at 6.0x and 5.5x its estimated earnings for FY13 and FY14. We initiate coverage on Vivimed Labs Ltd as a BUY with a Price Objective of ` 468 (7.5x FY14 EPS) over a period of 24 months. We have valued the stock at 36%% premium to its historical average valuation of 5.5x considering the robust product portfolio and the recent acquisitions. However, post the integration of the acquisitions, we expect Vivimed to be re-rated considering its enhanced global presence and broadened product portfolio. Vivimed’s earnings are expected to grow at a 31.7% CAGR over the forecast period FY11-14 which is far ahead of the sector’s growth. th - 14 of 16 - Thursday 16 Feb, 2012 This document is for private circulation, and must be read in conjunction with the disclaimer on the last page.
  • 15. P/E 800 700 600 500 400 300 200 100 0 Apr-07 Apr-09 Apr-11 Apr-13 CMP 3X 4X 5X 6X 7X P/Adj.BV 800 700 600 500 400 300 200 100 0 Apr-07 Apr-09 Apr-11 Apr-13 CMP 0.8X 1X 1.2X 1.4X 1.6X EV/EBIDTA 1600 1400 1200 1000 800 600 400 200 0 Apr-07 Apr-09 Apr-11 Apr-13 EV 3.45X 4.45X 5.45X 6.45X 7.45X Source: Ventura Research th - 15 of 16 - Thursday 16 Feb, 2012 This document is for private circulation, and must be read in conjunction with the disclaimer on the last page.
  • 16. Financials & Projections Y/E March, Fig in Rs. Cr FY 2011 FY 2012e FY 2013e FY 2014e Y/E March, Fig in Rs. Cr FY 2011 FY 2012e FY 2013e FY 2014e Profit & Loss Statement Per Share Data (Rs) Net Sales 416.0 636.2 982.1 1139.9 EPS 48.0 42.3 57.1 62.4 % Chg. 52.9 54.4 16.1 Cash EPS 53.9 73.5 106.8 127.8 Total Expenditure 331.9 509.7 805.3 934.5 DPS 2.0 2.0 2.0 2.0 % Chg. 53.6 58.0 16.0 Book Value 193.5 326.3 337.8 363.2 EBDITA 84.1 126.5 176.7 205.5 Capital, Liquidity, Returns Ratio EBDITA Margin % 20.2 19.9 18.0 18.0 Debt / Equity (x) 1.6 0.9 0.9 0.8 Other Income 0.9 0.9 1.1 1.2 Current Ratio (x) 4.6 2.6 3.6 3.5 PBDIT 85.0 127.5 177.8 206.7 ROE (%) 24.8 13.0 16.9 17.2 Depreciation 9.1 26.1 27.2 29.0 ROCE (%) 16.4 14.8 16.6 17.5 Interest 20.6 26.8 34.7 36.5 Dividend Yield (%) 0.6 0.6 0.6 0.6 PBT 55.3 74.5 116.0 141.3 Valuation Ratio (x) Tax Provisions 6.4 15.7 24.4 29.7 P/E 7.1 8.1 6.0 5.5 Reported PAT 48.8 58.9 91.6 111.6 P/BV 1.8 1.1 1.0 0.9 PAT Margin (%) 11.7 9.3 9.3 9.8 EV/Sales 2.4 1.6 1.0 0.9 EV/EBIDTA 11.9 7.9 5.7 4.9 Raw Materials / Sales (%) 58.1 59.0 61.0 61.0 Efficiency Ratio (x) Manpower cost / Sales (%) 4.8 5.0 5.0 5.0 Inventory (days) 74.1 75.0 75.0 75.0 Other Exp / Sales (%) 7.4 7.3 7.3 7.3 Debtors (days) 111.9 110.0 110.0 110.0 Tax Rate (%) 11.6 21.0 21.0 21.0 Creditors (days) 41.0 45.0 45.0 45.0 Balance Sheet Cash Flow statement Share Capital 10.2 140.9 76.1 17.9 Profit After Tax 48.8 58.9 91.6 111.6 Reserves & Surplus 186.5 313.7 466.4 632.0 Depreciation 9.1 26.1 27.2 29.0 Minority Interest & Others 0.0 0.0 0.0 0.0 Working Capital Changes -106.2 -25.3 -170.6 -69.0 Total Loans 307.7 391.7 511.8 514.5 Others 0.5 1.2 0.0 0.0 Deferred Tax Liability 14.7 14.7 14.7 14.7 Operating Cash Flow -47.8 60.9 -51.8 71.6 Total Liabilities 519.1 861.0 1069.0 1179.0 Capital Expenditure -28.7 -35.8 -55.2 -84.7 Goodwill 84.6 32.6 32.6 32.6 Change in Investment 9.4 -315.0 0.0 0.0 Gross Block 223.3 791.8 823.0 877.7 Cash Flow from Investing -19.3 -350.8 -55.2 -84.7 Less: Acc. Depreciation 43.5 251.7 278.8 307.8 Proceeds from equity issue 1.9 201.2 0.0 0.0 Net Block 179.7 540.1 544.2 569.9 Inc/ Dec in Debt 72.4 84.0 120.1 2.7 Capital Work in Progress 1.7 18.0 42.0 72.0 Dividend and DDT -1.7 -3.3 -3.8 -4.2 Investments 0.0 0.0 0.0 0.0 Cash Flow from Financing 72.5 281.9 116.3 -1.5 Net Current Assets 246.4 263.6 443.5 497.8 Net Change in Cash 5.5 -8.0 9.2 -14.6 Misc Expenses 6.7 6.7 6.7 6.7 Opening Cash Balance 5.6 11.1 3.1 12.3 Total Assets 519.1 861.0 1069.0 1179.0 Closing Cash Balance 11.1 3.1 12.3 -2.3 Ventura Securities Limited Corporate Office: C-112/116, Bldg No. 1, Kailash Industrial Complex, Park Site, Vikhroli (W), Mumbai – 400079 This report is neither an offer nor a solicitation to purchase or sell securities. The information and views expressed herein are believed to be reliable, but no responsibility (or liability) is accepted for errors of fact or opinion. Writers and contributors may be trading in or have positions in the securities mentioned in their articles. Neither Ventura Securities Limited nor any of the contributors accepts any liability arising out of the above information/articles. Reproduction in whole or in part without written permission is prohibited. This report is for private circulation. th - 16 of 16 - Thursday 16 Feb, 2012 This document is for private circulation, and must be read in conjunction with the disclaimer on the last page.