This document contains a final exam for a Microsoft Excel course. The exam tests students on identifying parts of Excel charts and chart types. The exam has three sections: 1) Fill in the blank with the names of 10 chart parts, 2) Match 12 chart parts with their descriptions, and 3) Identify the chart type and sub-type of 6 sample charts.
Micro-Scholarship, What it is, How can it help me.pdf
00 Com Ed 3 Final
1. JOJI ILAGAN CAREER CENTER FOUNDATION, INC.
COLLEGE OF BUSINESS AND TOURISM
Gov. Chavez Street, Davao City
FINAL EXAMINATION
Com Ed 3 – Microsoft Excel
Jeff Rey A. Comidoy – Instructor
1st Semester, SY 2011-2012
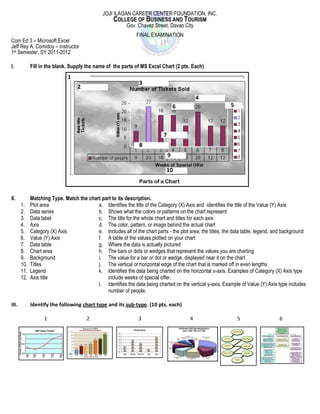
I. Fill in the blank. Supply the name of the parts of MS Excel Chart (2 pts. Each)
1
3
2
4
6 5
7
8
9
10
II. Matching Type. Match the chart part to its description.
1. Plot area a. Identifies the title of the Category (X) Axis and identifies the title of the Value (Y) Axis
2. Data series b. Shows what the colors or patterns on the chart represent
3. Data label c. The title for the whole chart and titles for each axis
4. Axis d. The color, pattern, or image behind the actual chart
5. Category (X) Axis e. Includes all of the chart parts - the plot area, the titles, the data table, legend, and background
6. Value (Y) Axis f. A table of the values plotted on your chart
7. Data table g. Where the data is actually pictured
8. Chart area h. The bars or dots or wedges that represent the values you are charting
9. Background i. The value for a bar or dot or wedge, displayed near it on the chart
10. Titles j. The vertical or horizontal edge of the chart that is marked off in even lengths
11. Legend k. Identifies the data being charted on the horizontal x-axis. Examples of Category (X) Axis type
12. Axis title include weeks of special offer.
l. Identifies the data being charted on the vertical y-axis. Example of Value (Y) Axis type includes
number of people.
III. Identify the following chart type and its sub-type. (10 pts. each)
1 2 3 4 5 6