Back to Back S&L Plots
•
1 gefällt mir•1,451 views

Back to back Stem and Leaf Plots for Statistics Data.

Empfohlen
Weitere ähnliche Inhalte
Mehr von Passy World
Mehr von Passy World (20)
Kürzlich hochgeladen
Kürzlich hochgeladen (20)
Back to Back S&L Plots
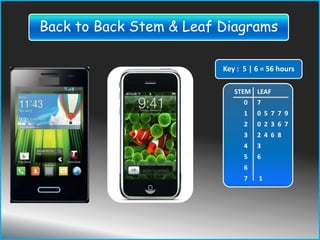
- 1. STEM LEAF 0 7 1 0 5 7 7 9 2 0 2 3 6 7 3 2 4 6 8 4 3 5 6 6 7 1 Key : 5 | 6 = 56 hours Back to Back Stem & Leaf Diagrams
- 2. STEM LEAF 0 4 5 5 7 1 0 4 5 5 7 2 0 2 3 6 7 3 2 4 6 4 5 6 6 7 5 Key : 5 | 6 = 56 hours Notice how the Bar Chart and the S&L Diagram have the same overall shape. Bar Chart and Stem & Leaf Diagram for Camera Battery Life Testing
- 3. Two Mobile Phones have been tested for Battery Life in between charges. We need to create a Back to Back Stem and Leaf Plot to show the comparison of the battery life results. It is assumed that people already know how to do basic Stem and Leaf Plots. The raw data is shown on the next slide Back to Back Stem & Leaf Diagrams
- 4. “Phone Brand A” – 7, 10, 15, 15, 17, 17, 19, 20, 22, 22, 26, 27, 30, 32, 34, 36, 38, 56, 75 (hours) “Phone Brand B” – 5, 7, 8, 8, 10, 11, 14, 17, 19, 21, 22, 22, 22, 30, 32, 34, 36, 38, 61 (hours) The next step is to group this data into ones, tens, twenties, thirties, … and so on. (See Next Slide). Battery Life Test Results
- 5. We will now draw an S&L Plot for “Brand A” Brand “A” 7 10, 15, 15, 17, 17, 19 20, 22, 22, 26, 27 30, 32, 34, 36, 38 56, 75 Battery Life Test Results Brand B” 5, 7, 8, 8 10, 11, 14, 17, 19 21, 22, 22, 22 30, 32, 34, 36, 38 61
- 6. STEM LEAF 0 7 1 0 5 5 7 7 9 2 0 2 2 6 7 3 0 2 4 6 8 4 5 6 6 7 5 Key : 5 | 6 = 56 hours Stem and Leaf Diagram to show “Brand A” battery life under various conditions Hours Actual Values 0-9 7 10-19 10, 15, 15, 15, 17, 19 20-29 20, 22, 22, 26, 27 30-39 30, 32, 34, 36, 38 40-49 50-59 56 60-69 70-79 75 Ones Tens Twenties Thirties Fourties Fifties Sixties Seventies
- 7. STEM LEAF 0 7 1 0 5 5 5 7 9 2 0 2 2 6 7 3 0 2 4 6 8 4 5 6 6 7 5 Key : 5 | 6 = 56 hours The Structure and Values for Brand A Stem and Leaf Diagram Battery Life Data Values 0-9 7 10-19 10, 15, 15, 15, 17,19 20-29 20, 22, 22, 26, 27 30-39 30, 32, 36, 38 40-49 50-59 56 60-69 70-79 75 Ones Tens Twenties Thirties Fourties Fifties Sixties Seventies In a Stem and Leaf Plot, the data values are put in order from the Lowest to Highest. We then group them into : Ones = 0 to 9 Tens = 10 to 19 and so on. These groups are called the “Stems”. The “Leaf” is the last digit on each of the original data values.
- 8. STEM LEAF 0 5 7 8 8 1 0 1 4 7 9 2 1 2 2 2 3 0 2 4 6 8 4 5 6 1 7 Key : 6 | 1 = 61 hours Stem and Leaf Diagram to show “Brand B” battery life under various conditions Hours Actual Values 0-9 5, 7, 8, 8 10-19 10, 11, 14, 17, 19 20-29 21, 22, 22, 22 30-39 30, 32, 34, 36, 38 40-49 50-59 60-69 1 70-79 Ones Tens Twenties Thirties Fourties Fifties Sixties Seventies
- 9. STEM LEAF 0 7 1 0 5 5 5 7 9 2 0 2 2 6 7 3 0 2 4 6 8 4 5 6 6 7 5 Brand A and B Stem & Leaf Plots STEM LEAF 0 5 7 8 8 1 0 1 4 7 9 2 1 2 2 2 3 0 2 4 6 8 4 5 6 1 7 We now make the “Back to Back” Stem and Leaf Diagram by flipping the Red Brand B Diagram around the other way, and merging it with the Blue Brand A Diagram so that they share the same stems down the middle.
- 10. Creating the Back to Back S&L Plot involves reversing our first S&L, like reversing a person. Making a BACK TO BACK Stem & Leaf Plot Images Source: Google Images
- 11. REVERSING the Brand B Leaf Plot STEM LEAF 0 5 7 8 8 1 0 1 4 7 9 2 1 2 2 2 3 0 2 4 6 8 4 5 6 1 7 To swap around the Brand B S&L Plot, we make the leaves go out to the left, instead of to the right. It is like reflecting our original in a mirror. LEAF STEM 8 8 7 5 0 9 7 4 1 0 1 2 2 2 1 2 8 6 4 2 0 3 4 5 1 6 7
- 12. STEM LEAF 0 7 1 0 5 5 5 7 9 2 0 2 2 6 7 3 0 2 4 6 8 4 5 6 6 7 5 Brand A and B Stem & Leaf Plots We now combine the reversed around red “Brand B” S&L Plot, with our blue “Brand A” S&L Plot, to make a single combined “Back to Back” S&L Plot as shown on next slide. LEAF STEM 8 8 7 5 0 9 7 4 1 0 1 2 2 2 1 2 8 6 4 2 0 3 4 5 1 6 7
- 13. “Brand B” LEAF STEM LEAF “Brand A” 8 8 7 5 0 7 9 7 4 1 0 1 0 5 5 5 7 9 Key: 6|1 = 2 2 2 1 2 0 2 2 6 7 61 hours 8 6 4 2 0 3 0 2 4 6 8 4 5 6 1 6 7 5 We made this “Back to Back” Stem and Leaf Diagram by flipping the Red Brand B Diagram around the other way, and merging it with the Blue Brand A Diagram, to that they now share the same set of stems down the middle. Making the BACK TO BACK Stem & Leaf Plot Conclusion: The Battery Life is about the same.
- 14. Phone Battery Comparison “Brand A” “Brand B” LEAF STEM LEAF 8 8 7 5 0 7 9 7 4 1 0 1 0 5 5 5 7 9 2 2 2 1 2 0 2 2 6 7 8 6 4 2 0 3 0 2 4 6 8 4 5 6 1 6 7 5 Key : 6 | 1 = 61 hours