1. THE JOURNAL OF FINANCE • VOL. LVI, NO. 1 • FEBRUARY 2001
Should Investors Avoid All Actively Managed
Mutual Funds? A Study in Bayesian
Performance Evaluation
KLAAS P. BAKS, ANDREW METRICK, and JESSICA WACHTER *
ABSTRACT
This paper analyzes mutual-fund performance from an investor’s perspective. We
study the portfolio-choice problem for a mean-variance investor choosing among a
risk-free asset, index funds, and actively managed mutual funds. To solve this
problem, we employ a Bayesian method of performance evaluation; a key innova-
tion in our approach is the development of a f lexible set of prior beliefs about
managerial skill. We then apply our methodology to a sample of 1,437 mutual
funds. We find that some extremely skeptical prior beliefs nevertheless lead to
economically significant allocations to active managers.
ACTIVELY MANAGED EQUITY MUTUAL FUNDS have trillions of dollars in assets,
collect tens of billions in management fees, and are the subject of enormous
attention from investors, the press, and researchers. For years, many ex-
perts have been saying that investors would be better off in low-cost pas-
sively managed index funds. Notwithstanding the recent growth in index
funds, active managers still control the vast majority of mutual-fund assets.
Are any of these active managers worth their added expenses? Should in-
vestors avoid all actively managed mutual funds?
Since Jensen ~1968!, most studies have found that the universe of mu-
tual funds does not outperform its benchmarks after expenses.1 This
evidence indicates that the average active mutual fund should be avoided.
On the other hand, recent studies have found that future abnormal re-
turns ~“alphas”! can be forecast using past returns or alphas,2 past fund
*
Baks and Metrick are from the Department of Finance, The Wharton School, University of
Pennsylvania. Wachter is from the Department of Finance, The Stern School, New York Univer-
sity. We thank Nick Barberis, Gary Chamberlain, Ken French, Will Goetzmann, Karsten Hansen,
˘
Chris Jones, Tom Knox, Tony Lancaster, Lubos Pástor, André Perold, Steve Ross, Andrei Shleifer,
˘
Rob Stambaugh, René Stulz, Sheridan Titman, an anonymous referee, and seminar participants
at Columbia, Wharton, the NBER, the 1999 NBER Summer Institute, and the 2000 AFA meetings
for helpful comments. Wachter thanks Lehman Brothers for financial support.
1
Recently, Carhart ~1995!, Malkiel ~1995!, and Daniel et al. ~1997! all find small or zero
average abnormal returns by using modern performance-evaluation methods on samples that
are relatively free of survivorship bias.
2
Carlson ~1970!, Lehman and Modest ~1987!, Grinblatt and Titman ~1988, 1992!, Hendricks,
Patel, and Zechhauser ~1993!, Goetzmann and Ibbotson ~1994!, Brown and Goetzmann ~1995!,
Elton, Gruber, and Blake ~1996!, and Carhart ~1997!.
45
2. 46 The Journal of Finance
inf lows,3 and manager characteristics such as age, education, and SAT scores.4
Given this evidence, it is possible that alphas are persistent, and that
some managers have positive expected alphas. Perhaps 0.1 percent of all
managers have positive expected alphas. Perhaps none do. Using current
data and methods, it is not possible to distinguish between these two pos-
sibilities. Nevertheless, such small differences may have large conse-
quences for investors.
In this paper, we explore these consequences by explicitly taking an in-
vestor’s perspective. We study the one-period portfolio allocation problem for
a mean-variance investor choosing from a riskless asset, benchmark assets
~passively managed index funds!, and nonbenchmark assets ~actively man-
aged mutual funds!. We propose and employ a Bayesian method of perfor-
mance evaluation; a key innovation in our approach is the development of a
f lexible set of prior beliefs about alphas that are consistent with intuition
about managerial skill. In this framework, the prior probability of manage-
rial skill can be made arbitrarily small ~or zero!, so investors can interpret
the results filtered through their own beliefs.
Our approach is similar to several recent papers that take an investment
perspective and use prior beliefs centered on an economic model ~Kandel and
Stambaugh ~1996!, Pástor and Stambaugh ~2000!, and Pástor ~2000!!. Like
the latter two papers, our techniques build upon the work of Pástor and
Stambaugh ~1999!; in particular, our definition of “skill” among managers
plays the same mathematical role as “model mispricing” does in their analysis.5
In Section I, we formally pose the investor’s problem and discuss the con-
ditions under which there is positive investment in an active manager. This
exercise shows that an investor who relies only on the data would choose to
invest in an active manager whenever the point estimate of alpha is greater
than zero. This result seems contrary to most investment advice about ac-
tive management and motivates the use of informed prior beliefs about the
frequency and magnitude of manager skill. We then posit a f lexible func-
tional form for these beliefs.
Once prior beliefs have been specified, the investor’s decision reduces to a
Bayesian inference problem, which we solve in Section II. Using prior beliefs
motivated in Section I, we derive an analytical solution for the posterior
expectation of alpha. Our solution is expressed as a formula whose inputs
are modified moments of well-known distributions. Although our focus is on
mutual-fund managers, this formula can also be applied to managers or port-
folio strategies in other contexts. It can be applied to a single manager in
3
Gruber ~1996! and Zheng ~1999!.
4
Golec ~1996! and Chevalier and Ellison ~1999!.
5
There is a related literature that employs Bayesian methods to explore the role of estima-
tion risk on portfolio choice. See Klein and Bawa ~1976!, Bawa, Brown, and Klein ~1979!, Brown
~1979!, Jobson, Korkie, and Ratti ~1979!, Jobson and Korkie ~1980!, Jorion ~1985, 1986, 1991!,
Frost and Savarino ~1986!, and Barberis ~2000!. In these applications, however, prior beliefs
about parameters are typically noninformative or come from empirical Bayes procedures. An-
other related line of research focuses on the role of prior beliefs in model testing. See Shanken
~1987!, McCullough and Rossi ~1990!, and Kandel, McCulloch, and Stambaugh ~1995!.
3. A Study in Bayesian Performance Evaluation 47
isolation and does not require a comprehensive or bias-free database. In
each context, the prior beliefs may be different, and rightly so. We also show
how prior beliefs can be elicited by intuitive questions such as “What is the
probability that a manager has an expected alpha greater than 25 basis
points?”, and we map the answers to these questions into the parameters of
the prior belief distribution.
Section III applies our methodology to an investor’s choice over a large set
of equity-mutual-fund managers. We use a sample of 1,437 domestic diver-
sified equity funds in existence at the end of 1996, and look at the full return
history for the managers in place at that time. Using the three-factor model
of Fama and French ~1993!, we calculate the posterior expectation of alpha
for each manager over a wide range of prior beliefs. We then ask, “What
prior beliefs would imply zero investment in active managers?” To justify
such a zero-investment strategy, we find that a mean-variance investor would
require extremely skeptical beliefs about the possibility of managerial skill.
We quantify the economic importance of these results by estimating the port-
folio share in active managers and the certainty-equivalent loss if this share
is set to zero. We then discuss how to reconcile the frequentist and Bayesian
evidence for this sample. Section IV concludes with an interpretation of our
results.
I. The Investor’s Problem and Prior Beliefs
Consider a mean-variance investor choosing from a risk-free asset, a set of
K benchmark assets ~passively managed index funds! and a single nonbench-
mark asset ~an active investment manager!. Under what conditions does the
investor place any of her portfolio in the active manager? In this section, we
derive the necessary condition for positive investment and find a counter-
intuitive outcome for an investor who relies only on the data. This motivates
a Bayesian performance-evaluation approach with the use of informed prior
beliefs about managerial skill. We then propose a f lexible and reasonable
form for these prior beliefs.
Let F and r denote the excess returns on the index funds and active man-
ager, respectively. Let w be the weight on the active manager, with its opti-
mal level written as w * . Next, define the “performance-evaluation equation”
for the active manager as
r ϭ a ϩ Fb ϩ «, ~1!
where « is normally distributed with mean zero and variance s 2 . In our
analysis, we treat a and b as fixed parameters that “belong” to a manager,
and not to the mutual fund that he manages. In principle, the assumption of
fixed parameters can be relaxed and they can be allowed to vary over time
and with the characteristics of the manager’s portfolio.
Under the assumptions used in this paper, one can adopt a Bayesian pro-
cedure for estimating a and solve for w * as proportional to the posterior
mean of a, where this ~positive! proportion would be a function of the inves-
4. 48 The Journal of Finance
tor’s risk aversion and the posterior variance of manager returns. Then, the
decision rule would be to invest in the active manager if and only if the
posterior mean of a is positive. In this case, the decision rule is reduced to
a Bayesian inference problem on a.
The implications of this simple decision rule are best illustrated through
two polar examples. At one extreme, if the investor has diffuse ~noninforma-
tive! prior beliefs for the parameters in equation ~1!, then posterior beliefs
would be completely determined by the data and the posterior mean of a
would be equal to its OLS estimate a. Thus, an investor with diffuse prior
[
beliefs would invest with the active manager as long as a[ is positive.
This result seems counterintuitive—shouldn’t managers need more than
just a positive point estimate before they merit an investment? Unease with
this result may be related to the assumption of diffuse prior beliefs for a. In
fact, some academics might tend towards the opposite extreme: a perfectly
informed, or “dogmatic,” belief in the impossibility of persistent managerial
skill. Dogmatic prior beliefs do not allow the data to play any role and imply
that investors should avoid all active managers, no matter how strong their
record might be. These two extreme cases—diffusion and dogma—are easy
to solve. The more interesting cases are in between, particularly when prior
beliefs are so close to dogmatic beliefs that they cannot be distinguished by
frequentist tests.
In this paper, we explicitly model the prior beliefs for a and solve the
investor’s problem. Figure 1 gives a graphical representation. For now, we
consider the case where the variance of « is known, so that the manager’s
level of residual risk is held constant.6 The prior separates managers into
two types: skilled ~with probability q! and unskilled ~with probability 1 Ϫ q!.
The key features of the distribution are the lower bound and point mass of
unskilled managers at a Ͻ 0, and the right tail of a normal distribution as
t
the functional form for a among skilled managers. The normal distribution
is chosen for analytic tractability. The parameters q and sa allow the inves-
tor great latitude in her beliefs about managerial skill. If she is very skep-
tical about the frequency and magnitude of skill, then she would set both
parameters to be small. In the limit, either q ϭ 0 or sa ϭ 0 implies a dog-
matic belief in the impossibility of skill.
The point mass in Figure 1 occurs at a ϭ a Ϫ fee Ϫ cost Ͻ 0. Here, we set
t
a so that E~a! ϭ Ϫfee Ϫ cost. This restriction forces the average a, before
fees and costs, to be zero. With these prior beliefs, all abnormal returns
earned by skilled managers must come at the expense of their unskilled
counterparts. Thus, an unskilled manager is expected to earn a negative a
that consists of three components: a, his losses due to transactions with
skilled managers, fee, his total fees, and cost, his transactions costs. While a
is the same for all managers, the other components, fee and cost, generally
differ across managers.
6
In Section II, we introduce a link between manager’s residual risk and the prior distribu-
tion for a.
5. A Study in Bayesian Performance Evaluation 49
Figure 1. Prior distribution of a. a is the intercept in a factor model ~see equation ~1!!. q is
the probability that a manager is skilled; conditional on skill, we have a ; N~ a, sa ! with a left
t 2
truncation at a, where a ϭ a Ϫ fee Ϫ cost is the expected abnormal return for an unskilled
t t
manager, a is the expected negative return from transactions with skilled managers, and fee
and cost are the manager’s fees and transactions costs, respectively. Note that this plot com-
bines a point mass at a ϭ a and a density for a Ͼ a.
t t
Why do we assume a lower bound at a? Under some interpretations of
t
equation ~1!, this assumption is logical. For example, if the market is semi-
strong efficient ~Fama ~1970!! with respect to equation ~1!, where the index
funds are interpreted as a complete set of risk factors, then no manager
should be expected to have an a below a. Although many managers have
t
return realizations that imply an a[ below a, one would need to be system-
t
atically trading on nonpublic “misinformation” to have an expected a below
a. If, instead, the market is not semistrong efficient and managerial skill is
t
based upon the use of public information to exploit decision-making biases,
then differential incidence of such biases would result in a some prior mass
below a.7 By imposing a lower bound at a, we are assuming that any behav-
t t
7
One way to model this possibility would be to make the prior distribution for a symmetric
around a. In fact, this assumption would greatly simplify our analysis. We do not use a sym-
t
metric distribution because we find such prior beliefs to be implausible. A symmetric prior
distribution for a would imply that for every skilled manager with superior judgment or the
ability to exploit the behavioral anomalies of other investors, there is another manager who
systematically does the opposite.
6. 50 The Journal of Finance
ioral biases are evenly distributed among all managers. Although this as-
sumption does affect inference for the worst-performing managers, it should
have little effect on posterior beliefs for the best-performing ones.
Once prior beliefs have been specified, the next step is to combine these
beliefs with data and compute a posterior estimate for a. We solve this Bayes-
ian inference problem in the next section.
II. Bayesian Performance Evaluation and Portfolio Choice
This section, along with Appendix A, provides the details of our method-
ology. In Section II.A, we provide the likelihood function for a general ~un-
conditional! factor representation of manager returns. Section II.B gives a
complete mathematical representation for prior beliefs, and Section II.C poses
four questions sufficient to elicit this representation. In Section II.D, we
combine these prior beliefs with the likelihood function and derive an ana-
lytical solution for the posterior expectation of a. Taken together, Sec-
tions II.A through II.D solve the inference problem for a single manager
studied in isolation. Section II.E extends the portfolio-choice analysis to mul-
tiple managers. Finally, Section II.F discusses the implications of survivor
bias for our analysis.
A. Likelihood
Let r denote a T ϫ 1 vector of excess returns for a manager and F a T ϫ K
matrix of factor returns. The regression disturbance « in equation ~1! is
assumed to be a serially uncorrelated, homoskedastic realization from a nor-
mal distribution, with zero mean and variance equal to s 2. Then, we write
the likelihood for r conditional on F as
p~r6a, b, s 2, F! ϭ N~ai T ϩ Fb, s 2 IT !, ~2!
where i T is a T-vector of ones, and IT is a T ϫ T identity matrix. Thus,
manager returns conditional on factor returns are normally distributed and
have a standard factor structure. We assume that the factors F do not de-
pend on a, b, or s, so the exact specification of the factor likelihood is not
necessary for our analysis in this section.
B. Prior Beliefs
The next step is to state the prior beliefs for the parameters in equation
~2!. As discussed in the previous section, managers are either skilled or un-
skilled. These two states of the world are indexed by the state variable Z,
with Z ϭ 1 denoting the skilled state and Z ϭ 0 denoting the unskilled state.
The probability of the skilled state is q. One can think of q as the probability
of drawing a skilled manager from the population of managers. We assume
7. A Study in Bayesian Performance Evaluation 51
that only a depends on whether or not the manager is skilled; the factor
loadings, b, and residual risk, s, do not. Under these assumptions, the prior
distribution can be written as
p~a, b, s 2 ! ϭ @ p~a6 Z ϭ 0! P~Z ϭ 0! ϩ p~a6 Z ϭ 1! p~Z ϭ 1!# p~ b, s 2 !. ~3!
We use a diffuse prior on b and s 2 ~Gelman et al. ~1995!!:
1
p~ b, s 2 ! @ . ~4!
s2
The diffuse prior on b is necessary to obtain analytical results. It is also a
reasonable starting point when analyzing managed portfolios, where b can
be estimated relatively precisely ~as compared to the b of individual stocks!.
The diffuse prior on s 2 is not necessary for analytical results, but it simpli-
fies notation and allows us to focus our attention on the role played by a.
Appendix A relaxes this second assumption and solves for the posterior when
s 2 has an informative prior; then, the diffuse prior used here becomes a
limiting case.
We turn next to a, the main parameter of interest. Essentially, we want to
write down a mathematical representation of Figure 1. The one additional
twist is to recognize that prior beliefs for a should be conditioned on some
level of residual risk. For example, consider a fully invested manager who
has an a of aj and is taking on s units of residual risk. Then, if this manager
were to take on a 50 percent cash position, his residual risk would decrease
to s02 and his a would fall to aj 02. The full specification of the prior for a
recognizes this relationship and is written as
P~Z ϭ 1! ϭ q, ~5!
P~Z ϭ 0! ϭ 1 Ϫ q, ~6!
p~a6 Z ϭ 0, s 2 ! ϭ da ,
t ~7!
ͩ ͫ ͬͪ
p~a6 Z ϭ 1, s 2 ! ϭ 2N a, sa
t 2
s2
s2
1aϾa ,
t ~8!
where dx is the Dirac delta function with mass point at x, 1X is the indicator
function for the set X, a is a negative constant representing the expected a
t
for an unskilled manager, and s 2 is an arbitrary constant specified by the
researcher before priors are elicited. Finally, we assume that the parameters
of the ~unspecified! factor prior are independent of a, b, and s.
8. 52 The Journal of Finance
The ratio s 20s 2 effectively links the posterior distributions of s and a. As
discussed above, this link allows us to adjust for the fact that a skilled man-
ager can control his expected a through the strategic use of leverage.8 The
importance of this relationship becomes clearer in the next section, when we
discuss the elicitation of priors.
The prior link between a and s is first suggested by MacKinlay ~1995! and
is implemented in Pástor and Stambaugh ~1999, 2000! and Pástor ~2000!. Math-
ematically, our link is identical to theirs, although their motivation is some-
what different. In these papers, sa is an index of potential “mispricing,” and
the motivation for the link is to reduce the ex-ante probability of very high Sharpe
ratios among portfolios that combine benchmark and nonbenchmark assets.
C. Elicitation of Prior Beliefs
It is possible to elicit prior beliefs using straightforward questions about
performance, fees, and transaction costs. For example, consider any specific
factor representation for equation ~1!. Then, given this factor representa-
tion, assume that the manager under study has a residual variance, s 2 ,
equal to a specific value. We call this level s 2 , and it serves as the constant
denominator term in equation ~8!. Then, conditional on s 2 ϭ s 2 and the
chosen factor representation, the researcher should answer the following
four questions:
• Question 1: What is the probability that the manager is skilled ~i.e.,
that he has an a greater than would be earned by randomly selecting
stocks while incurring the same fees and costs!? ~Call this answer q.!
• Question 2: What is the probability that the manager has an a greater
than 25 basis points? ~Call this answer q~25!.!
• Question 3: What are the expected fees for the manager? ~Call this an-
swer fee.!
• Question 4: What are the expected transaction costs for the manager?
~Call this answer cost.!
Note that all quantities are measured at the monthly frequency, so the
qualifier “per month” is assumed every time a quantity is measured in basis
points ~bp!. In answering these questions, the researcher should not con-
sider any return-based information about the manager that coincides with
the sample period under study. For example, this forces the exclusion of all
information about the length of time the manager has survived or the level
of assets that he has under management, both of which tend to be correlated
with past returns. Instead, the answers should ref lect a thought experiment
about a new manager before any return information has been observed.
8
The same argument can be used to motivate a link between b and s. Because we use a
diffuse prior for b, such a link is not applicable. To be completely consistent, we should also link
our prior beliefs for a ~and, by extension, a! to the ratio s 20s 2 . Unfortunately, this link is not
t
tractable, so we model a as a constant. As long as a is small, however, the restriction is not
quantitatively important.
9. A Study in Bayesian Performance Evaluation 53
Note that Question 2 is not asking about the probability of different real-
izations of a, but about “true” values of a. Realizations of a[ depend on sam-
[
pling variability. The true a, on the other hand, is the a[ we would observe as
the number of time periods goes to infinity. Thus, if a researcher believes
that no managers are skilled, then q ϭ 0, and thus q~25! should be zero as
well. The use of 25 bp in this question is arbitrary, and any other point in
the support of a could be substituted.
Question 2 is conditioned on a specific level of residual variance, s 2 . This
conditioning is crucial, and prior beliefs on a are not well-defined without it.
The same reasoning discussed in Section II.B also applies here: If a manager
has an expected a of aj when his residual standard deviation is s, then his
expected a would be aj 02 if he levered down his portfolio and took on only
s02 units of residual risk. By including the s 20s 2 term in the prior beliefs for
a, we link our beliefs for a and s in a way consistent with our elicitation
procedures. In this respect, the prior beliefs elicited through these questions
are not really about a, but are instead about Sharpe ratios for combinations
of the manager and the benchmarks.9 This returns us to the original moti-
vation for the link as given by MacKinlay ~1995!.
Given the answers to these questions, we can solve for the remaining pa-
rameters of the prior belief distribution. Let ⌽~x! denote the cdf of a stan-
dard normal distribution evaluated at x. Then, we have three equations:
q~25! ϭ P~a Ͼ 256s 2 ϭ s 2 ! ϭ 2q 1 Ϫ ⌽ ͩ ͩ 25 Ϫ a
sa
t
ͪͪ , ~9!
Ίp,
2
a ϭ Ϫqsa ~10!
and
a ϭ a Ϫ fee Ϫ cost,
t ~11!
which we can solve for the three unknowns, a, a, and sa . Equation ~9! re-
t
lates q~25! to sa ~given the other parameters!, equation ~10! imposes the
constraint10 that the expectation of a, conditional on s 2 ϭ s 2 , is equal to
~Ϫfee Ϫ cost!, and equation ~11! is just the definition of a. Table I illustrates
t
some solutions to this system: Given inputs of q, q~25!, fee, and cost, we
provide the solutions for sa , a, and a. In most of the examples in Table I, a
t
tends to be very small, so a is close to ~Ϫfee Ϫ cost!. Alternatively, one can
t
elicit q~25! before fees. To compute the prior parameters under this alter-
native method, we just set fee equal to zero on the right-hand-side of equa-
tion ~11!. This is the elicitation method used in Section III.
9
We are grateful to Rob Stambaugh for suggesting this interpretation.
10
In some applications, one may wish to relax the constraint in equation ~10! and allow
certain types of managers to have a positive expectation of a. This case is solved in a previous
version of the paper ~Baks, Metrick, and Wachter ~1999!!.
10. 54 The Journal of Finance
Table I
Elicitation of Prior Beliefs
This table illustrates the mapping from q~25!, q, fee, and cost into the parameters sa , a and a. t
q~25! is defined as P~a Ͼ 256s 2 ϭ s 2 !; q is the probability that a manager is skilled; conditional
on skill and s 2 ϭ s 2, we have a ; N~ a, sa ! with a left truncation at a, where a ϭ a Ϫ fee Ϫ cost
t 2
t t
is the expected abnormal return for an unskilled manager, a is the expected negative return
from transactions with skilled managers, and fee and cost are the manager’s fees and transac-
tion costs, respectively. sa , a, and a are expressed in basis points per month; q~25! and q are
t
expressed as probabilities.
q~25! q sa a a
t
Panel A: fee ϭ 8 bp per month and cost ϭ 6 bp per month
0.0001 0.001 23.72 Ϫ0.019 Ϫ14.02
0.01 15.19 Ϫ0.121 Ϫ14.12
0.1 12.15 Ϫ0.969 Ϫ14.97
0.001 0.01 23.83 Ϫ0.190 Ϫ14.19
0.1 15.62 Ϫ1.247 Ϫ15.25
0.01 0.1 24.92 Ϫ1.988 Ϫ15.99
Panel B: fee ϭ 8 bp per month and cost ϭ 9 bp per month
0.0001 0.001 25.55 Ϫ0.020 Ϫ17.02
0.01 16.36 Ϫ0.131 Ϫ17.13
0.1 13.08 Ϫ1.044 Ϫ18.04
0.001 0.01 25.66 Ϫ0.205 Ϫ17.20
0.1 16.83 Ϫ1.343 Ϫ18.34
0.01 0.1 26.84 Ϫ2.141 Ϫ19.14
D. Posterior Beliefs
Our goal in this section is to calculate the mean of the posterior distribu-
tion for a. Most of the intuition for this solution is contained in Figure 2 and
its corresponding notation as developed in equations ~12!–~20!. The details
are given beginning with equation ~21! and in Appendix A.
We denote the mean of the posterior distribution for a, E @a6 r, F # , as
a. Similarly, we denote the posterior probability that a manager is skilled,
I
P~Z ϭ 16r, F!, as q. Then, it follows that we can write a as
I I
a ϭ qE @a6 Z ϭ 1, r, F# ϩ ~1 Ϫ q! a.
I I I t ~12!
The first term on the right-hand-side of equation ~12! ref lects the contri-
bution to the posterior mean coming from the possibility that the manager
has skill; the posterior probability of skill ~ q! is multiplied by the posterior
I
expectation of a conditional on skill. The second term on the right-hand side
of equation ~12! ref lects the contribution coming from the possibility that
the manager is unskilled; the posterior probability of no skill ~1 Ϫ q! is multi-
I
plied by a.
t
11. A Study in Bayesian Performance Evaluation 55
Figure 2. Prior and posterior distribution of a. a is the intercept in a factor model ~see
equation ~1!!. q is the probability that a manager is skilled; conditional on skill and s 2 ϭ s 2, we
have a ; N~ a, sa ! with a left truncation at a, where a ϭ a Ϫ fee Ϫ cost is the expected abnormal
t 2
t t
return for an unskilled manager, a is the expected negative return from transactions with
skilled managers, and fee and cost are the manager’s fees and transactions costs, respectively.
Conditional on skill and s 2 ϭ s 2 , the posterior distribution of a is N~a ', s '2 ! with a left trun-
cation at a. q is the posterior probability that Z ϭ 1. a[ is the maximum likelihood estimate of
t I
a. Note that this plot combines a point mass at a ϭ a and a density for a Ͼ a.
t t
To calculate a, we need to solve for the two unknown elements on the
I
right-hand side of equation ~12!: E @a6 Z ϭ 1, r, F# and q. The problem of com-
I
puting a is thus considered in two parts. First, we calculate E @a6 Z ϭ 1, r, F# ,
I
I
the expectation conditional on skill. Second, we calculate q, the posterior
probability that the manager is skilled.
In expositing our solution, it is helpful to introduce some notation:
X [ ~ iT F !, ~13!
ͩͪa[
bZ
[ ~X ' X ! Ϫ1 X ' r, ~14!
m [ top left element of ~X ' X ! Ϫ1, ~15!
var~ a! [ ms 2.
[ ~16!
12. 56 The Journal of Finance
Then, the posterior of a conditional on the variance s and Z ϭ 1, which
we call the “skilled posterior distribution,” is given by a truncated normal
distribution: 11
p~a6 Z ϭ 1, r, F, s 2 ! @ N~a ', s '2 !1aϾa ,
t ~17!
where
a ' ϭ la[ ϩ ~1 Ϫ l! a,
t ~18!
ͩ ͪ
1 1 Ϫ1
s '2 ϭ ϩ , ~19!
var~ a!
[ s2
sa
2
s2
s '2
lϭ . ~20!
var~ a!
[
Equations ~17!–~20! are illustrated graphically in Figure 2. a ' is the mode
of the skilled posterior distribution given in equation ~17!; it would also be
the mean, and s '2 the variance, of the untruncated version of this distribu-
tion. a ' is written in equation ~18! as a weighted average of the maximum
likelihood estimate ~ a! and the prior mode ~ a!, with weights given by l and
[ t
1 Ϫ l, respectively. In equation ~19!, var~ a! represents the variance ~in a
[
frequentist sense! of the maximum likelihood estimate for a, conditional on
a known residual variance of s 2 . The posterior precision, 10s '2 , is the sum
of the precision of the prior and the precision of the data. Intuitively, this
says that after having observed the data, there is greater certainty about
the location of the posterior distribution of a than there was for the prior.
Thus, the weight l is determined in equation ~20! by the relative precision of
prior beliefs versus sample information. The greater the precision of a, the
[
more the mode is shifted towards a[ and away from the prior mode a. t
The marginal posterior for a ~conditional on skill! can be obtained in closed
form by successively integrating out b and s from the joint posterior. Once
b is integrated out, the model resembles one where normal data is combined
with a conjugate prior. Therefore, familiar techniques ~see, e.g., Gelman et al.
~1995!! can be used to integrate out s, suitably adjusted to ref lect the trun-
cation at a. The marginal distribution is then given by:
t
p~a6 Z ϭ 1, r, F! @ tn a ', ͩ lmh
n
ͪ 1aϾa ,
t ~21!
11
See Appendix A for the details of these calculations.
13. A Study in Bayesian Performance Evaluation 57
where
1Ϫl
hϭSϩ ~ a[ Ϫ a! 2,
t ~22!
m
uZ ϭ ͩͪ a[
bZ
, ~23!
S [ ~r Ϫ Xu!' ~r Ϫ Xu!,
Z Z ~24!
n ϭ T Ϫ K. ~25!
The parameter l has the same interpretation here as in equation ~20!; the
greater the precision of the data relative to the prior precision, the more the
posterior mode is shifted towards the maximum-likelihood estimate.
The posterior expectation of a in the skilled state can then be calculated as
E~a6 Z ϭ 1, r, F! ϭ a ' ϩ
lmh
ͩ
tnϪ2 a; a ',
t
lmh
ͪ 1
͵ ͩ ͪ
.
nϪ2 nϪ2 ` lmh
'
tn a; a , da
a
t n
~26!
The first term on the right-hand-side of equation ~26! is just the mode of the
skilled posterior distribution ~the mean of the untruncated t-distribution!,
and the second term is an adjustment for the truncation at a. We use the
t
notational convention that tn ~a; x, y! is a t-distribution evaluated at a with
mean x, variance y, and n degrees of freedom.
We next solve for the second unknown element in equation ~12!, q, the I
posterior probability that the manager is skilled. From Bayes’ formula for
binomial variables, it follows that
p~r6 Z ϭ 1, F! q
q [ P~Z ϭ 16r, F! ϭ
I . ~27!
p~r6 Z ϭ 1, F! q ϩ p~r6 Z ϭ 0, F!~1 Ϫ q!
Dividing through by p~r6 Z ϭ 1, F! yields
q
qϭ
I , ~28!
1Ϫq
qϩ
B
where B is given by
p~r6 Z ϭ 1, F!
B[ . ~29!
p~r6 Z ϭ 0, F!
14. 58 The Journal of Finance
If observing the realized data is equally likely whether the manager is skilled
or unskilled, then B ϭ 1, and the posterior probability of Z ϭ 1 equals the
prior probability: q ϭ q. The more likely the data are for a skilled manager
I
I
relative to an unskilled manager, the higher is B and thus, the higher is q.12
As shown in Appendix A,
ͩ mS
ͪ
ͩ͵ ͩ ͪ ͪ
tnϪ1 a; a,
t [
~1 Ϫ l!~n Ϫ 1! ` lmh
Bϭ tn a; a ', ~30!
ͩ ͪ
2 da .
S a
t n
tnϪ1 a; a,
t [ m
nϪ1
This is the ratio of two t-distributions, multiplied by a term to correct for the
truncation at a.t
Finally, with values for E~a6 Z ϭ 1, r, F! ~equation ~26!! and q ~equations ~28!
I
and ~30!!, we can substitute into equation ~12! and obtain a solution for a. I
E. Portfolio Choice over Multiple Managers
The previous analysis applies to an investor with a choice of one manager
and K index funds. In practice, investors can choose among many managers.
This section gives the assumptions that allow our framework to extend to
the case of multiple managers. This is necessary for the application in
Section III.
Consider a mean-variance investor choosing among the K index funds, N
manager portfolios, and a riskless asset. Let rj denote the T ϫ 1 vector of
returns on manager j, and let r denote the T ϫ N matrix of returns on all the
managers. As in Section II.A, the likelihood for returns is given by
p~rj 6aj , bj , sj2 , F! ϭ N~aj i T ϩ Fbj , sj2 IT !. ~31!
To shorten notation, let cj ϭ ~aj , bj , sj2 ! and ⌿ ϭ ~c1 , . . . , cN !. For each man-
ager, the prior on the parameters, p~cj !, is given in Section II.B.
The key condition that allows us to extend our result to multiple managers
is that “no manager conveys information on any other manager.” To obtain
this condition, we make two assumptions:
ASSUMPTION 1: The likelihoods are independent across managers:
p~r6⌿, F! ϭ ) p~rj 6⌿, F!
j
ϭ )
j
p~rj 6cj , F!. ~32!
12
Note that by dividing the numerator and denominator of equation ~28! by q, the posterior
odds ratio @~1 Ϫ q!0q#$@ p~r6 Z ϭ 0, F!#0@ p~r6 Z ϭ 1, F!#% for testing the hypothesis H0 : q ϭ 0 versus
H1 : q Ͼ 0 appears. Thus, B is a “Bayes factor” associated with testing H0 versus H1 .
15. A Study in Bayesian Performance Evaluation 59
Assumption 1 does not mean that raw manager returns are independent,
but rather that the factors capture all the dependencies. This is equivalent
to stating that the residuals in equation ~1! are independent across managers.
ASSUMPTION 2: The priors are independent across managers:
p~⌿! ϭ )
j
p~cj !. ~33!
For some applications, Assumptions 1 and 2 would be problematic. Here,
we feel that they are innocuous. Independence across managers would be a
dangerous assumption if we intend to make strong statements about the
total fraction of a portfolio invested in the full set of active managers. If we
restrict ourselves to statements about portfolio shares when managers are
considered one at a time, then inference about covariances is much less im-
portant. Of course, ignoring possible dependencies means that we lose some
information, but there is no reason to believe that losing this information
biases the results in either direction.
Assumptions 1 and 2 imply that the posterior distributions across man-
agers are independent:
p~⌿6r, F! @ p~r6⌿, F! p~⌿!
ϭ ) p~rj 6cj , F! p~cj !
j
@ )
j
p~cj 6rj , F!. ~34!
Therefore, the calculation for the posterior of aj when there are multiple
managers is identical to the solution derived in Section II.D for a single
manager. More to the point, the zero-investment condition for multiple man-
agers is analogous to the zero-investment condition for each manager.
An outline of the proof is given here; details can be found in Appendix C.
E F
Let E and V denote the expectation and variance–covariance matrix, re-
spectively, of the predictive return distributions for the N active managers
and the K index funds. Denote w and x as the vectors of weights, expressed
as a share of invested wealth, on the active managers and index funds, re-
spectively. Then, the weight on the risk-free asset is given by 1 Ϫ ( iϭ1 wi Ϫ
N
( jϭ1 x j .
K 13 Using these weights, we can calculate the mean and variance for
the next-period return on any portfolio consisting of managers and index
funds. We denote this mean and variance as E @R p # and Var @R p # , where
these expectations are taken with respect to the predictive return distribu-
tion of the managers and the factors.
13
If some of the index funds are zero-investment spread positions, then this equation would
be modified. See Appendix C for a discussion.
16. 60 The Journal of Finance
The investor’s problem is then to maximize over w and x
U ϭ E @R p # Ϫ Ϫ A Var @R p #
1
2 ~35!
where A ~Ͼ 0! is interpreted as the coefficient of relative risk aversion.
It is well known that the solution to this problem yields optimal weights
w * and x * given by
ͩ ͪw*
x*
ϭ
V Ϫ1 E
F
A
E
, ~36!
In Appendix C, it is shown that the vector of weights on the managers is
given by
⍀Ϫ1
w* ϭ a,
I ~37!
A
where ⍀ is a diagonal matrix with only positive elements. Thus, the investor
puts positive weight on a manager, if and only if the posterior expectation of
a is greater than zero.
F. Survivor Bias
A possible objection to our framework is that it fails to recognize the pos-
sibility of survivor bias. The investor sees only the fund managers that “sur-
vive,” that is, do not leave the sample. The question is, does this change the
inference problem for the managers that survive?
Survivor bias can impact the analysis in two ways. First, the fact that
poorly performing managers are not observed could, in principle, affect the
posterior distribution of a manager that is observed. Under the indepen-
dence assumptions of Section II.E, this first kind of survivor bias is not a
problem. Second, knowing that the manager in question has survived might
impact the posterior for that manager. This second type of survivor bias is
also not a problem, as this section demonstrates.
We represent survival for manager j by a binary random variable surviv-
al j . The question is whether
p~cj 6r, F! ϭ p~cj 6r, F, survival j !. ~38!
That is, does inference on cj change if conditioned on survival j ? The answer
to this question is “no,” under the following reasonable assumption on con-
ditions for survival:
ASSUMPTION 3: p~survival j 6r, F, cj ! ϭ p~survival j 6r, F!.
17. A Study in Bayesian Performance Evaluation 61
Assumption 3 states that survival depends only on realized returns. Con-
ditional on realized returns, the manager’s skill ~and the parameters bj and
sj ! do not affect the probability of survival. Realized returns are, of course,
observable, whereas cj is unknown. It is quite plausible that survival de-
pends on the manager’s observed returns, not on unobserved skill. In what
follows, we suppress the j subscript. The discussion easily extends to the
case of multiple managers, using the posterior independence shown in
Section II.E.
Using Assumptions 1–3, it follows that survivor bias is not a problem for
our analysis. In particular, by Bayes’ rule:
p~survival 6r, F, c! p~c6r, F!
p~c6r, F, survival ! ϭ ~39!
p~survival 6r, F!
ϭ p~c6r, F!. ~40!
The intuition behind this result is that the returns are already observed, so
there is no additional information in return-based survival. Note that, in
general,
p~r6F, c, survival ! p~r6F, c!. ~41!
That is, the likelihood conditional on survival is not the same as the likeli-
hood without conditioning on survival. The prior on c conditional on sur-
vival also differs from the unconditional prior; in particular, values of c that
increase the likelihood of survival would receive greater weight in the prior.
Equations ~39! and ~40! demonstrate that the effect on the prior and the
likelihood must exactly cancel, and thus the posterior remains the same.
It is helpful to contrast our setting to those where survivor bias would be
a problem.14 If, for example, we perform inference on the unconditional prob-
ability of skill in the population, P~Z ϭ 1!, then the disappearance of poorly
performing funds must affect the analysis. For this reason, we cannot pro-
vide guidance on the unconditional probability of skill for a population that
includes both survivors and nonsurvivors. Alternatively, if we are missing
data on a particular fund manager in years where that fund manager does
particularly poorly, this would also bias our conclusions. But this is not the
case in our sample.
III. Empirical Results
In this section, we apply our methodology and ask, “Given the evidence,
what prior beliefs would induce positive investment in at least one active
mutual-fund manager?” Section III.A discusses the data and performance-
evaluation regression. Section III.B summarizes the frequentist evidence for
14
For studies of the implications for survivor bias on inference, see Brown et al. ~1992!,
Brown, Goetzmann, and Ross ~1995!, and Goetzmann and Jorion ~1997!.
18. 62 The Journal of Finance
this sample. Section III.C contains the main analysis and answers the ques-
tion posed in the title of the paper. Section III.D calibrates the economic
significance of our findings by estimating the fraction of the portfolio allo-
cated to active managers and computing the certainty-equivalent loss if in-
vestment in active managers is set to zero. Section III.E discusses the
sensitivity of our analysis to alternative assumptions. Section III.F contrasts
the frequentist and Bayesian results.
A. Setup
Our data is drawn from the Center for Research in Security Prices ~CRSP!
mutual-fund database ~CRSP ~1999!!. This database includes information
collected from several sources and is designed to be a comprehensive sample
of all mutual funds from 1962 to 1996. We restrict ourselves to the subset of
domestic diversified equity funds still operating at the end of 1996, and only
include the monthly returns that have been earned by current ~as of Decem-
ber 1996! managers. We include only the returns earned by current manag-
ers because we interpret a as a fixed parameter that is a characteristic of
managers, not of funds. In the remainder of this section, we use the terms
“fund” and “manager” interchangeably. We include team-managed funds only
if a name is provided for at least one member of the team; returns for such
funds are included for the tenure of the team’s longest-standing member.
Furthermore, we restrict ourselves to funds with at least one complete year
of return history. The resulting sample includes 1,437 funds with an average
of 51 months of returns. This sample suffers from survivor bias and is not
representative of mutual-fund performance as a whole. As discussed in Sec-
tion II.F, the assumption that survival is based only on observed returns
allows us to ignore survivor issues in our Bayesian analysis.
The next step is to choose a set of benchmarks for the evaluation. For
conciseness, we restrict our presentation to a single well-known model—the
three-factor model of Fama and French ~1993!.15 The model is given by
rjt ϭ aj ϩ bj1 RMRFt ϩ bj 2 SMBt ϩ bj3 HML t ϩ «jt , ~42!
where rjt is the excess return to fund j in year t, aj is the performance
measure, and RMRFt , SMBt , and HML t are the time t returns to benchmark
portfolios constructed using market, size, and value strategies.16 Although
there is an ongoing debate about whether these factors are proxies for risk,
we take no position on this issue and simply view the three-factor model as
a method of performance attribution. Thus, we interpret the estimated al-
phas as abnormal returns in excess of what could have been achieved by a
15
The qualitative results do not change if we use the CAPM or the four-factor model of
Carhart ~1997!.
16
See Fama and French ~1993! for details on the construction of these portfolios. We are
grateful to Ken French for providing the factor returns.
19. A Study in Bayesian Performance Evaluation 63
matched investment in the benchmark portfolios. This model suits our pur-
poses, as we wish to determine whether a manager can outperform an avail-
able set of passive index funds, and the main style categories for both
indexation and active management are along size and value0growth dimen-
sions. Although the benchmark returns in equation ~42! are not themselves
available as passive index funds, they are very similar to ~combinations of !
index products available in the late 1990s.17 The fact that we ignore any
transactions costs that would be incurred in constructing these benchmark
portfolios is keeping with the conservative bias of our analysis; inclusion of
such transaction costs would make managers look better.
B. Frequentist Results
Before proceeding with the Bayesian performance evaluation, it is useful
to summarize the frequentist evidence for this sample. The estimation of
equation ~42! for all 1,437 managers yields 705 managers with a positive a[
and 732 with a negative a. Note that these estimates ref lect performance
[
after expenses, and thus show almost half of the managers succeeded in
earning back their fees and transactions costs. A big reason for this high
success rate is the survivor bias in the sample, and this bias prevents any
meaningful inference about sample averages.
Despite the limitations of survivor bias, it is interesting to test the null
hypothesis that the best performance in the sample is due to chance. To do
this, we first test the null hypothesis that a is zero for each manager in the
sample. On this test, the lowest p-value among all managers is achieved by
Robert Sanborn of the Oakmark Fund, who, with 64 months of returns, has
an a[ of 92.1 bp, and a standard deviation for this estimate of 24.0 bp. This
yields a t-statistic of 3.8 and a p-value of 0.00014. Thus, under the null
hypothesis that a is zero, we would expect to see such an extreme perfor-
mance about 1.4 times in a sample of 10,000 managers. Even if we assume
that our sample is randomly selected and consists of independent draws,
such an extreme result is not that surprising. Under the null hypothesis
that a is zero for all 1,437 funds, the probability of observing an a[ with a
p-value less than or equal to 0.00014 is
1 Ϫ ~1 Ϫ 0.00014!1,437 ϭ 0.18, ~43!
or 18 percent. If survivor bias causes the sample to have a disproportionate
number of good performers, then we would need to adjust upwards the ex-
ponent in equation ~43!, thus raising the probability of observing an extreme
17
Low-cost index funds are available in 1999 from the Vanguard mutual-fund family ~among
other places! in large-capitalization value, small-capitalization value, large-capitalization growth,
and small-capitalization growth categories. Note that low-cost “momentum” index funds are not
available, because momentum investing is, by nature, a high-turnover activity. This is the main
reason we do not include a momentum benchmark in our analysis.
20. 64 The Journal of Finance
outcome. In any case, we cannot reject the null hypothesis that the best
performer in this sample has an a equal to zero. At the end of this section,
we explain the relationship between this result and the Bayesian inference
described below.
C. Bayesian Results
In the Bayesian analysis, we combine the return evidence with a range of
possible prior beliefs and then map them into posterior beliefs. To simplify
the analysis, we elicit priors before fees so that we can use the same inter-
pretation of q, q~25!, and sa for all managers. In principle, we could use
different prior parameters for each manager depending on their style, edu-
cation, or other characteristics.18 Total fees are reported in the database and
vary across managers and across time. Consistent with our elicitation, we
analyze gross returns ~by adding back fees for each year!, and then subtract
the current fee at the end. Transactions costs are not reported in the data-
base; we use a single value, 6 bp, as the cost for every manager.19 In Sec-
tion III.E, we discuss the implications of changing this assumption.
For the denominator of the leverage term, given as s 2 in equation ~8!, we
use the cross-sectional mean of the frequentist maximum-likelihood esti-
mates of s 2 for all funds that have at least 24 monthly observations. This
empirical Bayes procedure yields s 2 ϭ 0.00029. This level of s 2 is a useful
normalization that makes it easier to interpret the results, because prior
beliefs can then be stated relative to an average level of residual risk in the
sample. Thus, the elicitation uses the questions from Section II.C., and in-
cludes an answer for q~25!; here, the proper interpretation of q~25! is the
probability of a greater than 25 bp, after transactions costs but before fees,
and conditional on the average level of residual risk in the sample. We use
this definition of q~25! for interpreting our results.
Given prior beliefs, the next step is to combine these beliefs with the data
and calculate posterior beliefs. As an example, consider the Guardian Park
Avenue fund ~Class A shares!. Charles Albers managed the fund from July
1972 through the end of our sample in December 1996 ~he subsequently left
to manage another fund!. Over this sample period, the fund earned an a[ of
24.1 bp. The standard error on this a estimate is 8.6 bp. If we perform a
frequentist test of the null hypothesis that a is zero, we obtain a p-value of
0.003.
How different are posterior beliefs when using an informed prior for a?
Combining Guardian’s 1996 monthly fees of 6.8 bp with our assumption that
monthly transactions costs are 6 bp, the prior mean for Guardian’s a is
18
Chevalier and Ellison ~1999! provide evidence that many such characteristics are corre-
lated with alphas.
19
This value roughly corresponds to the average monthly transactions costs for mutual funds
and large institutions found in other studies; see Carhart ~1997! for turnover rates and implied
trading costs, Keim and Madhavan ~1997! for per-trade costs, and Perold ~1988! for the meth-
odology behind these calculations.
21. A Study in Bayesian Performance Evaluation 65
Figure 3. Guardian Park Avenue Fund: a as a function of q(25) when q = 0.01. a is the
I
intercept in the Fama and French ~1993! three-factor model ~see equation ~42!!. a is the pos-
I
terior expectation of a. q is the probability that a manager is skilled; conditional on skill and
s 2 ϭ s 2, we have a ; N~ a, sa ! with a left truncation at a, where a is the expected abnormal
t 2
t t
return for an unskilled manager. q~25! [ P~a Ͼ 256s 2 ϭ s 2 !. The prior constant s 2 is 0.00029.
The sample period for Guardian Park Avenue is July 1972 to December 1996.
equal to Ϫ12.8 bp.20 ~All statements about prior expectations are made con-
ditional on s 2 ϭ s 2 ϭ 0.00029.! Informed prior beliefs tend to shrink a to-
I
wards its prior mean. For good performers, this shrinkage tends to be stronger
the smaller are q and q~25!. As an illustration, consider the case where q ϭ
0.01. Thus, the investor believes that one percent of all managers are ex-
pected to have some skill. Holding q constant at 0.01, Figure 3 plots Guard-
ian’s a as a function of the free parameter, q~25!. The higher is q~25!, the
I
more prior probability the investor is placing on a Ͼ 25 bp. Recall that a
adjusts for different levels of q~25!, so that the prior mean of a is always
equal to Ϫ12.8 bp. The figure covers the range q~25! ʦ @0,0.001# . For the
very smallest levels of q~25!, a is weighted heavily towards the prior mean
I
20
Guardian also had a maximum load fee of 450 bp in 1996. Many of the other top perform-
ing funds do not charge any load fees.
22. 66 The Journal of Finance
Figure 4. The highest (solid) and tenth highest (dashed) a over all managers when q =
I
0.01. This figure shows the highest and tenth highest a over all 1,437 managers for q~25! ʦ
I
@0,0.001# and q ϭ 0.01. a is the intercept in the Fama and French ~1993! three-factor model ~see
equation ~42!!. a is the posterior expectation of a. q~25! [ Pr~a Ͼ 256s 2 ϭ s 2 !. The plot shows
I
the highest and tenth highest value of a among all managers for each level of q~25!. The prior
I
constant s 2 is 0.00029.
and is negative. This negative range is very narrow, however, and a is pos-
I
itive for all values of q~25! greater than 0.00006. By the time we reach
q~25! ϭ 0.001, a is about 13 bp. Thus, if an investor believes that one man-
I
ager in a 100 has skill, and one in 1,000 has sufficient skill so that their a
is greater than 25 bp, then the posterior mean for Guardian would be 13 bp.
As impressive as Guardian’s performance is, it does not provide the high-
est a in the sample for this range of prior beliefs. In general, the best per-
I
forming managers at low levels of q~25! are those with a positive and
“significant” a[ and a long history of returns. Like Guardian, these managers
tend to have low frequentist standard errors for their a[ estimates, and large
updates for their probability of skill. Figure 4 plots the highest and tenth
highest a among all managers for q~25! ʦ @0,0.001# , holding q constant at
I
23. A Study in Bayesian Performance Evaluation 67
0.01.21 As seen in the figure, the best performing manager’s a becomes pos-
I
itive at about q~25! ϭ 0.00003, and the tenth best manager becomes positive
at about q~25! ϭ 0.00083. At q~25! ϭ 0.001, the best performing manager has
an a of 17 bp, and the tenth best performing manager has an a of 2 bp.
I I
In Figure 4, the use of a fixed q ϭ 0.01 is done only to provide an illus-
trative example. We could also draw this figure for any other level of q. In
every case, if q Ͼ 0.0002 and q~25! Ͼ 0.0001, there is at least one manager
with a Ͼ 0. Thus, as long as the investor believes that at least two in 10,000
I
managers has skill, and one in 10,000 managers has an a of at least 25 bp,
then she invests in at least one manager. In a frequentist test, such low
values of q and q ~25! would be statistically indistinguishable from
q ϭ q~25! ϭ 0, even in unbiased samples far larger than can currently be
constructed. In other words, even though we could not reject that the best
performance is due to chance ~in equation ~43!!, this test has very little
power against the alternative that q ϭ 0.0002 and q~25! ϭ 0.0001. Thus, we
conclude that zero investment in active managers cannot be justified solely
on the basis of the available statistical evidence.
D. Economic Significance
In the previous section, we showed that an investor with weak prior be-
liefs in the possibility of skill would still choose to invest some of her port-
folio in active managers. In this section, we calibrate the approximate size
and economic significance of the investor’s position in active managers. This
calibration follows the procedures introduced by Pástor and Stambaugh ~2000!.
In our analysis, we ignore load fees, taxes, margin requirements, and short
sale constraints on the index funds, so our results should be interpreted with
these caveats. Our intention is not to provide specific investment advice, but
rather to estimate the economic significance of our findings in a way that
can be compared with other studies.
We begin again with the investor’s problem as discussed in Section II.E.
To complete the problem, we specify the benchmark assets as the three fac-
tors used in equation ~42!: RMRF, HML, and SMB. Because each of the
factors is composed of both a long and a short position, investments in them
are all zero-cost spread positions. For simplicity, we assume that there are
no margin requirements, so that the investor can take positions of any size.
Weights on these factors are then expressed as a percentage of total invested
wealth. For example, optimal weights of 150 on each factor would corre-
spond to a spread position on each factor of $1.50 for each dollar of invested
21
Our focus on the “best” managers does not run into the statistical difficulties that would
occur in a frequentist analysis. Here, the assumptions discussed in Section II.E imply that
information about manager i does not tell us anything about manager j. Thus, conditioning on
the best or tenth-best manager does not affect inference about posterior means for those man-
agers. Effectively, our prior beliefs serve the same role as the exponent used in the calculation
of equation ~43!.
24. 68 The Journal of Finance
wealth.22 For the means and variances of the factor returns, we use the
predictive moments calculated from the monthly returns of July 1963 to
December 1996 ~See Appendix B for these procedures!. Following the same
normalization as Pástor and Stambaugh ~2000!, we set the risk-aversion
parameter so that an investor choosing only an optimal level of RMRF—with
the other factors set to zero—would choose to be “fully invested”; that is,
RMRF equal to 100 with an implied zero position in the risk-free asset. This
normalization is A ϭ 2.47 over our sample period.
To keep our analysis conservative, we restrict the investor to choosing no
more than one manager. With this constraint, our assumption of indepen-
dent manager returns ~Assumption 1! does not inf late the total weight placed
on active managers.23 The remainder of the analysis then exactly follows the
solution derived in Section II.E and Appendix C. For every set of prior be-
liefs, we begin by computing a for all 1,437 managers and finding the set of
I
managers that have a Ͼ 0. Then, for each manager in this set, we separately
I
compute the optimal weights in equation ~36! for a choice problem among
that manager, the risk-free asset, and the three factors. For example, if 10
managers have a Ͼ 0 for some level of prior beliefs, then we solve 10 dif-
I
ferent portfolio-choice problems, each time considering one manager along
with the other assets. We refer to the “optimal portfolio” as the maximum-
utility portfolio among all these solutions; we refer to the manager held in
this optimal portfolio as the “best manager.” This computation requires sim-
ulated draws from the predictive distributions; these procedures are dis-
cussed in Appendix B. Note that the best manager is not necessarily the
manager with the highest a from Figure 4, as the variance of portfolio re-
I
turns also affects the utility of the optimal portfolio.
The results are summarized in Figures 5 and 6. Figure 5 plots the opti-
mal weight on the top manager and the corresponding weight on RMRF for
the same prior parameters as used in Figures 3 and 4: q ϭ 0.01, q~25! ʦ
@0,0.001#. We interpret the optimal weight on RMRF as the residual weight
on a “market-index fund.” For very low levels of q~25!, there is no manager
in the optimal portfolio; this range corresponds exactly to the a Ͻ 0 range
I
from Figure 4. Over this range, the weight on RMRF is 161; that is, a
$1.61 spread position for each dollar of invested wealth. The weights on
HML and SMB, not shown in the figure, are 377 and 70, respectively. For
levels of q~25! Ͼ 0.00003, there is at least one manager with a Ͼ 0, and so
I
there is positive investment in the best manager. This weight rises, and
the weight on RMRF falls, with q~25!. At q~25! ϭ 0.0005, there is a weight
of 175 on the best manager and zero weight on RMRF. At this point, the
22
Because the factors are all zero-investment positions, the “residual” weight on the risk-
free asset is calculated as 100 minus the weight on the active manager. Because RMRF includes
a short position in the risk-free asset, the “actual” weight on the risk-free asset is the residual
weight minus the weight on RMRF.
23
Without this constraint, the investor would perceive investment in multiple managers as
a diversification of independent risks, and every manager with positive a would have positive
I
investment.
25. A Study in Bayesian Performance Evaluation 69
Figure 5. Weight on the best manager (solid) and the corresponding weight on RMRF
(dashed) when q = 0.01. This figure shows the weight ~expressed as a percentage of invested
wealth! in the best manager ~solid! and the corresponding weight on RMRF ~dashed! as a
function of q~25! for q~25! ʦ @0,0.001# and q ϭ 0.01. Weights are the solution to the portfolio-
choice problem in equation ~35!, where the assets are a single manager, the risk-free asset, and
the three factors from equation ~42!. For each level of q~25!, we solve equation ~35! separately
for each manager that has positive a. The “best manager” is the manager held in the portfolio
I
that yields the highest-utility solution to this problem. The investor’s coefficient of relative risk
aversion is set to A ϭ 2.47. a is the intercept and RMRF is the market factor in the Fama and
French ~1993! three-factor model ~see equation ~42!!. q is the probability that a manager is
skilled; conditional on skill and s 2 ϭ s 2, we have a ; N~ a, sa ! with a left truncation at a, where
t 2
t
a is the expected abnormal return for an unskilled manager. q~25! [ P~a Ͼ 256s 2 ϭ s 2 !. The
t
prior constant s 2 is 0.00029.
investor would only take on market risk through her investment in the
active manager—she would take no additional position in the broad mar-
ket index ~RMRF!. At q~25! ϭ 0.001, the weights on the best manager and
on RMRF would be 249 and Ϫ66 respectively.24
*
24
Figure 5 plots x RMRF , the optimal weight on RMRF and w * , the weight on the best man-
* *
ager. Note that the “actual” weight on RMRF would be x RMRF ϩ b1 w * : the optimal weight
shown in Figure 5 plus a component due to the factor loading of the best manager on RMRF.
This actual weight is constant at 161 for all values of q~25!.
26. 70 The Journal of Finance
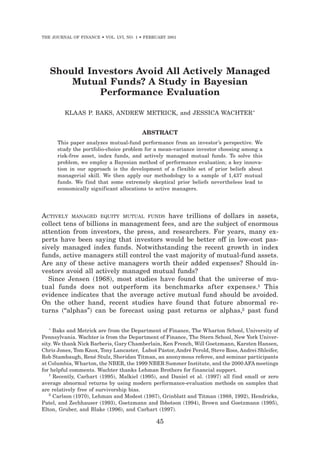
Figure 6. Certainty equivalent loss for a manager-restricted investor when q = 0.01.
This figure shows the certainty equivalent loss expressed in basis points per month when the
investor is precluded from investment in all managers. This loss is plotted as a function of q~25!
for q~25! ʦ @0,0.001# and q ϭ 0.01. The loss is defined as the difference in certainty equivalents
between the portfolio with the best manager ~as plotted in Figure 5! and a constrained-
optimum portfolio with all managers set to zero. The investor’s coefficient of relative risk aver-
sion is set to A ϭ 2.47. a is the intercept and RMRF is the market factor in the Fama and
French ~1993! three-factor model ~see equation ~42!!. q is the probability that a manager is
skilled; conditional on skill and s 2 ϭ s 2, we have a ; N~ a, sa ! with a left truncation at a, where
t 2
t
a is the expected abnormal return for an unskilled manager. q~25! [ P~a Ͼ 256s 2 ϭ s 2 !. The
t
prior constant s 2 is 0.00029.
Another way to calibrate the economic significance of these results is to
compute the certainty equivalent ~CE! loss to an investor if she is precluded
from any investment in active managers. To do this, we calculate the differ-
ence between the CE return for the optimal portfolio used for Figure 5 and
the CE return for a “manager-restricted” investor who is allowed to take
positions in the factors but not in any manager. This difference is plotted in
Figure 6. For the zero-investment range of q~25!, the manager-restricted
investor has no CE loss. At q~25! ϭ 0.0005, a manager-restricted investor
would suffer a CE loss of about 8 bp per month. At q~25! ϭ 0.001, the CE loss
rises to 16 bp per month. As a comparison, we calculate the CE loss if the
27. A Study in Bayesian Performance Evaluation 71
investor is also restricted from investments in HML and SMB. The loss from
this additional restriction would be approximately 104 bp per month. Thus,
although the returns to investing in the best manager seem economically
significant, they are still much lower than the returns to investing in the
size and value factors.
E. Sensitivity of Analysis to Modeling Assumptions
Our analysis assumes that cost is known and equal to 6 bp for all man-
agers. How sensitive are our results to this assumption? Suppose for exam-
ple, that we use 9 bp as our baseline level. Then, for any given level of q and
q~25!, a shifts to the left, but sa increases ~in order to maintain the same
t
probability that a is greater than 25 bp!. This effect can be seen by compar-
ing the third column of Panels A and B in Table I. For the best performing
funds, the second effect tends to dominate and a becomes higher over most
I
of the range of Figure 4. In fact, the most conservative possible results for
the best performing funds occur if we assume cost is zero. Even in this un-
realistic case, however, the results are qualitatively similar to the 6-bp case.
If cost is uncertain, then we cannot obtain analytical solutions, but our in-
tuition is that these effects would be second order compared to shifting the
baseline level. For example, uncertainty around 6 bp should not have a larger
effect than the most conservative possible shift to 0 bp. Different assump-
tions about cost would, however, affect inference about poorly performing
funds, but this is not the main subject of our analysis.
One possible criticism of our results is that they are driven by the restric-
tions of our parametric structure. In particular, one might believe that returns
have fatter tails than do a normal distribution, and that the best-performing
managers would not look as good if we took this into account. Although we
cannot obtain analytical solutions using a fatter-tailed likelihood, we can
analyze a related question: Could the results of Section III be driven by
incorrectly applying our methods to fat-tailed data? To answer this question,
we simulate 10 years of returns for 1,000 funds under three possible distri-
butions for returns: normal, t-distributed with 10 degrees of freedom, and
t-distributed with 3 degrees of freedom. In each case, we set q ϭ 0, so that
no fund has any skill. We then replicate Figure 4 for these data. The results
show very little difference across the three return distributions.25
The results of this section are based on a specific performance-evaluation
model, but other popular models lead to the same qualitative conclusions.26
A more serious concern is our reliance on a factor model with fixed param-
eters. It is well known that successful timing ability, as manifested by changes
in betas in response to informed forecasts of factor returns, induces bias in
25
Details of these simulations are available from the authors. Although the results are not
directly comparable to those of the actual data set, it is interesting to note that for q ϭ 0.01 ~as
in Figure 4! no simulated manager has a positive a for any q~25! Ͻ 0.0003.
I
26
Results for the CAPM and the four-factor model ~Carhart ~1997!! are available from the
authors.
28. 72 The Journal of Finance
the estimation of alphas. To deal with this concern, the methods developed
here could be extended to conditional factor models. Our procedures also
assume that alphas are constant over a manager’s career. One could argue
that as markets grow more competitive, we should expect alphas to shrink
for skilled managers. Also, as managers age and0or their portfolios grow,
they may have different abilities, incentives, and opportunities, and their
“true” alpha may change. Such possibilities add more dimensions to the space
of prior beliefs, but we doubt that the main conclusions would change: The
prior beliefs necessary to support investment in active managers are virtu-
ally indistinguishable from either “no skill” or “no persistence of skill.”
F. Comparison of Frequentist and Bayesian Results
In Section III.C, we implement a Bayesian approach and find positive
investment for all but the most skeptical prior beliefs. For this same sample,
we show ~Section III.B! that the best performance does not seem too extreme
for the sample size. How can we reconcile the Bayesian and frequentist results?
In frequentist language, one can begin to reconcile the results by recog-
nizing that the “null hypothesis” is different in the two analyses. In the
frequentist test of equation ~43!, the null hypothesis is that a is zero for all
managers. In the Bayesian analysis, the effective null hypothesis of no skill
occurs at a negative level of a; for some managers, this level may be two
standard deviations to the left of zero. In the Bayesian analysis, degrees of
“rejection” of the null lead us to update the posterior probability of skill, and
these rejections may be much stronger than if the null were at zero.
Another consideration in reconciling the frequentist and Bayesian results
is the recognition that “insignificant” evidence may have large investment
implications. This point is first made, in another context, by Kandel and
Stambaugh ~1996!. The downside of choosing an active manager is that he
may be unskilled. In expectation, the investor then pays the expenses for
nothing. This expected downside is limited. The upside of skilled manage-
ment is potentially much larger. Even if the best performers in the sample
are not significantly extreme to reject a null hypothesis, they may still be
sufficiently extreme to justify their expenses.
IV. Conclusion
Should investors avoid all actively managed mutual funds? A natural fre-
quentist approach to this question is in three steps: ~step 1! My null hypoth-
esis is that no manager has skill; ~step 2! The data do not reject this null
hypothesis; ~step 3! I will not invest in active managers. Although this may
seem like a reasonable approach, it does not have a sound decision-theoretic
justification; the evidence necessary to reject the null hypothesis in step 2 is
different from the evidence necessary to justify investment in active man-
agers. Hence, step 2 does not imply step 3. Current data and methods have
insufficient power to distinguish between the null hypothesis in step 2 and
29. A Study in Bayesian Performance Evaluation 73
close alternatives. The main contribution of our paper is to show that some
of these close alternatives imply economically large investment in active man-
agers. Thus, we conclude that the case against investing in actively man-
aged funds cannot rest solely on the available statistical evidence.
Our analysis does not include elements of the investor’s decision such as
load fees, taxes, and limitations on short sales. Furthermore, nobody knows
the correct model of performance evaluation. Given these limitations, we
do not claim to provide a definitive analysis of the portfolio-choice deci-
sion. Most investors may be best served by simple rules of thumb, espe-
cially if they do not possess the discipline or technology to implement
sophisticated trading strategies. Nevertheless, we believe that the inves-
tor’s perspective motivates the importance of using informed prior beliefs
in a Bayesian method of performance evaluation. This method provides a
new lens on the performance-evaluation evidence, with the final image in
sharp contrast to frequentist-based intuition.
Appendix A. Posterior Distribution and Expectation of a
Throughout Appendix A, we assume an informative prior on s 2 , and, as in
the text, a diffuse ~improper! prior on b:
p~ b! @ 1, ~A1!
p~s 2 ! @
s
1
n0ϩ2 ͭ
exp Ϫ
h0
2s 2
ͮ . ~A2!
Results in the text can be obtained by substituting n0 ϭ 0 and h 0 ϭ 0 into the
expressions below. Otherwise, the setup is the same as in Section II, and we
make use of the same notation.
The likelihood for factors, unspecified in the text, is assumed to take the
following form:
p~Ft 6m F , ⌺ F ! ϭ N~ m F , ⌺ F !, ~A3!
with realizations independent across t. The prior on m F and ⌺ F is assumed
to be diffuse:
p~ m F , ⌺ F ! @ 6⌺ F 6Ϫ~Kϩ1!02. ~A4!
A.1. Posterior Distribution of a
From Bayes’ rule, the joint posterior for ~u, s 2, m F , ⌺ F ! is given by
p~u, s 2, m F , ⌺ F 6r, F! @ p~r6u, s 2, F! p~F6m F , ⌺ F ! p~u, s 2 ! p~ m F , ⌺ F !
@ p~u, s 2 6r, F! p~ m F , ⌺ F 6F!, ~A5!
30. 74 The Journal of Finance
where we use the prior independence of ~u, s 2 ! and ~ m F , ⌺ F !, and the fact
that the likelihood for r conditional on factors depends only on u and s 2 ,
whereas the likelihood for the factors depends only on ~ m F , ⌺ F !. Therefore,
~u, s 2 !, and ~ m F , ⌺ F ! are independent in the posterior.
The above arguments imply
p~u, s 2 6r, F! @ p~r6u, s 2, F! p~u, s 2 !. ~A6!
Because Z is independent from ~ m F , ⌺ F ! in the prior, and because the like-
lihood for factors does not depend on Z, the equations above are also valid
conditional on a value of Z. We make use of equation ~A6! throughout this
appendix.
The likelihood for r conditional on factors is given by
p~r6u, s 2, F! @
1
sT
exp Ϫͭ 1
2s 2
~r Ϫ Xu!' ~r Ϫ Xu! ͮ
@
s
1
T
exp Ϫͭ 1
2s 2
~S ϩ ~u Ϫ u!' X ' X~u Ϫ u!! ,
Z Z ͮ ~A7!
where S, u, u, and X are defined as in Section II.D.
Z
Combining the likelihood and the prior yields
p~u, s 2 6 Z ϭ 1, r, F!
1 1
@ n0ϩTϩ2
s s
ϫ exp Ϫ ͭ ͩ 2s 2
1
h0 ϩ S ϩ
s2
sa
2
~a Ϫ a! 2 ϩ ~u Ϫ u!' X ' X~u Ϫ u!
t Z Z ͪͮ 1aϾa .
t
~A8!
Integrating with respect to b yields
1 1
p~a, s 2 6 Z ϭ 1, r, F! @ n0ϩTϪKϩ2
s s
ϫ exp Ϫ ͭ ͩ 2s 2
1
h0 ϩ S ϩ
s2
sa
2
~a Ϫ a! 2 ϩ
t
~a Ϫ a! 2
m
[
ͪͮ 1aϾa .
t
~A9!
Completing the square in a yields
p~a, s 2 6 Z ϭ 1, r, F! @
1
s nϩ2 s
1
exp Ϫ ͭ 1
2s 2
ͩ
hϩ
~a Ϫ a ' ! 2
lm
ͪͮ 1aϾa ,
t ~A10!
31. A Study in Bayesian Performance Evaluation 75
where
h ϭ h0 ϩ S ϩ ͩ ͪ 1Ϫl
m
~ a[ Ϫ a! 2,
t
n ϭ n0 ϩ T Ϫ K. ~A11!
Conditional on s 2 , all terms involving s 2 ~as well as all terms involving only
the data, such as a[ and S! can be considered constants. Therefore,
p~a6s 2, Z ϭ 1, r, F! @ exp Ϫ ͭ 1
2s '2
ͮ
~a Ϫ a ' ! 2 1aϾa ,
t ~A12!
and we have shown equation ~17!.
In spite of the truncation, the functional form of the posterior is that of a
conjugate prior distribution. Therefore, s 2 can be integrated out of equation
~A10! using the properties of the gamma distribution ~see, e.g., Gelman et al.
~1995!!. Define a change of variables u ϭ 1 Ds Ϫ2 , where D ϭ h ϩ ~lm! Ϫ1 ~a Ϫ
_
2
' 2
a ! . The resulting function of u is the pdf of a gamma distribution without
the normalizing constant:
p~a6 Z ϭ 1, r, F! @ ͩͪ D
2
Ϫ~nϩ1!02
ͩ͵ u ~nϪ1!02 exp $Ϫu% du 1aϾa .
t ͪ ~A13!
Using the proportionality constant for the gamma distribution, and dividing
through by h yields
p~a6 Z ϭ 1, r, F! @ ͩͪ
h
2
Ϫ~nϩ1!02
⌫ ͩ ͪͩnϩ1
2
1ϩ
~a Ϫ a ' ! 2
lmh
ͪ
Ϫ~nϩ1!02
1aϾa ,
t
~A14!
which is proportional to the pdf of a t-distribution. Therefore,
p~a6 Z ϭ 1, r, F! @ tn a ', ͩ lmh
n
ͪ 1aϾa .
t ~A15!
A.2. Posterior Expectation of a Conditional on Skill
Because p~a6 Z ϭ 1, r, F! must integrate to one,
p~a6 Z ϭ 1, r, F! ϭ
1
ͩ
tn a; a ',
lmh
ͪ ~A16!
͵ ͩ ͪ
1aϾa .
t
` lmh n
'
tn a; a , da
a
t n