SlideShare ist ein Scribd-Unternehmen logo
1 von 23
Downloaden Sie, um offline zu lesen
Extending human perception
with
Data visualisation
This is taken from a talk on Big Data.
About visual tools and techniques for communicating data.
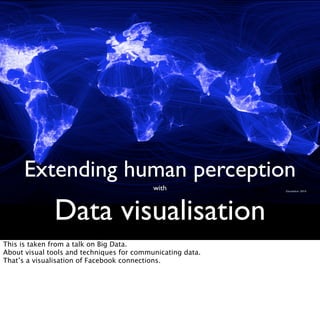
That’s a visualisation of Facebook connections.
Visualisations of big data are often beautiful but useless.
This is art, not insight.
Communicating insights are not just about pretty graphics, that’s just design porn.
“Visualization allows people to
offload cognition to the
perceptual system, using
carefully designed images as a
form of external memory.”
Tamara Munzner
Department of Computer Science
University of British Columbia
Visualisation extends perception & memory.
http://www.cs.ubc.ca/labs/imager/tr/2009/VisChapter/akp-vischapter.pdf
A visualisation turns something you want to find into something you can see.
0"
5"
10"
15"
20"
25"
30"
35"
40"
45"
50"
6/01/08"
6/03/08"
6/05/08"
6/07/08"
6/09/08"
6/11/08"
6/01/09"
6/03/09"
6/05/09"
6/07/09"
6/09/09"
6/11/09"
6/01/10"
6/03/10"
6/05/10"
6/07/10"
6/09/10"
6/11/10"
6/01/11"
6/03/11"
6/05/11"
6/07/11"
6/09/11"
6/11/11"
6/01/12"
6/03/12"
6/05/12"
6/07/12"
6/09/12"
6/11/12"
Late%&mesheets%
A visualisation turns something you want to find into something you can see.
How do we extend
the human ability to
perceive data?
We make it possible for our eyes to see trends and identify differences.
Work with human perception: Senses, memory, cognition.
This can be done by using a variety of “visual search” techniques to make data “Pop out”.
Colour, size, orientation, shape, grouping, motion,
This can be done by using a variety of “visual search” techniques to make data “Pop out”.
Colour, size, orientation, shape, grouping, motion,
This can be done by using a variety of “visual search” techniques to make data “Pop out”.
Colour, size, orientation, shape, grouping, motion,
This can be done by using a variety of “visual search” techniques to make data “Pop out”.
Colour, size, orientation, shape, grouping, motion,
This can be done by using a variety of “visual search” techniques to make data “Pop out”.
Colour, size, orientation, shape, grouping, motion,
This can be done by using a variety of “visual search” techniques to make data “Pop out”.
Colour, size, orientation, shape, grouping, motion,
This can be done by using a variety of “visual search” techniques to make data “Pop out”.
Colour, size, orientation, shape, grouping, motion,
Don’t show it all at once.
Filter, Animate, Summarise,
Don’t show it all at once.
Filter, Animate, Summarise,
Don’t show it all at once.
Filter, Animate, Summarise,
x 133
Don’t show it all at once.
Filter, Animate, Summarise,
Look at
me!
Annotate and label – help people not get lost.
Text
Clusters
Outliers
Correlations
Patterns to look for: Clusters, outliers, extents, correlations.
http://www.google.com/publicdata/explore?
ds=d5bncppjof8f9_&ctype=b&strail=false&nselm=s&met_x=sp_dyn_le00_in&scale_x=lin&ind_x=false&met_y=sp_dyn_tfrt_in&sc
ale_y=lin&ind_y=false&met_s=sp_pop_totl&scale_s=lin&ind_s=false&dimp_c=country:region&ifdim=country&hl=en&dl=en&icon
Size=0.5&uniSize=0.035#!
ctype=b&strail=false&bcs=d&nselm=s&met_x=sp_dyn_le00_in&scale_x=lin&ind_x=false&met_y=sp_dyn_tfrt_in&scale_y=lin&ind
_y=false&met_s=sp_pop_totl&scale_s=lin&ind_s=false&dimp_c=country:region&ifdim=country&pit=-153914400000&hl=en_US
&dl=en&ind=false
Look at
me!
Look at
me!
Look at
me!
Minimum necessary difference.
Reduce visual noise.
Tufte: What is the minimum number of pixels required to highlight the difference between
data.
Look at
me!
Look at
me!
Look at
me!
Minimum necessary difference.
Reduce visual noise.
Tufte: What is the minimum number of pixels required to highlight the difference between
data.
You are here
You can’t look at big data sets all at once, you can look at 2 parts of it at once to try to make
sense of them together in your mind.
Interface extends perception, allowing us to understand what it is telling us.
Total Perspective Vortex - Zaphod Bebblebrox

Weitere ähnliche Inhalte

Ähnlich wie Extending human perception with data visualisation

Infographics for the social sector webinar
Infographics for the social sector webinarInfographics for the social sector webinar
Infographics for the social sector webinarStephen MacKley
 
Introduction to Data Visualisation
Introduction to Data VisualisationIntroduction to Data Visualisation
Introduction to Data VisualisationShiralee Saul
 
Introduction to Information Visualization (Part 2)
Introduction to Information Visualization (Part 2)Introduction to Information Visualization (Part 2)
Introduction to Information Visualization (Part 2)Andrew Vande Moere
 
Everything you ever wanted to know about Google Analytics, but were afraid to...
Everything you ever wanted to know about Google Analytics, but were afraid to...Everything you ever wanted to know about Google Analytics, but were afraid to...
Everything you ever wanted to know about Google Analytics, but were afraid to...SoCal UX Camp
 
Frontiers of Computational Journalism week 8 - Visualization and Network Anal...
Frontiers of Computational Journalism week 8 - Visualization and Network Anal...Frontiers of Computational Journalism week 8 - Visualization and Network Anal...
Frontiers of Computational Journalism week 8 - Visualization and Network Anal...Jonathan Stray
 
The Visual Data Discovery Tool
The Visual Data Discovery ToolThe Visual Data Discovery Tool
The Visual Data Discovery ToolLisa Brown
 
Interaction design
Interaction designInteraction design
Interaction designmarkguy
 
Posters @ Mercy
Posters @ MercyPosters @ Mercy
Posters @ Mercyhcollazo1
 
A Pixar Twist on Presenting Data
A Pixar Twist on Presenting DataA Pixar Twist on Presenting Data
A Pixar Twist on Presenting DataAmanda Makulec
 
Introduction to Data Visualization
Introduction to Data Visualization Introduction to Data Visualization
Introduction to Data Visualization Ana Jofre
 
Denis Boudreau - 2017 Design Trends
Denis Boudreau - 2017 Design TrendsDenis Boudreau - 2017 Design Trends
Denis Boudreau - 2017 Design TrendsWeb à Québec
 
The Architecture of Understanding (Peter Morville at Enterprise UX 2015)
The Architecture of Understanding (Peter Morville at Enterprise UX 2015)The Architecture of Understanding (Peter Morville at Enterprise UX 2015)
The Architecture of Understanding (Peter Morville at Enterprise UX 2015)Rosenfeld Media
 
The Architecture of Understanding
The Architecture of UnderstandingThe Architecture of Understanding
The Architecture of UnderstandingPeter Morville
 
Why do we need to understand data visualisations There are more .docx
Why do we need to understand data visualisations There are more .docxWhy do we need to understand data visualisations There are more .docx
Why do we need to understand data visualisations There are more .docxgauthierleppington
 
Why do we need to understand data visualisations There is more and
Why do we need to understand data visualisations There is more andWhy do we need to understand data visualisations There is more and
Why do we need to understand data visualisations There is more andjonghollingberry
 
Why do we need to understand data visualisations There is more and.docx
Why do we need to understand data visualisations There is more and.docxWhy do we need to understand data visualisations There is more and.docx
Why do we need to understand data visualisations There is more and.docxgauthierleppington
 
Why do we need to understand data visualisations There is more and .docx
Why do we need to understand data visualisations There is more and .docxWhy do we need to understand data visualisations There is more and .docx
Why do we need to understand data visualisations There is more and .docxgauthierleppington
 
Multivariate Data Visualization
Multivariate Data VisualizationMultivariate Data Visualization
Multivariate Data Visualizationanilash
 

Ähnlich wie Extending human perception with data visualisation (20)

Infographics for the social sector webinar
Infographics for the social sector webinarInfographics for the social sector webinar
Infographics for the social sector webinar
 
Introduction to Data Visualisation
Introduction to Data VisualisationIntroduction to Data Visualisation
Introduction to Data Visualisation
 
Introduction to Information Visualization (Part 2)
Introduction to Information Visualization (Part 2)Introduction to Information Visualization (Part 2)
Introduction to Information Visualization (Part 2)
 
Everything you ever wanted to know about Google Analytics, but were afraid to...
Everything you ever wanted to know about Google Analytics, but were afraid to...Everything you ever wanted to know about Google Analytics, but were afraid to...
Everything you ever wanted to know about Google Analytics, but were afraid to...
 
Frontiers of Computational Journalism week 8 - Visualization and Network Anal...
Frontiers of Computational Journalism week 8 - Visualization and Network Anal...Frontiers of Computational Journalism week 8 - Visualization and Network Anal...
Frontiers of Computational Journalism week 8 - Visualization and Network Anal...
 
Visual Thinking
Visual ThinkingVisual Thinking
Visual Thinking
 
The Visual Data Discovery Tool
The Visual Data Discovery ToolThe Visual Data Discovery Tool
The Visual Data Discovery Tool
 
Interaction design
Interaction designInteraction design
Interaction design
 
Posters @ Mercy
Posters @ MercyPosters @ Mercy
Posters @ Mercy
 
A Pixar Twist on Presenting Data
A Pixar Twist on Presenting DataA Pixar Twist on Presenting Data
A Pixar Twist on Presenting Data
 
Introduction to Data Visualization
Introduction to Data Visualization Introduction to Data Visualization
Introduction to Data Visualization
 
Denis Boudreau - 2017 Design Trends
Denis Boudreau - 2017 Design TrendsDenis Boudreau - 2017 Design Trends
Denis Boudreau - 2017 Design Trends
 
The Architecture of Understanding (Peter Morville at Enterprise UX 2015)
The Architecture of Understanding (Peter Morville at Enterprise UX 2015)The Architecture of Understanding (Peter Morville at Enterprise UX 2015)
The Architecture of Understanding (Peter Morville at Enterprise UX 2015)
 
The Architecture of Understanding
The Architecture of UnderstandingThe Architecture of Understanding
The Architecture of Understanding
 
Why do we need to understand data visualisations There are more .docx
Why do we need to understand data visualisations There are more .docxWhy do we need to understand data visualisations There are more .docx
Why do we need to understand data visualisations There are more .docx
 
Class 5
Class 5Class 5
Class 5
 
Why do we need to understand data visualisations There is more and
Why do we need to understand data visualisations There is more andWhy do we need to understand data visualisations There is more and
Why do we need to understand data visualisations There is more and
 
Why do we need to understand data visualisations There is more and.docx
Why do we need to understand data visualisations There is more and.docxWhy do we need to understand data visualisations There is more and.docx
Why do we need to understand data visualisations There is more and.docx
 
Why do we need to understand data visualisations There is more and .docx
Why do we need to understand data visualisations There is more and .docxWhy do we need to understand data visualisations There is more and .docx
Why do we need to understand data visualisations There is more and .docx
 
Multivariate Data Visualization
Multivariate Data VisualizationMultivariate Data Visualization
Multivariate Data Visualization
 

Mehr von Ben Melbourne

Agile Enabled Product Innovation
Agile Enabled Product InnovationAgile Enabled Product Innovation
Agile Enabled Product InnovationBen Melbourne
 
Pecha Kucha - Edward Tufte Information Design books review
Pecha Kucha - Edward Tufte Information Design books reviewPecha Kucha - Edward Tufte Information Design books review
Pecha Kucha - Edward Tufte Information Design books reviewBen Melbourne
 
Finding time for design within agile software delivery
Finding time for design within agile software deliveryFinding time for design within agile software delivery
Finding time for design within agile software deliveryBen Melbourne
 
Gameification & gen y
Gameification & gen yGameification & gen y
Gameification & gen yBen Melbourne
 
IxDA QGov Single Website Experience
IxDA QGov Single Website ExperienceIxDA QGov Single Website Experience
IxDA QGov Single Website ExperienceBen Melbourne
 
Improving video rating performance – focusing on user & interface
Improving video rating performance – focusing on user & interfaceImproving video rating performance – focusing on user & interface
Improving video rating performance – focusing on user & interfaceBen Melbourne
 
Agile UX: User Experience Design in the world of Agile Software Development
Agile UX: User Experience Design in the world of Agile Software Development Agile UX: User Experience Design in the world of Agile Software Development
Agile UX: User Experience Design in the world of Agile Software Development Ben Melbourne
 
General UX activities & process overview
General UX activities & process overviewGeneral UX activities & process overview
General UX activities & process overviewBen Melbourne
 
Interaction design trends 2001
Interaction design trends 2001Interaction design trends 2001
Interaction design trends 2001Ben Melbourne
 
What is UX? Or How We're Learning to Build the Right Thing, The Right Way
 What is UX? Or How We're Learning to Build the Right Thing, The Right Way What is UX? Or How We're Learning to Build the Right Thing, The Right Way
What is UX? Or How We're Learning to Build the Right Thing, The Right WayBen Melbourne
 
Service Design vs Experience Design: Chicken & Egg or Wild Goose
Service Design vs Experience Design: Chicken & Egg or Wild GooseService Design vs Experience Design: Chicken & Egg or Wild Goose
Service Design vs Experience Design: Chicken & Egg or Wild GooseBen Melbourne
 

Mehr von Ben Melbourne (11)

Agile Enabled Product Innovation
Agile Enabled Product InnovationAgile Enabled Product Innovation
Agile Enabled Product Innovation
 
Pecha Kucha - Edward Tufte Information Design books review
Pecha Kucha - Edward Tufte Information Design books reviewPecha Kucha - Edward Tufte Information Design books review
Pecha Kucha - Edward Tufte Information Design books review
 
Finding time for design within agile software delivery
Finding time for design within agile software deliveryFinding time for design within agile software delivery
Finding time for design within agile software delivery
 
Gameification & gen y
Gameification & gen yGameification & gen y
Gameification & gen y
 
IxDA QGov Single Website Experience
IxDA QGov Single Website ExperienceIxDA QGov Single Website Experience
IxDA QGov Single Website Experience
 
Improving video rating performance – focusing on user & interface
Improving video rating performance – focusing on user & interfaceImproving video rating performance – focusing on user & interface
Improving video rating performance – focusing on user & interface
 
Agile UX: User Experience Design in the world of Agile Software Development
Agile UX: User Experience Design in the world of Agile Software Development Agile UX: User Experience Design in the world of Agile Software Development
Agile UX: User Experience Design in the world of Agile Software Development
 
General UX activities & process overview
General UX activities & process overviewGeneral UX activities & process overview
General UX activities & process overview
 
Interaction design trends 2001
Interaction design trends 2001Interaction design trends 2001
Interaction design trends 2001
 
What is UX? Or How We're Learning to Build the Right Thing, The Right Way
 What is UX? Or How We're Learning to Build the Right Thing, The Right Way What is UX? Or How We're Learning to Build the Right Thing, The Right Way
What is UX? Or How We're Learning to Build the Right Thing, The Right Way
 
Service Design vs Experience Design: Chicken & Egg or Wild Goose
Service Design vs Experience Design: Chicken & Egg or Wild GooseService Design vs Experience Design: Chicken & Egg or Wild Goose
Service Design vs Experience Design: Chicken & Egg or Wild Goose
 

Kürzlich hochgeladen

Developer Data Modeling Mistakes: From Postgres to NoSQL
Developer Data Modeling Mistakes: From Postgres to NoSQLDeveloper Data Modeling Mistakes: From Postgres to NoSQL
Developer Data Modeling Mistakes: From Postgres to NoSQLScyllaDB
 
Streamlining Python Development: A Guide to a Modern Project Setup
Streamlining Python Development: A Guide to a Modern Project SetupStreamlining Python Development: A Guide to a Modern Project Setup
Streamlining Python Development: A Guide to a Modern Project SetupFlorian Wilhelm
 
SIP trunking in Janus @ Kamailio World 2024
SIP trunking in Janus @ Kamailio World 2024SIP trunking in Janus @ Kamailio World 2024
SIP trunking in Janus @ Kamailio World 2024Lorenzo Miniero
 
Powerpoint exploring the locations used in television show Time Clash
Powerpoint exploring the locations used in television show Time ClashPowerpoint exploring the locations used in television show Time Clash
Powerpoint exploring the locations used in television show Time Clashcharlottematthew16
 
My INSURER PTE LTD - Insurtech Innovation Award 2024
My INSURER PTE LTD - Insurtech Innovation Award 2024My INSURER PTE LTD - Insurtech Innovation Award 2024
My INSURER PTE LTD - Insurtech Innovation Award 2024The Digital Insurer
 
Tampa BSides - Chef's Tour of Microsoft Security Adoption Framework (SAF)
Tampa BSides - Chef's Tour of Microsoft Security Adoption Framework (SAF)Tampa BSides - Chef's Tour of Microsoft Security Adoption Framework (SAF)
Tampa BSides - Chef's Tour of Microsoft Security Adoption Framework (SAF)Mark Simos
 
Anypoint Exchange: It’s Not Just a Repo!
Anypoint Exchange: It’s Not Just a Repo!Anypoint Exchange: It’s Not Just a Repo!
Anypoint Exchange: It’s Not Just a Repo!Manik S Magar
 
New from BookNet Canada for 2024: BNC CataList - Tech Forum 2024
New from BookNet Canada for 2024: BNC CataList - Tech Forum 2024New from BookNet Canada for 2024: BNC CataList - Tech Forum 2024
New from BookNet Canada for 2024: BNC CataList - Tech Forum 2024BookNet Canada
 
SAP Build Work Zone - Overview L2-L3.pptx
SAP Build Work Zone - Overview L2-L3.pptxSAP Build Work Zone - Overview L2-L3.pptx
SAP Build Work Zone - Overview L2-L3.pptxNavinnSomaal
 
Dev Dives: Streamline document processing with UiPath Studio Web
Dev Dives: Streamline document processing with UiPath Studio WebDev Dives: Streamline document processing with UiPath Studio Web
Dev Dives: Streamline document processing with UiPath Studio WebUiPathCommunity
 
Kotlin Multiplatform & Compose Multiplatform - Starter kit for pragmatics
Kotlin Multiplatform & Compose Multiplatform - Starter kit for pragmaticsKotlin Multiplatform & Compose Multiplatform - Starter kit for pragmatics
Kotlin Multiplatform & Compose Multiplatform - Starter kit for pragmaticscarlostorres15106
 
DevEX - reference for building teams, processes, and platforms
DevEX - reference for building teams, processes, and platformsDevEX - reference for building teams, processes, and platforms
DevEX - reference for building teams, processes, and platformsSergiu Bodiu
 
"ML in Production",Oleksandr Bagan
"ML in Production",Oleksandr Bagan"ML in Production",Oleksandr Bagan
"ML in Production",Oleksandr BaganFwdays
 
Artificial intelligence in cctv survelliance.pptx
Artificial intelligence in cctv survelliance.pptxArtificial intelligence in cctv survelliance.pptx
Artificial intelligence in cctv survelliance.pptxhariprasad279825
 
Gen AI in Business - Global Trends Report 2024.pdf
Gen AI in Business - Global Trends Report 2024.pdfGen AI in Business - Global Trends Report 2024.pdf
Gen AI in Business - Global Trends Report 2024.pdfAddepto
 
Story boards and shot lists for my a level piece
Story boards and shot lists for my a level pieceStory boards and shot lists for my a level piece
Story boards and shot lists for my a level piececharlottematthew16
 
Connect Wave/ connectwave Pitch Deck Presentation
Connect Wave/ connectwave Pitch Deck PresentationConnect Wave/ connectwave Pitch Deck Presentation
Connect Wave/ connectwave Pitch Deck PresentationSlibray Presentation
 
My Hashitalk Indonesia April 2024 Presentation
My Hashitalk Indonesia April 2024 PresentationMy Hashitalk Indonesia April 2024 Presentation
My Hashitalk Indonesia April 2024 PresentationRidwan Fadjar
 
Scanning the Internet for External Cloud Exposures via SSL Certs
Scanning the Internet for External Cloud Exposures via SSL CertsScanning the Internet for External Cloud Exposures via SSL Certs
Scanning the Internet for External Cloud Exposures via SSL CertsRizwan Syed
 

Kürzlich hochgeladen (20)

Developer Data Modeling Mistakes: From Postgres to NoSQL
Developer Data Modeling Mistakes: From Postgres to NoSQLDeveloper Data Modeling Mistakes: From Postgres to NoSQL
Developer Data Modeling Mistakes: From Postgres to NoSQL
 
Streamlining Python Development: A Guide to a Modern Project Setup
Streamlining Python Development: A Guide to a Modern Project SetupStreamlining Python Development: A Guide to a Modern Project Setup
Streamlining Python Development: A Guide to a Modern Project Setup
 
SIP trunking in Janus @ Kamailio World 2024
SIP trunking in Janus @ Kamailio World 2024SIP trunking in Janus @ Kamailio World 2024
SIP trunking in Janus @ Kamailio World 2024
 
Powerpoint exploring the locations used in television show Time Clash
Powerpoint exploring the locations used in television show Time ClashPowerpoint exploring the locations used in television show Time Clash
Powerpoint exploring the locations used in television show Time Clash
 
My INSURER PTE LTD - Insurtech Innovation Award 2024
My INSURER PTE LTD - Insurtech Innovation Award 2024My INSURER PTE LTD - Insurtech Innovation Award 2024
My INSURER PTE LTD - Insurtech Innovation Award 2024
 
Tampa BSides - Chef's Tour of Microsoft Security Adoption Framework (SAF)
Tampa BSides - Chef's Tour of Microsoft Security Adoption Framework (SAF)Tampa BSides - Chef's Tour of Microsoft Security Adoption Framework (SAF)
Tampa BSides - Chef's Tour of Microsoft Security Adoption Framework (SAF)
 
Anypoint Exchange: It’s Not Just a Repo!
Anypoint Exchange: It’s Not Just a Repo!Anypoint Exchange: It’s Not Just a Repo!
Anypoint Exchange: It’s Not Just a Repo!
 
New from BookNet Canada for 2024: BNC CataList - Tech Forum 2024
New from BookNet Canada for 2024: BNC CataList - Tech Forum 2024New from BookNet Canada for 2024: BNC CataList - Tech Forum 2024
New from BookNet Canada for 2024: BNC CataList - Tech Forum 2024
 
SAP Build Work Zone - Overview L2-L3.pptx
SAP Build Work Zone - Overview L2-L3.pptxSAP Build Work Zone - Overview L2-L3.pptx
SAP Build Work Zone - Overview L2-L3.pptx
 
DMCC Future of Trade Web3 - Special Edition
DMCC Future of Trade Web3 - Special EditionDMCC Future of Trade Web3 - Special Edition
DMCC Future of Trade Web3 - Special Edition
 
Dev Dives: Streamline document processing with UiPath Studio Web
Dev Dives: Streamline document processing with UiPath Studio WebDev Dives: Streamline document processing with UiPath Studio Web
Dev Dives: Streamline document processing with UiPath Studio Web
 
Kotlin Multiplatform & Compose Multiplatform - Starter kit for pragmatics
Kotlin Multiplatform & Compose Multiplatform - Starter kit for pragmaticsKotlin Multiplatform & Compose Multiplatform - Starter kit for pragmatics
Kotlin Multiplatform & Compose Multiplatform - Starter kit for pragmatics
 
DevEX - reference for building teams, processes, and platforms
DevEX - reference for building teams, processes, and platformsDevEX - reference for building teams, processes, and platforms
DevEX - reference for building teams, processes, and platforms
 
"ML in Production",Oleksandr Bagan
"ML in Production",Oleksandr Bagan"ML in Production",Oleksandr Bagan
"ML in Production",Oleksandr Bagan
 
Artificial intelligence in cctv survelliance.pptx
Artificial intelligence in cctv survelliance.pptxArtificial intelligence in cctv survelliance.pptx
Artificial intelligence in cctv survelliance.pptx
 
Gen AI in Business - Global Trends Report 2024.pdf
Gen AI in Business - Global Trends Report 2024.pdfGen AI in Business - Global Trends Report 2024.pdf
Gen AI in Business - Global Trends Report 2024.pdf
 
Story boards and shot lists for my a level piece
Story boards and shot lists for my a level pieceStory boards and shot lists for my a level piece
Story boards and shot lists for my a level piece
 
Connect Wave/ connectwave Pitch Deck Presentation
Connect Wave/ connectwave Pitch Deck PresentationConnect Wave/ connectwave Pitch Deck Presentation
Connect Wave/ connectwave Pitch Deck Presentation
 
My Hashitalk Indonesia April 2024 Presentation
My Hashitalk Indonesia April 2024 PresentationMy Hashitalk Indonesia April 2024 Presentation
My Hashitalk Indonesia April 2024 Presentation
 
Scanning the Internet for External Cloud Exposures via SSL Certs
Scanning the Internet for External Cloud Exposures via SSL CertsScanning the Internet for External Cloud Exposures via SSL Certs
Scanning the Internet for External Cloud Exposures via SSL Certs
 

Extending human perception with data visualisation

  • 1. Extending human perception with Data visualisation This is taken from a talk on Big Data. About visual tools and techniques for communicating data. That’s a visualisation of Facebook connections.
  • 2. Visualisations of big data are often beautiful but useless. This is art, not insight.
  • 3. Communicating insights are not just about pretty graphics, that’s just design porn.
  • 4. “Visualization allows people to offload cognition to the perceptual system, using carefully designed images as a form of external memory.” Tamara Munzner Department of Computer Science University of British Columbia Visualisation extends perception & memory. http://www.cs.ubc.ca/labs/imager/tr/2009/VisChapter/akp-vischapter.pdf
  • 5. A visualisation turns something you want to find into something you can see.
  • 7. How do we extend the human ability to perceive data? We make it possible for our eyes to see trends and identify differences. Work with human perception: Senses, memory, cognition.
  • 8. This can be done by using a variety of “visual search” techniques to make data “Pop out”. Colour, size, orientation, shape, grouping, motion,
  • 9. This can be done by using a variety of “visual search” techniques to make data “Pop out”. Colour, size, orientation, shape, grouping, motion,
  • 10. This can be done by using a variety of “visual search” techniques to make data “Pop out”. Colour, size, orientation, shape, grouping, motion,
  • 11. This can be done by using a variety of “visual search” techniques to make data “Pop out”. Colour, size, orientation, shape, grouping, motion,
  • 12. This can be done by using a variety of “visual search” techniques to make data “Pop out”. Colour, size, orientation, shape, grouping, motion,
  • 13. This can be done by using a variety of “visual search” techniques to make data “Pop out”. Colour, size, orientation, shape, grouping, motion,
  • 14. This can be done by using a variety of “visual search” techniques to make data “Pop out”. Colour, size, orientation, shape, grouping, motion,
  • 15. Don’t show it all at once. Filter, Animate, Summarise,
  • 16. Don’t show it all at once. Filter, Animate, Summarise,
  • 17. Don’t show it all at once. Filter, Animate, Summarise,
  • 18. x 133 Don’t show it all at once. Filter, Animate, Summarise,
  • 19. Look at me! Annotate and label – help people not get lost.
  • 20. Text Clusters Outliers Correlations Patterns to look for: Clusters, outliers, extents, correlations. http://www.google.com/publicdata/explore? ds=d5bncppjof8f9_&ctype=b&strail=false&nselm=s&met_x=sp_dyn_le00_in&scale_x=lin&ind_x=false&met_y=sp_dyn_tfrt_in&sc ale_y=lin&ind_y=false&met_s=sp_pop_totl&scale_s=lin&ind_s=false&dimp_c=country:region&ifdim=country&hl=en&dl=en&icon Size=0.5&uniSize=0.035#! ctype=b&strail=false&bcs=d&nselm=s&met_x=sp_dyn_le00_in&scale_x=lin&ind_x=false&met_y=sp_dyn_tfrt_in&scale_y=lin&ind _y=false&met_s=sp_pop_totl&scale_s=lin&ind_s=false&dimp_c=country:region&ifdim=country&pit=-153914400000&hl=en_US &dl=en&ind=false
  • 21. Look at me! Look at me! Look at me! Minimum necessary difference. Reduce visual noise. Tufte: What is the minimum number of pixels required to highlight the difference between data.
  • 22. Look at me! Look at me! Look at me! Minimum necessary difference. Reduce visual noise. Tufte: What is the minimum number of pixels required to highlight the difference between data.
  • 23. You are here You can’t look at big data sets all at once, you can look at 2 parts of it at once to try to make sense of them together in your mind. Interface extends perception, allowing us to understand what it is telling us. Total Perspective Vortex - Zaphod Bebblebrox