call girls in Kamla Market (DELHI) 🔝 >༒9953330565🔝 genuine Escort Service 🔝✔️✔️
Kunzli
1. ARTICLES
Public-health impact of outdoor and traffic-related air pollution: a
European assessment
N Künzli, R Kaiser, S Medina, M Studnicka, O Chanel, P Filliger, M Herry, F Horak Jr, V Puybonnieux-Texier, P Quénel,
J Schneider, R Seethaler, J-C Vergnaud, H Sommer
Summary action in Europe. Our results, which have also been used
for economic valuation, should guide decisions on the
Background Air pollution contributes to mortality and
assessment of environmental health-policy options.
morbidity. We estimated the impact of outdoor (total) and
traffic-related air pollution on public health in Austria, Lancet 2000; 356: 795–801
France, and Switzerland. Attributable cases of morbidity See Commentary page ????
and mortality were estimated.
Introduction
Methods Epidemiology-based exposure-response func-tions
Research during the past 10–20 years confirms that
for a 10 μg/m3 increase in particulate matter (PM10) were
outdoor air pollution contributes to morbidity and
used to quantify the effects of air pollution. Cases
mortality.1,2 Whereas some effects may be related to
attributable to air pollution were estimated for mortality short-term exposure,3 others have to be considered
(adults 30 years), respiratory and cardiovascular hospital contributions of long-term exposure.4,5 Although the
admissions (all ages), incidence of chronic bronchitis mechanisms are not fully explained, epidemiological
(adults 25 years), bronchitis episodes in children (<15 evidence suggests that outdoor air pollution is a
years), restricted activity days (adults 20 years), and contributing cause of morbidity and mortality.6 State-of-
asthma attacks in adults and children. Population exposure the-art epidemiological research has found consistent
(PM10) was modelled for each km2. The traffic-related and coherent associations between air pollution and
fraction was estimated based on PM10 emission inventories. various outcomes (eg, respiratory symptoms, reduced
lung function, chronic bronchitis, and mortality).6
Findings Air pollution caused 6% of total mortality or more
Relative risks related to air pollution, however, are
than 40 000 attributable cases per year. About half of all
rather small. For example, for an average adult, the risk
mortality caused by air pollution was attributed to
of dying may increase on any given day by less than 1% if
motorised traffic, accounting also for: more than 25 000
the concentration of inhalable (<10 m diameter)
new cases of chronic bronchitis (adults); more than particulate matter (PM10) increases by 10 g/m3.3 Given
290 000 episodes of bronchitis (children); more than 0·5 the finite resources available to protect health, there is a
million asthma attacks; and more than 16 million person- need to weight different risks and to allocate preventive
days of restricted activities. resources to get the maximum benefit. We present a
Interpretation This assessment estimates the public-health three-country interdisciplinary assessment of the impact
impacts of current patterns of air pollution. Although related to air polution on morbidity and mortality. The
individual health risks of air pollution are relatively small, project has been initiated by WHO Europe as a case
study in the framework of the transport environment and
the public-health consequences are considerable. Traffic-
health session of the WHO Ministerial Conference on
related air pollution remains a key target for public-health
Environment and Health, held in London, UK, in 1999.7
National agencies from Austria, France, and
Institute for Social and Preventive Medicine, University Basel, Switzerland assessed the external public-health costs of
Switzerland (N Künzli MD); National Institute for Public Health total air pollution and of traffic-related air pollution. The
Surveillance, Environmental Health Department, Saint-Maurice, focus on traffic-related air pollution and on economic
France (R Kaiser MD, S Medina MD, P Quénel MD); Center for
valuation is based on the argument that traffic creates
Pulmonary Disease, Vienna, Austria (M Studnicka MD); French
National Centre for Scientific Research, Economic Department,
costs which are not covered by the polluters (the
GREQAM, Marseille, France (O Chanel MD); Swiss Agency for the motorists). Such costs cause economic problems,
Environment, Forest and Landscape, BUWAL, Bern, Switzerland because they are not included in the market price, which
(P Filliger PhD); Max Herry, Consultancy Dr Max Herry, Vienna leads to a wasting of scarce and important resources
(M Herry PhD); University Children’s Hospital Vienna, Austria (eg, clean air, silence, and clean water). To stop this
(F Horak Jr MD); Université Paris 7-LED, Paris, France wastage, the real price should be put on clean air. With
(V Puybonnieux-Texier MSc); Federal Environment Agency, the present study, an important part of the external
Department of Air Quality Control, Vienna (J Schneider PhD); traffic-related costs, namely the negative impacts of
Institute for Transport Studies, University of Sydney, Sydney,
traffic-related air pollution on human health were
Australia (R Seethaler MEc); French National Centre for Scientific
Research, Economic Department, EUREQUA, Paris (J-C Vergnaud
assessed in terms of attributable number of cases. The
PhD); and ECOPLAN, Economic and Environmental Studies, Berne quantification of the related external costs are
and Altdorf, Switzerland (H Sommer PhD) summarised in an Organisation for Economic Co-
Correspondence to: Dr N Künzli, Institut für Sozial-und operation and Development (OECD) report. The full
Präventivmedizin der Universität Basel, Steinengraben 49, project reports are available from WHO
4051 Basel, Switzerland (www.who.dk/london99/transport04.htm, accessed Aug
(e-mail: Nino.Kuenzli@unibas.ch) 17, 2000).8–10
THE LANCET • Vol 356 • September 2, 2000 795
For personal use only. Not to be reproduced without permission of The Lancet.
2. ARTICLES
Methods and the population distribution—ie, the number of
Design and participants people living at the respective level of exposure. We
The impact assessment relies on calculating the divided exposure into categories of 5 g/m3, (>5–10
attributable number of cases.11 We extended the g/m3, >10–15 g/m3, and so on). 7·5 g/m3 (the mean
methods of Ostro and colleagues to further specify and of the category 5–10 g/m3) was used as the lowest
standardise influential assumptions and decisions. assessed value. Thus, the health impact of air-pollution
Cases of morbidity or mortality attributable to air exposure below 7·5 g/m3 was ignored. Although there is
pollution were derived for the health outcomes listed in no evidence for any threshold, there are also no studies
table 1. Outcomes were ignored if quantitative data were available where participants were exposed to PM10 below
not available, if costing was impossible (eg, valuing 5–10 g/m3 (annual mean). Furthermore, this reference
decrement in pulmonary function), and to prevent level10 also includes the natural background PM10. To
overlapping health measures from causing multiple derive the population exposure distribution, annual
counting of the same costs (eg, emergency visits were mean concentrations of PM10 were modelled for each
not considered because they were partly included in the country at a spatial resolution of 1 km2 (in France it was
hospital admissions). 4 km2).10
To assess the effects of air pollution—a complex In each country, the best available data from 1996
mixture of pollutants—epidemiological studies use were used. The Australia PM10 models mostly used total
several indicators of exposure, (eg, NO2, CO, PM10, total suspended particulate and NOx concentration data with
suspended particles, SO2). These pollutants, however, source-specific factors to estimate the exposure.10 The
are correlated. Hence, epidemiological studies cannot French PM10 exposure models were based on the data
strictly allocate observed effects to single pollutants. A from a few sites for PM10 and an extensive monitoring
pollutant-by-pollutant assessment would grossly network for black smoke, a measurement method for
overestimate the impact. Therefore, we selected only one fine particulate matter from combustion sources. PM10
pollutant to derive the attributable cases. In this context emission registries were available only for Switzerland,
PM10 is a useful indicator of several sources of outdoor enabling the adoption of emission-based dispersion
air pollution such as fossil-fuel combustion.1 models which considered primary particulates,
The model for our calculation, applied to each health secondary particles formed in the atmosphere from
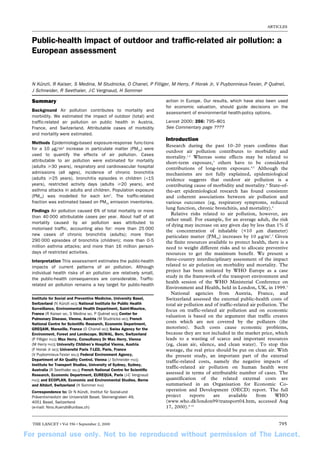
outcome, is shown in figure 1.9 Three data components precursor emissions, and transboundary large-scale PM.
are required to estimate the number of cases attributed With this emission-based model, we calculated PM10
to outdoor air pollution in a given population: the distributions for total PM10 and traffic-related PM10
exposure-response function; the frequency of the health directly.10 Models were validated by measurements of
outcome (eg, the incidence or the prevalence) and the PM10 and the chemical composition of particulates at
level of exposure. several locations. For all three countries, results of the
The association between outdoor air pollution and emission-based Swiss study were used to derive the
health-outcome frequency is usually described with an traffic-related fraction of PM10 for Austria with
exposure-response function (or effect estimate) that measurement data on the chemical composition of PM
expresses the relative increase in adverse health for a and international modelling.10
given increment in air pollution. For each outcome we Combining PM10 maps for 1996 (annual mean) with
selected studies from the peer-reviewed literature to information on the place of residence of the population
derive the exposure-response function and the 95% CI. on a km2 grid, annual mean exposure distributions for
For inclusion, an adequate study design and published the population were derived. For short-term health
PM10 levels were required. Cross-sectional or cohort effects, the use of annual mean implies that the short-
studies relying on two or three levels of exposure were term (daily) PM10 corresponds, on average, to the annual
omitted, as were ecological studies, given their inherent mean.
limitations.12
The meta-analytical effect estimate was calculated as Assumptions and estimations
the variance weighted average across the results of all To take account of inherent uncertainty in the impact
studies. Studies with low standard errors had, therefore, assessment, two principles have been adopted. First, for
more weight in the joint estimate. For each health the main assumptions an “at least” approach was applied
endpoint, the pooled relative risk (upper and lower 95% on each step—ie, methods were selected to obtain an
CI) per 10 g/m3 PM10 was given, and adjusted for impact which may be expected to be “at least”
heterogeneity where needed. attributable to air pollution. Second, the uncertainties in
The health-outcome frequencies (mortality, the effect estimates were quantified and the results were
prevalence, incidence, or person-days) may differ across given as a range (95% CI of the exposure-response
countries; thus, national or European data were used function). The sensitivity of the impact estimates will be
when possible (table 2). For some population discussed both qualitatively and quantitatively for the
frequencies, rates had to be estimated because of limited main assumptions.
national coverage (hospital admission rates in France
and Switzerland); for others, epidemiological studies Derivation of attributable number of cases
were the only source (bronchitis incidence from the Using the exposure-response functions, expressed as
Adventist Health and Smog Study,13 which has also been relative risk (RR) per 10 g/m3, and the health frequency
used by Ostro and colleagues14). In these cases, common per 1000 000 inhabitants, we calculated for each health
baseline frequencies were used for all three countries. outcome the attributable number of cases (D10) for an
Annual mean outdoor PM10 had to be determined on a increase of 10 g/m3 PM10 (figure 1), as: D10=(RR-1)*P0
continuous scale. Therefore, the attributable number of where P0 is the health frequency, given an exposure E0
cases depend on: the assumed exposure reference level and RR is the mean exposure-response function across
796 THE LANCET • Vol 356 • September 2, 2000
For personal use only. Not to be reproduced without permission of The Lancet.
3. ARTICLES
Health outcome Definition Source of exposure-response function Source of population frequency
Long-term mortality Death rate, excluding violent death or Dockery DW et al 19934 National death certificate statistics for 1996
(adults 30 years) accidents, >30 years Pope CA et al 19955 (Switzerland 1995)
Respiratory hospital admissions ICD9 460–519 Spix C et al 199830 National hospital statistics for 1996
(all ages) ICD9 466, 480–487, 493, 490–492, 494–496 Wordley J et al 199731
ICD9 480–487, 490–496 Prescott GJ et al 199832
Cardiovascular hospital admissions ICD9 410–436 Wordley J et al 199731 National hospital statistics for 1996
(all ages) ICD9 390–459 Poloniecki JD et al 199733
ICD9 390–459 Medina S et al 199734
ICD9 410–414, 426–429, 434–440 Prescott GJ et al 199832
Chronic-bronchitis incidence Symptoms of cough and/or sputum production Abbey DE et al 199335 Abbey DE et al 199335
(adults 25 years) on most days, for at least 3 months per year,
and for 2 years or more, age 25 years
Bronchitis episodes Bronchitis in past 12 months (parents or Dockery DW et al 198936 Studnicka M et al 199739 Oberfeld G et al 1996
(children <15 years) guardian’s answer), ages 10–12, 8–12, and Dockery DW et al 199637 (Austria)40
6–15 years, respectively Braun-Fahrländer C et al 199738 SCARPOL* (unpublished data, Switzerland, France)
Restricted activity days Any days where respondent was forced to Ostro B et al 199041 Social Insurance Statistics Report 1997 (Austria)
(adults 20 years) alter normal activity, due to respiratory SAPALDIA† (unpublished data, Switzerland, France)
disease ICD9 460–466, 470–474, 480–486,
510–516, 519, and 783, age 20–65 years
Asthma attacks Lower respiratory symptoms, age 6–12 years Roemer W et al 199342 Eder W et al 199845; Haidinger et al 199846;
(children <15 years) Asthma, age 7–15 years Segala C et al 199843 SCARPOL* (unpublished data, joint estimate)
Lower respiratory symptoms, age 7–13 years Gielen MH et al 199744
Asthma attacks Wheeze, age 18–80 years Dusseldorp A et al 199647 ECRHS‡ (unpublished data); SAPALDIA†
(adults 15 years) Shortness of breath, age 18–55 years Hiltermann TJN et al 199848 (unpublished data, joint estimate)
Wheeze, age 16–70 years Neukirch F et al 199849
*Swiss study on childhood allergy and repiratory symptoms to air pollution. †Swiss study on air pollution and lung disease in adults. ‡European Community respiratory
health survey. ICD9=International Classification of Diseases, ninth revision.
Table 1: Health outcome definition and sources of data
the studies used (table 1). The exposure-response Discussion
functions are usually log-linear. For small risks and By contrast with other projects,14–17 which each used
across limited ranges of exposure log-linear and linear different assumptions, our results are comparable across
functions would provide very similar results. However, if the participating countries. Because the whole
one may apply the method to populations with very large population is exposed the attributable proportion is
exposure ranges, the impact may be seriously substantial, even though epidemiological studies indicate
overestimated on the log-linear scale. Thus, we derived that air pollution imposes on the individual a small risk
the attributable number of cases (D in figure 1) on an for morbidity and mortality. The public-health impact,
additive scale. The calculation of D10 requires, however, however, depends not only on the relative risk but also
prior definition of P0. We defined P0 as the health on the exposure distribution in the population. Our
outcome frequency that one may expect, given the assessment assigned about 6% of annual deaths to
reference level of exposure, E0 (7·5 g/m3 annual mean outdoor air pollution.
PM10). We derived P0 from PE, applying the risk function As a major source of both primary PM emissions and
backwards from PE (the current population mean precursors of secondary particulate matter, traffic
substantially contributes to the overall impact of outdoor
exposure), to P0 (chosen to be 7·5 g/m3). This
air pollution (table 3). This high contribution is also
procedure is in line with the prudent “at least” approach.
because the emission densities of traffic are, on average,
With D10 and the number of people living in each
highest in highly populated areas.
category of exposure, the total number of cases By contrast with directly countable events, which can
attributable to air pollution can be calculated. be listed in national health statistics (eg, deaths or
injuries due to traffic accidents), it is not possible to
Results
Table 2 summarises for each health outcome the effect Risk function
estimates, the country-specific health-outcome frequencies (eg, slope β, or RR)
Population outcome
at E0, and the respective number of cases attributed to a
10 g/m3 increase in PM10 (D10). The population P Model population
frequency
exposure distribution is summarised in table 3.
The mean exposure for the population was similar in D
D10
all three countries with somewhat higher exposures in PO
Austria. Using the Swiss emission-dispersion models for
PM, we estimated that the traffic share of the total PM10
exposure depended on the mean concentration, ranging EO EO +10 E
from 28% at an annual mean PM10 of 10–15 g/m3, and
increasing up to 58% in areas where the total annual PM10 Level
mean PM10 concentrations were above 40 g/m3.10 For Model to derive number of cases attributable to air pollution
Austria, somewhat lower relative contributions of traffic Based on exposure-response function (slope or relative risks, RR, from
to PM10 were obtained.10 epidemiological studies), population frequency of the outcome, P (ie,
prevalence, incidence, or number of days), and respective level of
The traffic-related proportion of the total cases exposure, E. We assume reference exposure level (E0). Health effects
attributable to air pollution corresponded to the traffic- below this level are ignored. P0 is expected outcome frequency, given
exposure level E0. D10 is number of cases attributed to increase in
related fraction of PM10, amounting to 43% in Austria, exposure by 10 units (10 g/m3 PM10). D is total number of cases
56% in France, and 53% in Switzerland (table 4). attributed to air pollution for model population.
THE LANCET • Vol 356 • September 2, 2000 797
For personal use only. Not to be reproduced without permission of The Lancet.
4. ARTICLES
Health outcome Effect estimate Health outome frequency Attrbutable number of cases per 10 g/m3 PM10 (D10) and 1 000 000 inhabitants
relative risk (95% CI) per million inhabitants per year (D10lower-D10upper based on 95% CI estimates)
Austria France Switzerland Austria France Switzerland
Total mortality 1·043 (1·026–1·061) 9330 8390 8260 370 (230–520) 340 (210–480) 340 (200–470)
(adults >30 years,
excluding violent death)
Respiratory hospital 1·013 (1·001–1·025) 17 830 11 550 10 300 230 (20–430) 150 (20–280) 130 (10–250)
admission (all ages)
Cardiovascular hospital 1·013 (1·007–1·019) 36 790 17 270 24 640 450 (230–670) 210 (110–320) 300 (160–450)
admission (all ages)
Chronic-bronchitis 1·098 (1·009–1·194) 4990 4660 5010 410 (40–820) 390 (40–780) 430 (40–860)
incidence (adults
25 years)
Bronchitis episodes 1·306 (1·135–1·502) 16 370 23 530 21 550 3200 (1410–5770) 4830 (2130–8730) 4620 (2040–8350)
(children <15 years)
Restricted activity days 1·094 (1·079–1·502) 2 597 300 3 221 200 3 373 000 208 400 263 700 281 000
(adults 20 years)* (175 400–241 800) (222 000–306 000) (236 500–326 000)
Asthma attacks 1·044 (1·027–1·062) 56 700 62 800 57 500 2330 (1430–3230) 2600 (1600–3620) 2400 (1480–3340)
(children <15 years)†
Asthma attacks 1·039 (1·019–1·059) 173 400 169 500 172 900 6280 (3060–9560) 6190 (3020–9430) 6370 (3100–9700)
(adults 15 years)†
*Total person-days per year. †Total person-days per year with asthma attacks.
Table 2: Health outcomes with relative risks, outcome frequency, and attributable cases (per 10 g/m3 and 1 million population)
directly identify the victims of complex substances and However, given that traffic contributes a lot to outdoor
mixtures with cumulative toxicity, such as smoking or air air pollution, the observed epidemiological effects may
pollutants. Neither are the health-relevant characteristics be driven substantially by this source. In fact,
of the exposure unanimously defined, nor are the health combustion-related PMs may contribute to the smaller
outcomes specifically linked to air pollution only. fraction, such as PM2·5, for which some studies show
Therefore, uncertainty remains an inherent even stronger associations with adverse health.4 Thus,
characteristic of any attempt to derive attributable cases. we consider it unlikely that we overestimated the relative
We prudently dealt with uncertainty, deriving the impact of traffic.
number of cases “at least” attributable to air pollution. Health-outcome frequencies may strongly influence
We did not include all health outcomes associated with the impact assessment. Whereas for mortality the
ambient air. For mortality, we ignored potential effects national sources may be considered accurate, frequency
on newborn babies or infants.18 Although infant measures of morbidity and data on health-care systems
mortality is low in the countries considered, and thus the have to be considered estimates with some inherent
number of attributable cases is small, the impact on uncertainties. Our decision to choose national health
years of life lost, and therefore the economic valuation, frequency data, if available, may have reduced the
could be considerable. impact of these limitations.
Restriction of the analysis to PM10 underestimates For several reasons, mortality is the most controversial
independent effects of air pollution not explained by or of our outcome measures. We used the cohort-based
correlated with the PM fractions. One example may be long-term effect estimates of outdoor air pollution on
ozone, most likely leading to further, as yet survival time, whereas short-term time-series-based
unquantified, effects.16 effects were not included separately.11 The number of
The allocation of the impact to specific sources adds deaths attributed to air pollution would be about 4–5
to the uncertainty. In fact, source apportionment of times smaller if the short-term effect estimates had been
outdoor air pollution is rarely done and objective source- applied. Our decision, however, was based on
specific measures of PM have never been used in the methodological grounds. We consider it inappropriate to
epidemiological studies. Thus, although PM10 correlates use short-term studies for the impact assessment of
with various health outcomes, it is not clear whether the annual mortality.11 The short-term studies capture only
exposure-response function from outdoor air pollution part of the air-pollution-related cases, namely those
related to traffic may differ from the non-traffic effects. where exposure and event (death) are closely connected
PM10 concentration exposure class Population exposure distribution for total PM10 Population exposure distribution for PM10 without
( g/m3) traffic-attributable fraction
Austria France Switzerland Austria France Switzerland
0–5 0 0·2% 0 0 0·4% 0·1%
>5–10 0 0·5% 1·2% 9·5% 3·3% 5·1%
>10–15 11·4% 5·2% 5·7% 21·9% 52·0% 59·6%
>15–20 14·2% 31·5% 31·8% 32·7% 41·8% 35·0%
>20–25 22·8% 33·3% 42·5% 23·5% 1·9% 0·2%
>25–30 27·7% 12·8% 14·6% 5·2% 0·5% 0
>30–35 8·5% 7·8% 3·0% 3·3% 0·1% 0
>35–40 4·7% 4·1% 0·9% 2·1% 0 0
>40 10·7% 4·6% 0·3% 1·9% 0 0
Mean* 26·0 23·5 21·4 18·0 14·6 14·0
*Population weighted mean. In considered range of exposure (ie, above 7·5 g/m3) traffic-related PM10 was: Austria 43·2%, France 55·6%, Switzerland 53·2%.
Table 3: Population exposure distribution of PM10
798 THE LANCET • Vol 356 • September 2, 2000
For personal use only. Not to be reproduced without permission of The Lancet.
5. ARTICLES
Health outcomes Estimated attributable number of cases or days (95% CI)
Total outdoor air pollution (PM10) Traffic-related air pollution (PM10)
Austria France Switzerland Austria France Switzerland
Long-term mortality 5600 31 700 3300 2400 17 600 1800
(adults 30 years) (3400–7800) (19 200–44 400) (2000–4700) (1500–3400) (10 700–24 700) (1100–2500)
Respiratory hospital 3400 13 800 1308 1500 7700 700
admissions (all ages) (400–6500) (1400–26 300) (140–2500) (160–2800) (800–14 600) (70–1300)
Cardiovascular hospital 6700 19 800 3000 2900 11 000 1600
admissions (all ages) (3500–10 000) (10 400–29 400) (1500–4400) (1500–4300) (5800–16 300) (800–2400)
Chronic-bronchitis 6200 36 700 4200 2700 20 400 2300
incidence (600–12 000) (3300–73 100) (370–8400) (240–5300) (1800–40 700) (200–4500)
(adults >25 years)
Bronchitis 48 000 450 000 45 000 21 000 250 000 24 000
(children < 15 years) (21 000–86 000) (198 500–813 600) (20 000–82 000) (9000–37 000) (110 000–453 000) (11 000–44 000)
Restricted activity days 3·1 24·6 2·8 1·3 13·7 1·5
in adults 20 years (2·6–3·6) (20·7–28·5) (2·4–3·2) (1·1–1·6) (11·5–15·9) (1·2–1·7)
(in millions)
Asthmatics: asthma 35 000 243 000 24 000 15 000 135 000 13 000
attacks (21 000–48 000) (149 000–337 000) (15 000–33 000) (9000–21 000) (83 000–188 000) (8000–17 000)
(children <15 years)
Asthmatics: asthma 94 000 577 000 63 000 40 000 321 000 33 000
attacks (adults 15 (46 000–143 000) (281 000–879 000) (30 000–95 000) (20 000–62 000) (155 000–489 000) (16 000–51 000)
years, person days)
Table 4: Number of attributable cases to air pollution, and cases attributed to traffic pollution
in time. Most importantly, however, reduced life- PM10.8 With this assumption, the lifetime lost among those
expectancy, due to long-term morbidity enhanced by air affected by air pollution is shorter than for other non-
pollution, may not be captured in the time series; thus, violent causes—for example, the average victim of traffic
the time-series-based impact assessment would be accidents is much younger (<40 years) than those who die
incomplete.9 Cohort studies, by design, compare person- as a result of air pollution. Therefore, the lifetime lost
time, thus, time to death, across different levels of because of traffic accidents is longer, although our study
exposure. Therefore, our calculation based on cohort attributes about twice as many deaths to air pollution
studies captures both the short-term effects and the than to accidents.7 On the other hand, there is increasing
long-term effects. Unfortunately, we had to rely on only evidence that air pollution may also influence mortality
two US studies, studies which were partly confirmed by rates of newborn babies or infants. As we did not quantify
a third US study.20 Preliminary results of the French attributable number of deaths below age 30 years, we
mortality follow-up of the PAARC study21 in general might have underestimated life time lost.
support the USA findings. For chronic bronchitis, our assessment relies on one
Because the cohort studies published the numbers of study.13 The advantage of the study is the reporting of
deaths rather than lifetime lost, we primarily calculated effects of PM on the incidence of chronic bronchitis
the attributable number of deaths. In the economic among a population with very low rates of smoking. This
valuation of death, however, assumptions about age measure was particularly useful for the economic
structure of those affected, may be influential.22 Both from valuation and had been used before.14 It is of note,
morbidity and short-term mortality studies air pollution however, that the Swiss SAPALDIA study24 corroborates
may be mostly related to cardiopulmonary disease, the US findings, showing increased prevalence of
including lung cancer. This subgroup tends to die, on chronic bronchitis symptoms also in Europe, as shown
average, at older ages than all other non-violent causes of before in the USA.
death. For example, in 1995, the mean age at death due The selection of a common exposure-response
to cardiopulmonary causes in Switzerland was 80 years, function assumes that the effects of outdoor air
whereas the mean age of all other non-violent causes of pollution, characterised by PM10, are quantitatively
death was 72 years.23 As a consequence, life expectancy is identical across countries. We base this assumption on
shortened by about 6 months per 10 g/m3 increment in the consistency of epidemiological results observed
Sensitivity Criteria and assumptions Air pollution attributable Sensitivity (ie, alternative result
number of cases in % of the main point estimates)
Total Due to traffic Total Due to traffic
Point estimate of this study 3300 1800 100% 100%
Quantified uncertainty (meta-analytic exposure-response estimate)
Lower 95% CI value 2000 1100 60% 60%
Upper 95% CI value 4700 2500 140% 140%
PM10 population exposure distribution from 1993 model10 3200 2000 96% 114%
Higher traffic share: assume PM10 without traffic to be 10·7 g/m3 insteaad of 14·0 g/m3 3300 2600 100% 145%
Exposure reference value (E0): 0 instead of 7·5 g/m3* 5100 1800 154% 100%
Only impact of exposure >15 g/m3 annual mean (instead of 7 g/m3)† 1500 1500 46% 86%
Only impact of exposure >20 g/m3 annual mean (instead of 7 g/m3)† 400 400 10% 19%
*To simplify the example, we assume no traffic share below 7·5 g/m3. †In this example, exposure>15 g/m3 and >20 g/m3, respectively, are assumed to originate from traffic only.
Health impact due to exposure between 0–15 g/m3 and 0–20 g/m3, respectively, are omitted.
Table 5: Sensitivity of the estimation of air pollution attributable number of cases of death (mortality >30 years of age) compared
with the quantified uncertainty (95% CI of epidemiological risk estimates), based on Swiss data only
THE LANCET • Vol 356 • September 2, 2000 799
For personal use only. Not to be reproduced without permission of The Lancet.
6. ARTICLES
across many countries—eg, for conditions such as particularly true for environmentally sensitive decisions.
bronchitis among children or hospital admissions. Third, we consider the participation of epidemiologists
Therefore, we included some health-outcome measures and other sciences in this interdisciplinary process of
which have not been specifically investigated in Austria, impact assessment as crucial.27
France, or Switzerland, such as long-term mortality and Attributable cases are commonly interpreted as the
restricted-activity days, where we relied on US studies. preventable fraction, which is meant to be prevented had
The short-term association of PM and daily mortality exposure been removed. Caution, however, is warranted
are consistent between the USA and Europe. We have with such an interpretation. First, for long-term effects—
assumed consistency in the long-term effects as well. the benefit of lower air-pollution levels—would take
Apart from the variability of epidemiological years to be fully realised.8 Second, the attributable risk
exposure-response estimates (95% CI), we did not estimate does not take competing risks into account.
quantify other sources of uncertainty such as, errors in Removing one risk factor—eg, air pollution—will
the population exposure distribution, in the derivation of increase the relative importance and contribution of
traffic-related fractions, or in the estimation of health- other risks and causes of morbidity and mortality.
outcome frequencies. Simulations of multiple Accordingly, it is well known in multicausal diseases that
probability distributions may, however, erroneously the sum of attributable cases across several risk factors
suggest a level of precision in assessing uncertainty that will not add up to 100% but may be larger.28 Impact
cannot be achieved. It may also distract from the fact measures that take competing risks into account need to
that basic assumptions such as our underlying “at least” be developed.29 It is to be emphasised that the economic
approach are most influential. Furthermore, no data loss of the health impact of air pollution goes beyond the
were available on the precision of population exposure direct costs of medical treatment. Loss of production
estimates as this was the first time that tri-national and consumption as well as intangible costs (pain,
exposure distributions have been derived for PM10. suffering) of disease and death have to be taken into
However, in the framework of a previous Swiss impact account. Several economic valuation methods are
assessment project PM10 exposure distributions have also available. Details of the economic valuation of this
been estimated, using different methods and input data trinational project are presented elsewhere.8,22
(ie, ambient concentrations rather than emission data).10 Even after taking the overall uncertainty of this
Given the availability of these Swiss data, we made some estimation into account, the project emphasises the need
estimates of the sensitivity of the Swiss results for to consider air pollution and traffic-related air pollution
changes in the main assumptions. As shown in table 5 as a widespread cause of impaired health. In a century
for “death”, the population exposure distribution model moving toward sustainable development and health,
from 1996, based on 1993 PM10 measurements, is of closer collaboration of public health and environmental
little influence on the total impact estimates. The policies will enhance preventive success. Further
alternative results fall well within the ±40% range of the development of standardised impact assessment
indicated uncertainty, based on the 95% CI of the methods is needed to achieve comparability of results,
relative risk estimate. However, the assumed exposure both across projects or countries, and over time, to
reference value of 7·5 g/m3 is influential: the impact assess the benefits from clean air strategies.
estimates would be some 54% higher if the exposure Contributors
impact were to be quantified from zero. The importance Nino Künzil wrote the paper, and contributed to the methodological
of the reference value is further demonstrated in the last development of the project. Reinhard Kaiser wrote parts of the
epidemiology report, and did the metatanalytic calculations.
two rows of table 5. In Switzerland, the public-health Sylvia Medina collected the French epidemiological data and
impact of exposure levels >15 g/m3, corresponding to contributed to the development of a common methodology.
the reference value used in a 1996 US assessment,25 Michael Studnicka coordinated the epidemiological assessment for
Austria and contributed to the development of the common
would make up only 46% of our results. Only 10% of interdisciplinary methodology. Fritz Horak Jr established the contact to
our impact estimates can be attributed to exposures national epidemiology and registries and developed a trinational
above the Swiss target clean air value (20 g/m3 annual common methodology. Olivier Chanel and Jean-Christophe Vergnaud
contributed to the development of the economic methods and provided
mean). This rather crude sensitivity analysis shows the the French economy calculations. They also contributed to the
importance of underlying methodological assumptions. tri-national synthesis. Paul Filliger led the air pollution exposure
Last but not least, in case of morbidity outcomes, modelling for Switzerland. Max Herry devised the common methods of
the economic valuation and provided data and results for the Austrian
estimates of the health outcome frequency have direct economic assessment and the tri-national synthesis. Valérie
effects on the impact estimates. For example, we used Puybonnieux-Texier helped calculate the French exposure distribution
the incidence of chronic bronchitis from a population estimates. Philippe Quénel made major contributions to the
development of the epidemiological methods. Juergen Schneider did the
where smoking is rare, assuming a 50% higher outcome modelling and estimation of the population exposure distribution of the
frequency would result in a 50% larger estimate of the Austrian population. Rita Seethaler was the project coordinator, and
attributable cases. participated in the economic research on external cost modelling.
In light of the uncertainties, one could argue that we Heini Sommer did the final economic calculations and was the project
leader.
should abstain from such impact assessment. We
disagree. First, there is abundant evidence that current Acknowledgments
N Künzli is a recipient of a National Science Foundation Advanced
levels of air pollution have adverse health effects, thus Scientist Fellowship (3233-048922.96/1). The project has been co-
the impact cannot be zero.26 From a public-health funded by the Austrian Federal Ministry for Environment, Youth and
perspective it is therefore an ethical consequence to Family Affairs, coordinated with the Austrian Federal Ministries for
Labour, Health and Social Affairs and for Science and Transport and
estimate and communicate the impact to the public. the Austrian Medical Association; the Federal Environment Agency of
Second, societies have to make important decisions at Austria; the Agency for Environment and Energy Management
the time. To abstain from impact assessment, given the ADEME, Air and Transport Direction, France; and the Federal
Department of Environment, Transport, Energy and Communications,
many uncertainties, would promote decisions without Switzerland. We thank Bart Ostric, Devra Davis, and Michal
consideration of aspects of public health. This is Kryzanowski for their valuable comments.
800 THE LANCET • Vol 356 • September 2, 2000
For personal use only. Not to be reproduced without permission of The Lancet.
7. ARTICLES
References pollution and chronic respiratory symptoms (SAPALDIA).
1 Wilson R, Spengler J. Particles in our air: concentrations and health Am J Respir Crit Care Med 1999; 159: 1257–66.
effects. Boston: Harvard University Press, 1996. 25 National Resources Defense Council, (NRDC). Breath taking:
premature mortality due to particulate air pollution in 239 American
2 Holgate S, Samet J, Koren H, Maynard R. Air pollution and health.
cities. San Francisco: NRDC, 1996.
San Diego/London: Academic Press, 1999.
26 Bates DV. Lines that connect: assessing the causality inference in the
3 Katsouyanni K, Touloumi G, Spix C. Short-term effects of ambient
case of particulate pollution. Env Health Perspect 2000; 108: 91–92.
sulphur dioxide and particulate matter on mortality in 12 European
cities: results from times series data from the APHEA project. BMJ 27 Samet J, Schnatter R, Gibb H. Invited commentary: epidemiology
1997; 314: 1658–63. and risk assessment. Am J Epidemiol 1998; 148: 929–36.
4 Dockery D, Pope A, Xu X, et al. An association between air 28 Smith K, Corvalan C, Kjellström T. How much global ill health is
pollution and mortality in six US cities. N Engl J Med 1993; 329: attributable to environmental facators? Epidemiology 1999; 10:
1753–59. 573–84.
5 Pope A, Thun M, Namboodiri M, et al. Particulate air pollution as a 29 La D, Hardy R. Potential gains in life expectancy or years of
predictor of mortality in a prospective study of US adults. Am J potential life lost: impact of competing risks of death. Int J Epidemiol
1999; 28: 894–98.
Respir Crit Care Med 1995; 151: 669–74.
30 Zmirou D, Schawartz J, Saez M, et al. Time-series analysis of air
6 Bates D. Health indices of the adverse effects of air pollution: the
pollution and cause-specific mortality. Epidemiology 1998; 9:
question of coherence. Environ Res 1992; 59: 336–49.
495–503.
7 Dora C. A different route to health: implications of transport
31 Wordley J, Walters S, Ayres J. Short term variations in hospital
policies. BMJ 1999; 318: 1686–89.
admissions and mortality and particulate air pollution. Occup Environ
8 Sommer H, Chanel O, Vergnaud JCh, Herry M, Sedlak N, Health 1997; 54: 108–16.
Seethaler R. Monetary valuation of road traffic related air pollution:
32 Prescott GJ, Cohen GR, Elton RA, Fowkes FG, Agium RM. Urban
health costs due to road traffic-related air pollution: an impact
air pollution and cardiopulmonary ill health: a 14·5 year time series
assessment project of Austria, France and Switzerland third WHO
study. Occup Environ Med 1998; 55: 697–704.
Ministerial Conference of Environment & Health. London:
WHO, 1999. 33 Poloniecki J, Atkinson R, Ponce de Leon A, Anderson H. Daily time
series for cardiovascular hospital admissions and previous day’s air
9 Künzli N, Kaiser R, Medina S, Studnicka M, Oberfeld G, pollution in London, UK. Occup Environ Health 1997; 54: 535–40.
Horak F Jr. Health costs due to road traffic-related air pollution: an
34 Medina S, Le Terte A, Dusseux E. Evaluation des Risques de la
impact assessment project of Austria, France and Switzerland. (Air
Pollution Urbaine sur lar Santé (ERPURS). Analyse des liens à court
pollution attributable cases. Technical report on epidemiology.)
terme entre pollution atmoshérique et santé: resultats 1991–95.
Switzerland: Federal Department for Environment, Energy and
Paris: Conseil Regional d’lle de France, 1997.
Communications Bureau for Transport Studies, 1999.
35 Abbey D, Petersen F, Mills P, Beeson W. Long-term ambient
10 Filliger P, Puybonnieux-Texier V, Schneider J. PM10 population
concentrations of total suspended particulates, ozone, and sulfur
exposure technical report on air pollution: health costs due to road
dioxide and respiratory symptoms in a nonsmoking population. Arch
traffic-related air pollution: an impact assessment project of Austria,
Environ Health 1993; 48: 33–46.
France and Switzerland. London: WHO, 1999.
36 Dockery D, Speizer F, Stram D, Ware J, Spengler J, Ferris BJ.
11 Ostro B, Sanchez J, Aranda C, Eskeland G. Air pollution and
Effects of inhalable particles on respiratory health of children. Am
mortality: results from a study of Santiago, Chile. J Exp Anal Environ Rev Respir Dis 1989; 139: 587–94.
Epidemiol 1996; 6: 97–114.
37 Dockery D, Cunningham J, Damokosh A, et al. Health Effects of
12 Künzli N, Tager I. The semi-individual study in air pollution acid aerosols on north American Children: respiratory symptoms.
epidemiology: a valid design as compared to ecologic studies. Env Health Perspect 1996; 104: 500–05.
Environ Health Perspect 1997; 105: 1078–83.
38 Braun-Fahrländer C, Vuille J, Sennhauser F, et al. Respiratory
13 Abbey D, Hwang B, Burchette R. Estimated long-term ambient health and long-term exposure to air pollutants in Swiss
concentrations of PM10 and development of respiratory symptoms in Schoolchildren. Am J Respir Crit Care Med 1997; 155: 1042–49.
a nonsmoking population. Arch Environ Health 1995; 50: 139–52.
39 Studnicka M, Hackl E, Pischinger J. Traffic-related NO2 and the
14 Ostro B, Chesnut L. Assessing the health benefits of reducing prevalence of asthma and respiratory symptoms in seven year olds.
particulate matter air pollution in the United States. Environ Res Eur Respir J 1997; 10: 2257–58.
1998; 76: 94–106. 40 Oberfeld G, König Ch. Erste Salzburger Kindergesund-
15 National Research Council. Research priorities for airborne heiltsuntersuchung, Hrsg 96. Salzburg, Amt der Salzburger
particulate matter II: evaluating research progress and updating the Landesregierung, 1996.
portfolio. Washington DC: National Academy Press, 1999. 41 Ostro B. Associations between morbidity and alternative measures of
16 Department of Health Ad-hoc group. Economic appraisal of the particulate matter. Risk Analysis 1990; 10: 421–27.
health effects of air pollution. London: HM Stationery Office, 1999. 42 Roemer W, Hoek G, Brunekreef B. Effect of ambient winter air
17 American Lung Association. Dollars and cents: the economic and pollution on respiratory health of children with chronic respiratory
health benefits of potential particulate reductions in the United symptoms. Am Rev Respir Dis 1993; 147: 118–24.
States. New York: American Lung Association, 1998. 43 Ségala C, Fauroux B, Just J. Short-term effect of winter air pollution
18 Brunekreef B. Air pollution kills babies. Epidemiology 1999; 10: on respiratory health of asthmatic children in Paris. Eur Respir J
661–62. 1998; 11: 677–85.
19 McMichael A, Anderson H, Brunekreef B, Cohen A. Inappropriate 44 Gielen M, van der Zee S, van Wijnen J. Acute effects of summer air
use of daily mortality analyses to estimate longer-term mortality pollution on respiratory health of asthmatic children. Am J Respir
effects of air pollution. Int J Epidemiol 1998; 27: 450–53. Crit Care Med 1997; 155: 2105–08.
20 Abbey D, Nishino N, McDonnel W, et al. Long-term inhalable 45 Eder W, Gamper A, Oberfeld G, Riedler J. Prävalenz und
particles and other air pollutants related to mortality in nonsmokers. Schweregrad von Asthma bronchiale, allergischer Rhinitis und
Am J Respir Crit Care Med 1999; 159: 373–82. atopischer Dermatitis bei Salzburger Schulkindern. Wien Klin
21 Baldi I, Roussillon C, Filleul L, et al. Effect of air pollution on long- Wochenschr 1998; 110: 669–77.
term mortality: description of mortality rates in relation to pollutants 46 Haidinger G, Waldhör T, Süss G, Vutuc Ch. Schlu bericht der
levels in the French PAARC Study. Eur Respir J 1999; 24 (suppl 30): ISAAC-Studie Oberösterreich 1995–97. Wien: Linz, 1998.
S392. 47 Dusseldorp A, Kruize H, Brunekreef B. Associations of PM10 and
22 Sommer H, Künzli, N, Seethaler R, et al. Health costs due to Road airborne iron with respiratory health of adults living near a steel
Traffic-related Air Pollution: an impact assessment project of factory. Am J Respir Crit Care Med 1995; 152: 1032–39.
Austria, France and Switzerland. New York: OECD-Report 48 Hiltermann T, Stolk J, van der Zee S. Asthma severity and
(in press). susceptibility to air pollution. Eur Respir J 1998; 11: 686–93.
23 Annual Statistics Report for Switzerland (Statistisches Jahrbuch). 49 Neukirch F, Ségala C, Le Moullec Y. Short-term effects of low-level
Zürich: Verlag Nene Zürcher (NZZ) 1998. winter pollution on respiratory health of asthmatic adults. Arch
24 Zemp E, Elsasser S, Schindler C, et al. Long-term ambient air Environ Health 1998; 53: 320–28.
THE LANCET • Vol 356 • September 2, 2000 801
For personal use only. Not to be reproduced without permission of The Lancet.