Call Girls Hongasandra Just Call 👗 7737669865 👗 Top Class Call Girl Service B...
Mercato auto Europa 2012
1. PRESS EMBARGO : 8.00am (7.00am GMT), January 16, 2013
January 16, 2013
New Passenger Car Registrations
European Union
E U i
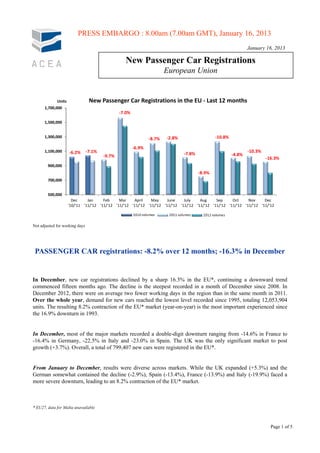
Units New Passenger Car Registrations in the EU ‐ Last 12 months
1,700,000
‐7.0%
1,500,000
1 500 000
1,300,000 ‐8.7% ‐2.8% ‐10.8%
‐6.9%
1,100,000 ‐6.2% ‐7.1% ‐10.3%
‐9.7% ‐7.8% ‐4.8%
‐16.3%
900,000
8.9%
‐8.9%
700,000
500,000
Dec Jan Feb Mar April May June July Aug Sep Oct Nov Dec
'10/'11 '11/'12 '11/'12 '11/'12 '11/'12 '11/'12 '11/'12 '11/'12 '11/'12 '11/'12 '11/'12 '11/'12 '11/'12
Series1 Series2
Not adjusted for working days
PASSENGER CAR registrations: -8.2% over 12 months; -16.3% in December
In December ne car registrations declined b a sharp 16 3% in the EU* contin ing a do n ard trend
December, new by 16.3% EU*, continuing downward
commenced fifteen months ago. The decline is the steepest recorded in a month of December since 2008. In
December 2012, there were on average two fewer working days in the region than in the same month in 2011.
Over the whole year, demand for new cars reached the lowest level recorded since 1995, totaling 12,053,904
units. The resulting 8.2% contraction of the EU* market (year-on-year) is the most important experienced since
the 16.9% downturn in 1993.
In December, most of the major markets recorded a double-digit downturn ranging from -14.6% in France to
-16.4% in Germany, -22.5% in Italy and -23.0% in Spain. The UK was the only significant market to post
growth (+3.7%). Overall, a total of 799,407 new cars were registered in the EU*.
From January to December, results were diverse across markets. While the UK expanded (+5.3%) and the
German somewhat contained the decline (-2.9%), Spain (-13.4%), France (-13.9%) and Italy (-19.9%) faced a
more severe downturn, leading to an 8.2% contraction of the EU* market.
, g
* EU27, data for Malta unavailable
Page 1 of 5
2. P r e s s R e l e a s e
Association des PRESS EMBARGO FOR ALL DATA :
Constructeurs 8.00 A.M.(7.00 A.M GMT), January 16, 2013
Européens
d'Automobiles
PROVISIONAL
Av. des Nerviens 85 NEW PASSENGER CAR REGISTRATIONS BY MARKET
B-1040 Bruxelles EUROPEAN UNION*
Tel (32 2) 732 55 50
Fax (32 2) 738 73 10
(32 2) 738 73 11
16/1/13
December December % Chg Jan - Dec Jan - Dec % Chg
'12 '11 12/11 '12 '11 12/11
AUSTRIA 18,421 23,358 -21.1 336,010 356,145 -5.7
BELGIUM 22,324 48,763 -54.2 486,737 572,211 -14.9
BULGARIA 1,985 1,209 +64.2 19,419 19,122 +1.6
CYPRUS 570 1,175 -51.5 10,967 14,544 -24.6
CZECH REPUBLIC 12,784 15,019 -14.9 174,009 173,282 +0.4
DENMARK 10,707 15,355 -30.3 170,763 170,036 +0.4
ESTONIA 1,041 1,156 -9.9 17,267 15,350 +12.5
FINLAND 6,410 6,891 -7.0 111,251 126,130 -11.8
FRANCE 160,314 187,817 -14.6 1,898,760 2,204,229 -13.9
GERMANY 204,331 244,501 -16.4 3,082,504 3,173,634 -2.9
GREECE 3,669 5,538 -33.7 58,482 97,682 -40.1
HUNGARY 5,048 3,262 +54.8 53,059 45,109 +17.6
IRELAND 316 371 -14.8 79,498 89,878 -11.5
ITALY 86,735 111,928 -22.5 1,402,089 1,749,739 -19.9
LATVIA 796 1,060 -24.9 10,665 10,980 -2.9
LITHUANIA 842 1,033 -18.5 12,170 13,223 -8.0
LUXEMBURG 3,072 2,642 16.3
+16.3 50,398 49,881 1.0
+1.0
NETHERLANDS 18,306 17,244 +6.2 502,528 555,843 -9.6
POLAND 21,141 27,324 -22.6 273,589 277,427 -1.4
PORTUGAL 6,342 11,248 -43.6 95,290 153,404 -37.9
ROMANIA 4,828 7,721 -37.5 66,436 81,709 -18.7
SLOVAKIA 5,074 6,595 -23.1 69,268 68,203 +1.6
SLOVENIA 2,489 3,280 -24.1 48,648 58,417 -16.7
SPAIN 51,197 66,457 -23.0 699,589 808,051 -13.4
SWEDEN 27,108 25,402 +6.7 279,899 304,984 -8.2
UNITED KINGDOM 123,557 119,188 +3.7 2,044,609 1,941,253 +5.3
EUROPEAN UNION (EU27)* 799,407 955,537 -16.3 12,053,904 13,130,466 -8.2
EU15 742,809 886,703 -16.2 11,298,407 12,353,100 -8.5
EU11* 56,598 68,834 -17.8 755,497 777,366 -2.8
ICELAND 544 272 +100.0 7,902 5,054 +56.4
NORWAY 9,369 11,550 -18.9 137,967 138,345 -0.3
SWITZERLAND 29,108 30,483 -4.5 328,139 318,958 +2.9
EFTA 39,021 42,305 -7.8 474,008 462,357 +2.5
EU27*+EFTA 838,428 997,842 -16.0 12,527,912 13,592,823 -7.8
EU15+EFTA 781,830 929,008 -15.8 11,772,415 12,815,457 -8.1
(*) data for Malta currently not available.
For further information, please contact: Ms. Quynh-Nhu Huynh - Director Economics & Statistics - E-mail: qh@acea.be - Tel. (32) 2 738 73 55
New Passenger Car Registrations in December
Units Results in the EU 2003 ‐ 2012 Percentage
1,200,000 +20.0
+16.6
+15.0
1,000,000
+10.0
800,000 +3.4
+5.5 +5.0
+1.6
600,000 ‐2.3 +0.0
‐3.8 ‐5.0
400,000 ‐6.2
‐10.0
200,000
‐15.0
‐16.3
‐18.1
0 ‐20.0
Dec‐03 Dec‐04 Dec‐05 Dec‐06 Dec‐07 Dec‐08 Dec‐09 Dec‐10 Dec‐11 Dec‐12
New Passenger Car Registrations % change year‐on‐year
Next press release: Tuesday, February 19, 2013
This information is available on the ACEA website: http://www.acea.be Page 2 of 5
3. P r e s s R e l e a s e
PROVISIONAL
NEW PASSENGER CAR REGISTRATIONS BY MANUFACTURER
EUROPEAN UNION (EU)*
16/1/13
December January - December
%Share Units Units % Chg %Share Units Units % Chg
'12 '11 '12 '11 12/11 '12 '11 '12 '11 12/11
ALL BRANDS** 799,407 955,537 -16.3 12,053,904 13,130,466 -8.2
VW Group 23.3 23.3 186,347 222,492 -16.2 24.7 23.0 2,977,416 3,026,192 -1.6
VOLKSWAGEN 11.7 12.6 93,309 120,021 -22.3 12.8 12.3 1,541,643 1,616,483 -4.6
AUDI 4.7 4.8 37,247 45,964 -19.0 5.6 5.0 673,647 653,427 +3.1
SEAT 2.3 2.3 18,637 21,994 -15.3 2.1 2.3 251,528 296,145 -15.1
SKODA 4.2 3.6 33,811 34,388 -1.7 3.9 3.5 465,341 458,209 +1.6
Others (1) 0.4 0.0 3,343 125 +2574.4 0.4 0.0 45,257 1,928 +2247.4
PSA Group 11.2 11.5 89,710 109,666 -18.2 11.9 12.5 1,431,063 1,643,457 -12.9
PEUGEOT 6.2 6.1 49,694 58,276 -14.7 6.4 6.8 774,435 889,264 -12.9
CITROEN 5.0 5.4 40,016 51,390 -22.1 5.4 5.7 656,628 754,193 -12.9
RENAULT Group 9.3 9.7 74,652 92,237 -19.1 8.5 9.7 1,030,321 1,273,178 -19.1
RENAULT 6.9 7.7 55,300 73,659 -24.9 6.6 7.8 795,972 1,026,736 -22.5
DACIA 2.4 1.9 19,352 18,578 +4.2 1.9 1.9 234,349 246,442 -4.9
GM Group 7.8 9.0 62,640 86,044 -27.2 8.2 8.7 984,177 1,142,117 -13.8
OPEL/VAUXHALL 6.5 7.4 52,130 70,657 -26.2 6.8 7.4 815,961 968,550 -15.8
CHEVROLET 1.3 1.6 10,500 15,331 -31.5 1.4 1.3 167,917 173,083 -3.0
GM (US) 0.0 0.0 10 56 -82.1 0.0 0.0 299 484 -38.2
FORD 6.6 7.5 52,475 71,884 -27.0 7.6 8.0 910,318 1,048,814 -13.2
FIAT Group 6.2 6.3 49,311 60,010 -17.8 6.5 7.1 779,606 929,551 -16.1
FIAT 4.6 4.5 36,424 42,798 -14.9 4.7 5.1 570,980 673,401 -15.2
LANCIA/CHRYSLER 0.7 0.8 5,529 7,227 -23.5 0.8 0.8 92,446 102,122 -9.5
ALFA ROMEO 0.6 0.8 4,984 7,713 -35.4 0.7 1.0 86,858 125,924 -31.0
JEEP 0.3 0.2 2,204 1,988 +10.9 0.2 0.2 25,673 22,211 +15.6
Others (2) 0.0 0.0 170 284 -40.1 0.0 0.0 3,649 5,893 -38.1
BMW Group 7.9 6.6 63,171 62,993 +0.3 6.4 5.9 767,541 781,248 -1.8
BMW 6.4 5.1 50,810 49,033 +3.6 5.1 4.7 614,779 618,029 -0.5
MINI 1.5 1.5 12,361 13,960 -11.5 1.3 1.2 152,762 163,219 -6.4
DAIMLER 5.8 5.3 46,519 50,965 -8.7 5.3 5.0 633,142 652,790 -3.0
MERCEDES 5.4 4.8 42,893 45,915 -6.6 4.7 4.4 565,161 575,243 -1.8
SMART 0.5 0.5 3,626 5,050 -28.2 0.6 0.6 67,981 77,547 -12.3
TOYOTA Group 4.5 4.8 36,051 45,965 -21.6 4.2 4.0 507,731 523,909 -3.1
TOYOTA 4.4 4.6 34,985 43,704 -20.0 4.0 3.8 483,131 498,384 -3.1
LEXUS 0.1 0.2 1,066 2,261 -52.9 0.2 0.2 24,600 25,525 -3.6
NISSAN 3.4 3.3 26,999 31,104 -13.2 3.5 3.4 417,636 445,826 -6.3
HYUNDAI 4.2 3.2 33,337 30,177 +10.5 3.4 2.9 414,827 379,144 +9.4
KIA 3.0 2.3 23,702 22,195 +6.8 2.7 2.2 327,995 287,388 +14.1
VOLVO CAR CORP. 2.2 1.8 17,565 17,109 +2.7 1.8 1.8 212,578 235,841 -9.9
SUZUKI 1.1 1.3 8,543 12,325 -30.7 1.2 1.3 144,292 167,071 -13.6
HONDA 1.1 1.0 9,029 9,630 -6.2 1.1 1.1 133,462 142,436 -6.3
JAGUAR LAND ROVER 1.1 0.9 8,912 8,327 +7.0 1.0 0.7 120,033 95,420 +25.8
LAND ROVER 0.9 0.7 7,023 6,637 +5.8 0.8 0.6 96,847 72,793 +33.0
JAGUAR 0.2 0.2 1,889 1,690 +11.8 0.2 0.2 23,186 22,627 +2.5
MAZDA 1.0 0.8 7,695 7,253 +6.1 0.9 1.0 114,208 128,721 -11.3
MITSUBISHI 0.6 0.6 4,643 6,191 -25.0 0.6 0.8 67,888 101,337 -33.0
OTHER** -0.2 0.9 -1,894 8,970 -121.1 0.7 1.0 79,669 126,026 -36.8
(1) VW Group: VW 'other' include Bentley, Bugatti, Lamborghini, and since Aug '12 Porsche For further information, please contact:
(2) FIAT Group: FIAT 'other' include Dodge, Ferrari, Maserati Ms. Quynh-Nhu Huynh - Director Economics & Statistics
(*) data for Malta n.a. E-mail: qh@acea.be - Tel. (32) 2 738 73 55
(**) ACEA estimates
Page 3 of 5