
Empfohlen
Empfohlen
Weitere ähnliche Inhalte
Was ist angesagt?
Was ist angesagt? (20)
Ähnlich wie Austin Real Estate Market Report May 2013
Ähnlich wie Austin Real Estate Market Report May 2013 (20)
Kürzlich hochgeladen
Kürzlich hochgeladen (20)
Austin Real Estate Market Report May 2013
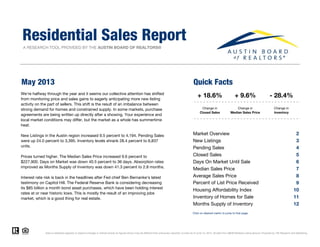
- 1. A RESEARCH TOOL PROVIDED BY THE AUSTIN BOARD OF REALTORS® May 2013 Quick Facts Market Overview 2 New Listings 3 Pending Sales 4 Closed Sales 5 Days On Market Until Sale 6 Median Sales Price 7 Average Sales Price 8 9 Housing Affordability Index 10 Inventory of Homes for Sale 11 Months Supply of Inventory 12 Residential Sales Report Data is refreshed regularly to capture changes in market activity so figures shown may be different than previously reported. Current as of June 10, 2013. All data from ABOR Multiple Listing Service. Powered by 10K Research and Marketing. + 9.6% Change in Median Sales Price Click on desired metric to jump to that page. We're halfway through the year and it seems our collective attention has shifted from monitoring price and sales gains to eagerly anticipating more new listing activity on the part of sellers. This shift is the result of an imbalance between strong demand for homes and constrained supply. In some markets, purchase agreements are being written up directly after a showing. Your experience and local market conditions may differ, but the market as a whole has summertime heat. New Listings in the Austin region increased 9.5 percent to 4,194. Pending Sales were up 24.0 percent to 3,395. Inventory levels shrank 28.4 percent to 6,837 units. Prices turned higher. The Median Sales Price increased 9.6 percent to $227,900. Days on Market was down 40.5 percent to 36 days. Absorption rates improved as Months Supply of Inventory was down 41.3 percent to 2.8 months. Interest rate risk is back in the headlines after Fed chief Ben Bernanke's latest testimony on Capitol Hill. The Federal Reserve Bank is considering decreasing its $85 billion a month bond asset purchases, which have been holding interest rates at or near historic lows. This is mostly the result of an improving jobs market, which is a good thing for real estate. - 28.4% Change in Inventory + 18.6% Change in Closed Sales Percent of List Price Received
- 2. Market Overview Key market metrics for the current month and year-to-date. Key Metrics Historical Sparklines 5-2012 5-2013 + / – YTD 2012 YTD 2013 + / – 11,616 + 22.0% 172 9,546 61 36 169 - 5.7% -- $255,679 $282,452 + 10.5% $208,000 $227,900 $296,456 + 10.5% 95.9% 98.7% Housing Affordability Index Days on Market Until Sale Median Sales Price Average Sales Price Percent of Original List Price Received $268,216 2,641 3,132 + 18.6% 9,521 New Listings Pending Sales Closed Sales + 4.7% 2,738 3,395 + 24.0% 11,585 14,227 + 22.8% 17,5433,830 4,194 + 9.5% 16,751 + 9.6% $198,000 $216,300 + 2.4% - 40.5% 72 52 - 27.9% + 9.2% + 2.9% 94.9% 97.2% All data comes from the ABOR Multiple Listing Service. Provided by the Austin Board of REALTORS®. Powered by 10K Research and Marketing. | Click for Cover Page | 2 4.8 162 - 6.0% - 28.4% - 41.3% 6,837 2.8 179 -- -- -- -- -- Months Supply of Homes for Sale Inventory of Homes for Sale 5-2010 5-2011 5-2012 5-2013 5-2010 5-2011 5-2012 5-2013 5-2010 5-2011 5-2012 5-2013 5-2010 5-2011 5-2012 5-2013 5-2010 5-2011 5-2012 5-2013 5-2010 5-2011 5-2012 5-2013 5-2010 5-2011 5-2012 5-2013 5-2010 5-2011 5-2012 5-2013 5-2010 5-2011 5-2012 5-2013 5-2010 5-2011 5-2012 5-2013
- 3. New Listings A count of the properties that have been newly listed on the market in a given month. Month Prior Year Current Year + / – June 3,551 3,753 +5.7% July 3,164 3,291 +4.0% August 2,702 3,086 +14.2% September 2,484 2,454 -1.2% October 2,483 2,537 +2.2% November 2,052 2,226 +8.5% December 1,585 1,569 -1.0% January 2,593 2,603 +0.4% February 2,892 2,967 +2.6% March 3,741 3,738 -0.1% April 3,695 4,041 +9.4% May 3,830 4,194 +9.5% 12-Month Avg 2,898 3,038 +4.9% All data comes from the ABOR Multiple Listing Service. Provided by the Austin Board of REALTORS®. Powered by 10K Research and Marketing. | Click for Cover Page | 3 3,544 3,830 4,194 2011 2012 2013 May 1,000 1,500 2,000 2,500 3,000 3,500 4,000 4,500 5,000 5,500 1-2004 1-2005 1-2006 1-2007 1-2008 1-2009 1-2010 1-2011 1-2012 1-2013 Historical New Listing Activity 16,725 16,751 17,543 2011 2012 2013 Year To Date +4.7%+8.1% +9.5% +0.2%
- 4. Pending Sales A count of the properties on which contracts have been accepted in a given month. Month Prior Year Current Year + / – June 2,187 2,592 +18.5% July 2,102 2,447 +16.4% August 1,860 2,331 +25.3% September 1,695 1,966 +16.0% October 1,633 2,036 +24.7% November 1,463 1,821 +24.5% December 1,265 1,620 +28.1% January 1,701 2,161 +27.0% February 2,017 2,409 +19.4% March 2,488 2,972 +19.5% April 2,641 3,290 +24.6% May 2,738 3,395 +24.0% 12-Month Avg 1,983 2,420 +22.1% All data comes from the ABOR Multiple Listing Service. Provided by the Austin Board of REALTORS®. Powered by 10K Research and Marketing. | Click for Cover Page | 4 2,253 2,738 3,395 2011 2012 2013 May 1,000 1,500 2,000 2,500 3,000 3,500 1-2004 1-2005 1-2006 1-2007 1-2008 1-2009 1-2010 1-2011 1-2012 1-2013 Historical Pending Sales Activity 9,421 11,585 14,227 2011 2012 2013 Year To Date +22.8%+21.5% +24.0% +23.0%
- 5. Closed Sales A count of the actual sales that have closed in a given month. Month Prior Year Current Year + / – June 2,356 2,872 +21.9% July 2,182 2,624 +20.3% August 2,226 2,674 +20.1% September 1,823 2,019 +10.8% October 1,603 2,207 +37.7% November 1,499 1,843 +22.9% December 1,737 2,039 +17.4% January 1,198 1,583 +32.1% February 1,433 1,811 +26.4% March 2,104 2,397 +13.9% April 2,145 2,693 +25.5% May 2,641 3,132 +18.6% 12-Month Avg 1,912 2,325 +22.3% All data comes from the ABOR Multiple Listing Service. Provided by the Austin Board of REALTORS®. Powered by 10K Research and Marketing. | Click for Cover Page | 5 2,081 2,641 3,132 2011 2012 2013 May 500 1,000 1,500 2,000 2,500 3,000 3,500 1-2004 1-2005 1-2006 1-2007 1-2008 1-2009 1-2010 1-2011 1-2012 1-2013 Historical Closed Sales Activity 8,007 9,521 11,616 2011 2012 2013 Year To Date +22.0%+26.9% +18.6% +18.9%
- 6. Days on Market Until Sale Average number of days between when a property is listed and when an offer is accepted in a given month. Month Prior Year Current Year + / – June 72 55 -24.0% July 74 58 -21.7% August 77 58 -24.9% September 78 61 -22.0% October 80 64 -20.9% November 80 63 -21.1% December 84 66 -20.7% January 83 66 -20.4% February 82 65 -20.7% March 79 59 -25.3% April 65 46 -29.4% May 61 36 -40.5% 12-Month Avg 75 57 -24.5% All data comes from the ABOR Multiple Listing Service. Provided by the Austin Board of REALTORS®. Powered by 10K Research and Marketing. | Click for Cover Page | 6 76 61 36 2011 2012 2013 May 30 40 50 60 70 80 90 100 1-2004 1-2005 1-2006 1-2007 1-2008 1-2009 1-2010 1-2011 1-2012 1-2013 Historical Days on Market Until Sale 85 72 52 2011 2012 2013 Year To Date -27.9%-19.8% -40.5% -15.4%
- 7. Median Sales Price Median price point for all closed sales, not accounting for seller concessions, in a given month. Month Prior Year Current Year + / – June $198,000 $214,000 +8.1% July $190,000 $210,000 +10.5% August $191,500 $204,000 +6.5% September $185,000 $195,000 +5.4% October $187,785 $195,000 +3.8% November $184,000 $197,000 +7.1% December $187,000 $207,500 +11.0% January $176,600 $196,000 +11.0% February $190,000 $203,000 +6.8% March $197,000 $215,000 +9.1% April $205,000 $224,900 +9.7% May $208,000 $227,900 +9.6% 12-Mo. Median $192,500 $209,990 +9.1% All data comes from the ABOR Multiple Listing Service. Provided by the Austin Board of REALTORS®. Powered by 10K Research and Marketing. | Click for Cover Page | 7 $192,000 $208,000 $227,900 2011 2012 2013 May $140,000 $150,000 $160,000 $170,000 $180,000 $190,000 $200,000 $210,000 $220,000 $230,000 $240,000 1-2004 1-2005 1-2006 1-2007 1-2008 1-2009 1-2010 1-2011 1-2012 1-2013 Historical Median Sales Price $187,000 $198,000 $216,300 2011 2012 2013 Year To Date +9.2%+8.3% +9.6% +5.9%
- 8. Average Sales Price Average sales price for all closed sales, not accounting for seller concessions, in a given month. Month Prior Year Current Year + / – June $262,654 $276,759 +5.4% July $255,611 $275,200 +7.7% August $250,351 $266,532 +6.5% September $244,565 $257,008 +5.1% October $247,299 $267,060 +8.0% November $242,489 $264,018 +8.9% December $242,435 $276,987 +14.3% January $223,971 $254,893 +13.8% February $248,248 $258,852 +4.3% March $255,021 $276,032 +8.2% April $263,545 $303,945 +15.3% May $268,216 $296,456 +10.5% 12-Month Avg $252,540 $274,980 +8.9% All data comes from the ABOR Multiple Listing Service. Provided by the Austin Board of REALTORS®. Powered by 10K Research and Marketing. | Click for Cover Page | 8 $259,972 $268,216 $296,456 2011 2012 2013 May $180,000 $200,000 $220,000 $240,000 $260,000 $280,000 $300,000 $320,000 1-2004 1-2005 1-2006 1-2007 1-2008 1-2009 1-2010 1-2011 1-2012 1-2013 Historical Average Sales Price $250,106 $255,679 $282,452 2011 2012 2013 Year To Date + 10.5%+ 3.2% + 10.5% + 2.2%
- 9. Percent of Original List Price Received Month Prior Year Current Year + / – June 93.9% 96.3% +2.5% July 93.6% 96.0% +2.6% August 93.3% 95.7% +2.5% September 93.0% 95.2% +2.4% October 93.3% 95.2% +2.0% November 93.1% 94.9% +1.9% December 92.9% 95.2% +2.5% January 93.1% 95.3% +2.4% February 93.6% 96.1% +2.6% March 94.7% 96.6% +2.0% April 95.7% 97.9% +2.3% May 95.9% 98.7% +2.9% 12-Month Avg 94.0% 96.3% +2.4% All data comes from the ABOR Multiple Listing Service. Provided by the Austin Board of REALTORS®. Powered by 10K Research and Marketing. | Click for Cover Page | 9 Percentage found when dividing a property’s sales price by its original list price, then taking the average for all properties sold in a given month, not accounting for seller concessions. 93.6% 95.9% 98.7% 2011 2012 2013 May 91% 92% 93% 94% 95% 96% 97% 98% 99% 1-2004 1-2005 1-2006 1-2007 1-2008 1-2009 1-2010 1-2011 1-2012 1-2013 Historical Percent of Original List Price Received 93.0% 94.9% 97.2% 2011 2012 2013 Year To Date +2.4%+2.5% +2.9% +2.0%
- 10. Housing Affordability Index Month Prior Year Current Year + / – June 165 169 +2.4% July 170 174 +2.0% August 174 177 +2.0% September 181 187 +3.3% October 177 186 +4.9% November 182 185 +1.9% December 180 179 -0.3% January 192 191 -0.2% February 182 182 -0.2% March 175 173 -1.2% April 172 169 -1.5% May 172 162 -6.0% 12-Month Avg 177 178 +0.6% This index measures housing affordability for the region. An index of 120 means the median household income was 120% of what is necessary to qualify for the median-priced home under prevailing interest rates. A higher number means greater affordability. All data comes from the ABOR Multiple Listing Service. Provided by the Austin Board of REALTORS®. Powered by 10K Research and Marketing. | Click for Cover Page | 10 168 172 162 2011 2012 2013 May 120 130 140 150 160 170 180 190 200 1-2004 1-2005 1-2006 1-2007 1-2008 1-2009 1-2010 1-2011 1-2012 1-2013 Historical Housing Affordability Index 171 179 169 2011 2012 2013 Year To Date -5.7%+2.7% -6.0% +4.7%
- 11. Inventory of Homes for Sale The number of properties available for sale in active status at the end of a given month. Month Prior Year Current Year + / – June 12,170 9,847 -19.1% July 11,926 9,811 -17.7% August 11,288 9,448 -16.3% September 10,583 8,898 -15.9% October 10,102 8,311 -17.7% November 9,439 7,764 -17.7% December 8,325 6,644 -20.2% January 8,324 6,408 -23.0% February 8,500 6,453 -24.1% March 8,982 6,653 -25.9% April 9,313 6,815 -26.8% May 9,546 6,837 -28.4% 12-Month Avg 9,875 7,824 -21.1% All data comes from the ABOR Multiple Listing Service. Provided by the Austin Board of REALTORS®. Powered by 10K Research and Marketing. | Click for Cover Page | 11 12,089 9,546 6,837 2011 2012 2013 May 5,000 6,000 7,000 8,000 9,000 10,000 11,000 12,000 13,000 14,000 15,000 1-2004 1-2005 1-2006 1-2007 1-2008 1-2009 1-2010 1-2011 1-2012 1-2013 Historical Inventory of Homes for Sale -28.4%+2.7%
- 12. Months Supply of Inventory The inventory of homes for sale at the end of a given month, divided by the average monthly pending sales from the last 12 months. Month Prior Year Current Year + / – June 7.3 4.9 -33.0% July 7.0 4.8 -31.2% August 6.5 4.5 -30.2% September 6.0 4.2 -29.7% October 5.7 3.9 -31.6% November 5.3 3.6 -32.0% December 4.6 3.0 -34.6% January 4.6 2.9 -37.3% February 4.6 2.8 -37.8% March 4.7 2.9 -39.2% April 4.8 2.9 -39.9% May 4.8 2.8 -41.3% 12-Month Avg 5.5 3.6 -34.3% All data comes from the ABOR Multiple Listing Service. Provided by the Austin Board of REALTORS®. Powered by 10K Research and Marketing. | Click for Cover Page | 12 7.4 4.8 2.8 2011 2012 2013 May 2 3 4 5 6 7 8 9 1-2004 1-2005 1-2006 1-2007 1-2008 1-2009 1-2010 1-2011 1-2012 1-2013 Historical Months Supply of Inventory -41.3%-35.2%