SlideShare ist ein Scribd-Unternehmen logo
1 von 8
Downloaden Sie, um offline zu lesen
technology focus: streamer


Australian Insights into
Streamer Technology Innovations
Andrew Long, Petroleum Geo-Services, andrew.long@pgs.com


                                                             of conventional streamers with the loss of                   been a forced trade-off between towing
Introduction
                                                             mid and high frequency amplitudes, dual-                     shallow to record high frequency (but noisy)


T
        he evolution of towed seismic                        sensor data processing perfectly recovers all                data at the cost of reduced lower frequencies,
        streamers has progressed from the                    frequencies without penalty.                                 or towing deep to record low frequencies at the
        development of fluid-filled to solid-                                                                             cost of reduced higher frequencies.
filled streamers, and from sensors that only                 A pressure sensor in a towed streamer always
record the scalar pressure field to combined                 records two wavefields that interfere with each              It has long been understood that by recording
pressure and particle velocity sensors within                other. The two wavefields are the up-going                   seismic data from collocated hydrophones and
the streamer. For many years the primary                     pressure wavefield propagating directly to the               velocity sensors, and by properly combining
focus of streamer development was upon                       pressure sensor from the earth below, and the                their signals, ghost reflections can be cancelled.
reducing weather, swell and operational                      down-going pressure wavefield reflected with                 The technology described here uses an
noise effects recorded within the seismic                    opposite polarity downwards from the free                    efficient architecture with densely sampled
data. Unfortunately, fundamental physics                     (sea) surface immediately above the streamer.                groups of collocated pressure and velocity
related to “ghost” notches in the recorded                   Thus, every recorded reflection wavelet from                 sensors in a low-noise solid-fill streamer with
amplitude spectra restricted typical towing                  conventional marine streamers is accompanied                 distributed electronics and Ethernet telemetry
depths to 5–9 m. Recent developments                         by a ‘ghost’ reflection from the ocean’s surface.            (Tenghamn et al., 2007). In contrast to pressure
with dual-sensor streamer technology,                        The combination we traditionally measure is                  sensors, velocity sensors are directional, so the
however, have allowed this restriction to                    thus the ‘total pressure’ wavefield. The reflection          down-going velocity wavefield is measured as
be removed. Dual-sensor streamers can                        wavelet is undesirably elongated, reducing                   having equal polarity to the up-going velocity
be towed very deep (15–25 m), providing                      temporal resolution. The consequence, as                     wavefield. Consequently, as observed in the
greater operational flexibility combined with                illustrated in the left side of Figure 1, is that a          right side of Figure 1, receiver ghost notches for
a step-change in data quality and frequency                  series of receiver ghost notches are introduced              the pressure and velocity sensors are separated
content. In contrast to the deep towing                      into the frequency spectra. There has historically           in the frequency domain by regular intervals,


Fig. 1. The image on the left shows the receiver amplitude spectra for a pressure sensor towed at 8 m and 15 m depth. The wavefield is assumed to have vertical
propagation (zero angle of incidence). Black is 8 m receiver depth, and blue is 15 m receiver depth. The image on the right shows the superposition of the amplitude
spectra for both a pressure and velocity sensor at 15 m depth for zero angle reflections. Blue is the pressure wavefield spectra, and red is the velocity wavefield spectra.


34   | PESA News | April/May 2009
technology focus: streamer


but are perfectly offset from each other in
terms of complementary peaks and notches.
Appropriate processing of the measured
pressure and velocity data will completely
cancel the amplitude of the ghost event trailing
each primary event, and the notches in the
amplitude spectra will be removed. This is the
case for all angles of incidence, i.e. for all source-
receiver offsets.


Historical streamer efforts to
remove the receiver ghost
It has been demonstrated that the noise effects
of weather-induced surface waves decrease
significantly when the tow depth is increased
to about 15 m or more. This can be seen in
Figure 2, which compares the levels of recorded
moderate weather surface-wave noise at tow
depths of 7 and 15 m.
                                                         Fig. 2. Weather noise levels at streamer towing depths of 7 and 15 m. The streamer used was towed to passively
                                                         record the ambient background energy without any active source firing. It makes obvious sense to tow deep if
Unfortunately, as demonstrated above, the effect
                                                         the receiver ghost can be removed in processing.
of the receiver ghost has prevented conventional
streamers from being towed any deeper than
about 8 meters. At conventional towing depths            streamer spread being towed shallow. By grossly           project flexibility. Both low and high frequencies
the low frequencies required for robust seismic          relaxing the spatial sampling assumptions, the            are boosted without compromise in fidelity
impedance inversion are absent, operations are           methodology is less sensitive to streamer depth           or accuracy all the way up to the Nyquist
exposed to surface-related weather, sea swell            errors, and the deeper streamers are only used            frequency. Thus, the only constraints upon the
and other hazards that will create unwanted              to contribute very low frequencies to the final           recoverable high frequencies are the effects
noise, and high frequencies required for thin bed        processed result (e.g. 0–20 Hz). Thus, the trade-         of the source ghost and the inescapable
resolution are also often absent.                        off is that mid and higher frequencies retain the         attenuation effects of the earth. The source
                                                         down-going pressure wavefield effects (receiver           ghost is briefly addressed below.
Several historical efforts have been made to             ghosting), and have a signal-to-noise content
combine the frequency spectra of streamers               appropriate to streamers towed closer to the              Spectral enhancement in processing of high
towed simultaneously at different depths;                surface.                                                  frequencies lost to attenuation benefits from
variously referred to as ‘twin streamers’ or                                                                       dual-sensor data acquisition for two main
‘over-under’ towing. In the simplest approaches          Many attempts have been made through the                  reasons:
taken (Monk, 1990), time shifts and/or phase             years to incorporate vertical particle velocity
corrections are used in an effort to align and           detectors into the towed streamer, but their              1. The high frequencies have signal-to-noise
combine data acquired at different depths.               response to vibration noise propagating                      content appropriate to streamers towed very
More recent publications from Posthumus                  along the streamer always overwhelmed their                  deep; and
(1993) and Özdemir et al. (2008) describe                response to the desired seismic reflection                2. The removal of the receiver ghost effects
extensions of these ideas to address residual            signals. PGS eventually made the required                    have already boosted the signal content of
noise from the down-going pressure wavefield,            engineering breakthroughs, and introduced a                  high frequencies relative to conventional
and reduce noise and errors introduced                   commercial solution (the ‘GeoStreamer’) at the               streamer data anyway.
or enhanced via the methodology. On the                  2007 EAGE international technical conference.
operational side it is obviously expensive                                                                         Thus, high frequency amplitudes can be
and challenging to tow half of the available             By having collocated pressure and particle                robustly recovered before noise levels become
streamers at one depth and the other half of             velocity sensors, there are no issues related             unacceptable.
the available streamers at another depth. Each           to streamer depth control and the removal
streamer spread will be exposed to different             of the receiver ghost. In fact, the dual-sensor
                                                                                                                   Field tests and data analyses in
local forces and noise effects. In addition              configuration enables a methodology to
                                                                                                                   Australia: The receiver ghost
to the well-known critical requirements to               accurately identify the streamer depth to
laterally align the shallow and deep streamers,          within 0.2 m on an offset-dependent and                   The test line location
a lesser-known problem is the sensitivity of             shot-dependent basis. Any errors in receiver
the methodology to small errors in streamer              ghost removal are thus identified and removed             A regional 2D streamer seismic survey was
depth. As a consequence of vertical streamer             early in processing. By towing the collocated             acquired in two regionally overlapping phases
separation errors, the up-going pressure data            dual-sensors very deep (typically 25 m) the               over the North West Shelf of Australia during
derived from processing becomes less robust              signal-to-noise content across all frequencies            2007 and 2008 (Figure 3). Water depths vary
at higher frequencies; typically beyond 70 Hz            after removal of the down-going wavefield                 between 50 and 3,500 m. Phase I was acquired
in normal operating conditions. One pragmatic            is high. This increased “insulation” from the             with a 7,950 m fluid-fill streamer at a depth of
solution is to tow a smaller number of coarsely-         effects of bad weather also increases the                 7 m, and Phase II was acquired with a 8,100 m
spaced streamers at larger depths than the               operational weather window and enhances                   solid-fill dual-sensor streamer at a depth of


                                                                                                                                      April/May 2009 | PESA News |    35
technology focus: streamer


                                                                                                                      and offsets. The resultant up-going pressure
                                                                                                                      wavefield is free of the receiver ghost, and has
                                                                                                                      been extrapolated to an equivalent receiver
                                                                                                                      depth of 7 m for comparison with the existing
                                                                                                                      total pressure (hydrophone) data.

                                                                                                                      The power of dual-sensor acquisition and
                                                                                                                      processing is demonstrated here on the
                                                                                                                      North West Shelf (NWS) of Australia. A 156
                                                                                                                      km 2D seismic line in the northern Carnarvon
                                                                                                                      Basin was acquired twice; both in Phase I
                                                                                                                      (conventional streamer) and Phase II (dual-
                                                                                                                      sensor streamer). Thus, a true apples-for-
                                                                                                                      apples comparison was made. The NW-SE line
                                                                                                                      orientation is in the dip direction, and intersects
                                                                                                                      a known gas field associated with a pronounced
                                                                                                                      amplitude anomaly. Water depth exceeds
                                                                                                                      750 m.

                                                                                                                      Challenges to seismic penetration and
                                                                                                                      resolution


                                                                                                                      Much of the North West Shelf is affected
                                                                                                                      by relatively near-surface barriers to deeper
                                                                                                                      target seismic imaging and resolution. Major
                                                                                                                      sequence boundaries in the post-rift section
                                                                                                                      occur in the Turonian (Late Cretaceous)
Fig. 3. 2D survey location on the North West Shelf of Australia. The survey area is about 1000 km long. Two test      and Base Tertiary. Campanian inversion of
lines were acquired in multiple passes to quantify the removal of the receiver and source ghost effects from          transpressional structures was accentuated
streamer data. The line used to quantify receiver ghost removal described here lies in the northern Carnarvon         by regional tectonism in the Neogene, and
Basin; in the southern part of the survey area. The line used to address source ghost attenuation described here      is associated with trap breach in the area.
lies in the central Browse Basin; in the northern part of the survey area.                                            Complex swarm faulting affects the Tertiary
                                                                                                                      section, and requires rich high frequency
15 m. Receiver interval in both phases of the              Typical of the area, processing follows a                  content for high resolution seismic imaging.
survey was 12.5 m. A symmetric 2,980 in3                   cascaded flow, incorporating velocity mute in              Analysis of the dual-sensor data (refer to
source array of Sodera G-guns was towed at                 the tau-p domain, SRME and high-resolution                 Figure 5) shows that brute stack frequencies
a depth of 6 m for both surveys, with a shot               radon demultiple. Pre-stack Kirchhoff time                 beyond the source ghost in the up-going
interval of 37.5 m. Record length was 12 s. Phase          migration used an optimised high-order velocity            pressure wavefield have much stronger
I acquisition and processing was completed                 function to accurately incorporate longer offsets          amplitudes; up to at least 200 Hz. This
in 2007. Phase II (dual-sensor) acquisition and            into imaging. Specialised pre-processing and               particularly benefits thin bed resolution and
processing was completed in 2008. As observed              wavefield separation used for the Phase II dual-           subtle stratigraphic interpretation in the first
in Figure 4, the recorded pressure and particle            sensor data followed the methods described in              second two-way time (TWT) below the water
velocity data yield complementary information              Tenghamn et al. (2007) and Carlson et al. (2007).          bottom. Although no spectral enhancement
about the subsurface, and together in                      The obliquity term is automatically included               processing has been applied to any of the
processing, result in significant data resolution,         during wavefield separation, and amplitudes                figures here, estimation of the quality factor
quality and deep target imaging improvements.              are equally correct for all incidence angles               (Q) is more robust using up-going pressure


Fig. 4. Near-trace gathers for pressure (left) and velocity (right) sensor data from the study area in the northern Carnarvon Basin. The window width is about 75 km, and
the vertical extent is 0.0–4.2 s TWT.


36   | PESA News | April/May 2009
technology focus: streamer


                                                                                                                         data, and linear regressions using the spectral
                                                                                                                         ratio method have good fit down to about 3
                                                                                                                         Hz.

                                                                                                                         Carbonates are mapped in the Mid
                                                                                                                         Cretaceous/Aptian, and are more regionally
                                                                                                                         pervasive in the Late Cretaceous and Late
                                                                                                                         Tertiary, producing complex seismic multiple
                                                                                                                         noise events. The seismic multiple problems
                                                                                                                         become more severe to the north and east of
                                                                                                                         the survey area (towards the southern Browse
                                                                                                                         Basin), creating problems for velocity picking
                                                                                                                         and seismic imaging. Production velocity
                                                                                                                         picking was, however, significantly easier on
                                                                                                                         up-going pressure data, in large part because
                                                                                                                         of the characteristic low frequency boost at
                                                                                                                         all TWT (refer also to Figure 7 and discussion
                                                                                                                         below). A clearer primary semblance trend
Fig. 5. Superimposed amplitude spectra from brute stacks. Red is the up-going pressure data from the
                                                                                                                         is evident during analysis, and associated
dual-sensor streamer used in 2008, and black is the total pressure data from the conventional streamer
                                                                                                                         improvements in later stage velocity analysis
used in 2007. The time window used was 1.5 – 4.0 seconds TWT. Removal of the receiver ghost also benefits
amplitudes at frequencies beyond the source ghost at about 125 Hz. Processing sample rate is 2 ms. Fig. 6                subsequently derive from improved multiple
demonstrates the combined benefits of higher resolution and high signal-to-noise content.                                removal.


Fig. 6. Shallow PSTM comparison of total pressure (conventional streamer: left) vs. up-going pressure (dual-sensor streamer: right) stacks that are spatially coincident. The
window width is about 38 km, and the vertical extent is 1.3–2.7 s TWT. Over this depth range the up-going pressure data are visibly richer in high frequencies, very clean,
and demonstrate enhanced thin bed resolution.


Fig. 7. Stack filter panels for total pressure (conventional streamer: left) vs. up-going pressure (dual-sensor streamer: right). Data stacked at an effective receiver depth
of 7 m in both cases. Frequency ranges are as follows: All, 0-5 Hz, 15-20 Hz, 30-35 Hz, 45-50 Hz, 60-65 Hz, 75-80 Hz, 90-95 Hz, 105-110 Hz, 120-125 Hz and 135-140 Hz.
Frequencies beyond the source ghost (refer to Figure 5) have been truncated for display purposes. Processing sample rate is 2 ms. Note the low frequency contrast in the
second panel.


                                                                                                                                             April/May 2009 | PESA News |       37
technology focus: streamer


Fig. 8. Deep PSTM comparison of total pressure (conventional streamer: left) vs. up-going pressure (dual-sensor streamer: right) stacks that are spatially coincident. The
window width is about 44 km, and the vertical extent is 5.0 – 6.8 s TWT. Over this depth range the up-going pressure data are visibly richer in low frequencies, very clean,
and demonstrate enhanced event continuity, character, and fundamental interpretability.

Although untested as potential hydrocarbon                  underlying Triassic sediments during the Early              considerably easier to pick in poor data areas
plays, the two strongest seismic markers                    Cretaceous, and again later by the regional                 by examination of the up-going pressure
throughout the survey area correspond to                    Campanian inversion. Post-rift fault reactivation           data. Additional low frequency imaging
Top Triassic and Callovian events. These two                is more clearly interpreted to affect internal              benefits were proven in the Browse basin
events can be easily confused with each other               reservoir and trap geometry.                                using a dual-sensor streamer complemented
wherever the Lower Jurassic section thins                                                                               by a source array configured to attenuate the
over Triassic structural highs – typically the              Finally, the Triassic Mungaroo Formation                    source ghost (see below).
top of rotated Triassic fault blocks. Various               is a thick pre-rift section that contains
investigations were made to address potential               dolerite intrusions. Mapping the intrusives                 Quantification of signal and noise
hydrocarbon-related amplitude anomalies at                  is a key to constraining basin evolution;
the top of these Triassic fault blocks. The results         notably areas of basin weakness during the                  It is self-evident that a seismic dataset rich
from a relative impedance inversion study are               main Callovian extensional event. Figures                   in very low frequency content and with high
discussed below.                                            7 and 8 demonstrate the overwhelming                        signal-to-noise ratio across all frequencies and
                                                            improvements in deep target image clarity                   for all two-way time (TWT) provides the best
The largest gas field in the survey area is hosted          and character on up-going pressure data.                    platform for the recovery of elastic rock and
below the Valanginian Unconformity, and was                 The deeper target velocity field is surprisingly            fluid properties in a hydrocarbon-saturated
probably affected by fault block rotation of the            variable throughout the region, and was                     reservoir. High frequencies required for thin bed


Fig. 9. Relative pre-stack P-impedance inversion for conventional (top left) vs. dual-sensor data (top right), and S-impedance inversion for conventional (lower left) vs.
dual-sensor data (lower right). Note the profound improvements in impedance character, low frequency content, and resolution for both dual-sensor results. A large gas
field is evident on the P-impedance sections.


38   | PESA News | April/May 2009
technology focus: streamer


                                                                                                             impedance information. Thus, a bridge is made
                                                                                                             in the historical gap between the seismic
                                                                                                             bandwidth and the low frequency bandwidth
                                                                                                             derived from well log data and the seismic
                                                                                                             velocity model.

                                                                                                             The next stage of this ongoing investigation (at
                                                                                                             the time of writing) will be to perform absolute
                                                                                                             impedance inversions, and calibrate predicted
                                                                                                             reservoir properties such as porosity between
                                                                                                             well locations at large separations.

                                                                                                             Velocity picking and model building

                                                                                                             The survey area is infamous for regional
                                                                                                             carbonates and severe seismic multiple
                                                                                                             problems. In fact, many areas of the NWS
                                                                                                             have historically yielded seismic data that is
                                                                                                             too poor for even basic exploration efforts.
                                                                                                             The upper part of Figure 10 demonstrates
                                                                                                             the characteristic historical problems with
                                                                                                             ambiguous primary vs. multiple trends on
                                                                                                             velocity semblance, noisy and weakly coherent
                                                                                                             energy on image gathers, and the associated
                                                                                                             poor stacking results. In contrast, the lower part
                                                                                                             of Figure 10 demonstrates a clearer semblance
                                                                                                             trend, strong and coherent events on image
                                                                                                             gathers, and an uplift in the associated stack
Fig. 10. Comparison of velocity picking panels for a discrete analysis location with conventional (upper)    quality.
vs. dual-sensor (lower) data. Note the striking improvement in the strength and coherency of events and
semblance amplitudes on the dual-sensor panels. These improvements arise from much stronger lower            Furthermore, it is our observation that dual-
frequency content and higher signal-to-noise ratio on the raw dual-sensor streamer field data.               sensor streamer data acquired in all global
                                                                                                             locations to date, demonstrate significant
resolution are inevitably and universally lost             ■ At maximum frequency, the signal is             improvements in low frequency content and
faster than low frequencies during transmission              consistently an additional 10 dB (a factor      signal-to-noise ratio. Thus, velocity model
through the earth. It is only possible to recover            of 3 to 4) stronger than noise for the first    building and multiple removal are greatly
some of these high frequency amplitudes at                   couple of seconds TWT below water bottom,       facilitated from day one of any data processing
large target depths during data processing                   tapering to lower values as attenuation in      project when dual-sensor data are available.
if the signal at these depths is demonstrably                the earth affects deeper targets.
stronger than the noise component of the                   ■ The frequency range of signal is consistently   It is worth noting that four unique wavefields
seismic wavefield.                                           an additional 55–65% greater for the first      are created during the wavefield separation in
                                                             couple of seconds TWT below water bottom,       dual-sensor processing: up-going and down-
After data processing to recover the up-going                tapering to lower values as attenuation in      going pressure, and up-going and down-going
pressure wavefield, completely free of any                   the earth affects deeper targets.               particle velocity. Whilst the up-going pressure
receiver ghost effects, a cross-spectral analysis          ■ The signal-to-noise ratio is greater for all    wavefield is the primary product for velocity
was pursued using methodology influenced by                  frequencies and for all TWT.                    picking, interpretation and inversion, the other
White (1973). The signal and noise components                                                                wavefields can be used for various high-end
of the up-going pressure wavefield were used               Seismic impedance inversion comparison            multiple removal and seismic imaging pursuits.
to derive frequency spectra for various TWT
windows. A systematic set of comparative                   A pre-stack relative impedance inversion
                                                                                                             Field tests and data analyses in
analyses were then possible.                               was done for the 2007 and 2008 surveys
                                                                                                             Australia: The source ghost
                                                           using a simultaneous sparse spike algorithm
In comparison to conventional streamer data,               (refer to Figure 9). The wavelet through the      A new approach to seismic acquisition has
the dual-sensor streamer data show significant             target interval was extracted using a Bayesian    also been tested in the southern Browse Basin
improvements in low and high frequency signal              inversion scheme, but the well log data were      during 2008, in an effort to remove both
content, less low and high frequency noise                 not used to derive any low frequency model.       source ghost and receiver ghost effects from
content, greater frequency range for signal at all         Thus, only the seismic data contribute to         towed streamer data. Of particular relevance in
TWT, and greater signal-to-noise ratio of signal           each impedance inversion. It is demonstrated      the test area is the almost complete absence
across all frequencies and for all TWT:                    that the dual-sensor data inversion result        on conventional streamer data of coherent
                                                           has contributed at least half an octave of        seismic events at depths greater than about
■ At 10 Hz, the signal is consistently an                  low frequency impedance information in            two seconds TWT. A 100 km 2D line was
  additional 12–15 dB (a factor of 4 to 5)                 comparison to the conventional streamer result,   acquired three times in a spatially-coincident
  stronger than noise for all TWT.                         and has also yielded more high frequency          manner during 2008: With a conventional


                                                                                                                               April/May 2009 | PESA News |   39
technology focus: streamer


Fig. 11. When a conventional source array (upper) has all source elements fired simultaneously the (down-going) primary and ghost source wavefronts are parallel to the
sea-surface, and effectively coupled by a constant time delay. In contrast, the staged firing of successively deeper source elements in the multi-level source array (lower)
decouples the primary and ghost source wavefronts. The ghost source wavefront is no longer parallel to the sea-surface, but the primary source wavefront still is.


source array and solid streamer in 2007, with               of air gun elements at different depths. The                 strongly-represented at most locations along the
a conventional source array and the dual-                   shallowest sub-array is fired first, sequentially            line when the dual-sensor data is used to remove
sensor streamer in 2008, and then finally with              followed by the firing of successively deeper                the effects of the receiver ghost and the multi-
a prototype “multi-level” source array and                  source arrays. Thus, the source ghost wavefront              level source array is used to reduce the effects of
the dual-sensor streamer. The objectives in                 is decoupled from the primary source                         the source ghost. New plays are apparent in both
this case were to address signal penetration                wavefront. In the test described here, two                   the shallow and deeper data. The data quality
problems by a combination of receiver                       sub-arrays were towed in vertical alignment at               is in between the two results shown in Figure
ghost removal and source ghost attenuation.                 depths of 12 and 18 m. The deeper sub-array                  12, when a conventional source array is used
Receiver ghost removal arises from the dual-                was fired 4 ms after the shallow sub-array,                  with the dual-sensor streamer. Velocity picking
sensor streamer processing, and source                      coincident in time with the arrival at 18 m                  was greatly facilitated by the improved data
ghost attenuation arises from the multi-level               depth of the primary source wavefront from the               quality arising from the combination of the dual-
source array. Again, true apples-for-apples                 12 m sub-array.                                              sensor streamer and the multi-level source. The
comparisons were possible.                                                                                               output of this prototype source array was biased
                                                            Reference to Figure 12 shows that data in                    towards low frequencies. Future implementations
As illustrated schematically in Figure 11, the              the target depth range of two to at least four               will be designed to yield richer high frequency
multi-level source array deploys sub-arrays                 seconds TWT are now both coherent and                        output too.


Fig. 12. Raw PSTM stack comparison of the test line in the target time window of 2 – 4 s TWT. When the effects of both the receiver and source ghost are present on
conventional data (left) the target events are very weak, incoherent and impossible to interpret. In contrast, the dual-sensor streamer + multi-level source result (right)
demonstrates a profound improvement in event strength, spatial coherency and interpretability.


40   | PESA News | April/May 2009
technology focus: streamer


Conclusions                                           References
Quantitative analysis of dual-sensor data             Carlson, D., Long, A., Söllner, W., Tabti, H.,   Posthumus, B.J., 1993, Deghosting using a
acquired in a spatially-coincident manner with        Tenghamn,R., and Lunde, N., 2007, Increased      twin streamer configuration. Geophysical
conventional streamer data on the North West          resolution and penetration from a towed dual-    Prospecting, 41, 267-286.
Shelf of Australia demonstrate a four to five-        sensor streamer. First Break, 25, 12, 71-77.
fold boost in the low frequency signal content,                                                        Tenghamn, R., S. Vaage, and C. Borresen, 2007, A
about three times the high frequency signal           Monk, D.J., 1990, Wavefield separation of twin   dual-sensor, towed marine streamer; its viable
content (before the application of any spectral       streamer data. First Break, 8, 3, 96-104.        implementation and initial results: 77th Annual
enhancement processing), and a higher signal-                                                          International Meeting, SEG, Expanded Abstracts,
to-noise content for all frequencies and for all      Özdemir, A.K., Caprioli, P., Özbek, A., Kragh,   989-993.
depths. Furthermore, the frequency range of           E., and Robertsson, J.O.A., 2008, Optimized
signal is boosted by 55–65% through the main          deghosting of over/under towed-streamer data     White, R.E., 1973, The estimation of signal
target interval. The low frequency boost arises       in the presence of noise. The Leading Edge, 2,   spectra and related quantities by means of
from deeper streamer towing and the removal           190-199.                                         the multiple coherence function. Geophysical
of the effects of the receiver ghost in processing.                                                    Prospecting, 21, 4, 660-703. ■
The high frequency boost (up to at least 200 Hz)
arises from the removal of the effects of the
receiver ghost. Less noise is also recorded for
deeper streamer towing, stabilising the wavefield
separation processing. The high frequencies
benefit the interpretation of subtle stratigraphic
features and allow clearer imaging of features
affected by transpressional fault reactivation.
The pronounced low frequency boost has many
benefits, including better velocity semblances
(particularly in poor data areas affected by
carbonates), more robust Q estimation, and
significant signal penetration improvements for
the seismic imaging of Triassic fault block plays
and deeper dolerite intrusive features. Overall,
the dual-sensor dataset has better resolution and
is more interpretable at all depths.

Pre-stack relative impedance inversion analysis
demonstrates a significant improvement in
low frequency content and character, and high
frequency resolution. Dual-sensor data thus
provides a bridge through the historical gap
between the seismic bandwidth available for
inversion and the low frequency model derived
from well log data.
                                                                                                                               Advertiser | Geokinetics


Finally, a test using the dual-sensor streamer
combined with a ‘multi-level’ source array also
demonstrates the additional improvements
derived from attenuating the source ghost, in
addition to removing the receiver ghost. Data
                                                                                                                                                          Instruction | Open


in one of the most problematic seismic areas of
the North West Shelf of Australia is improved.
Collectively, the pioneering lessons learned on
the NW Shelf Australia demonstrate the diverse
opportunities possible when the receiver
and source ghost effects can be robustly and
accurately removed.


Acknowledgements
Thanks to ESSO Australia and BHP Petroleum
for access to the well data used for wavelet
extraction in the seismic inversion exercise.
DownUnder GeoSolutions produced the
inversion results.


                                                                                                                         April/May 2009 | PESA News |                          41

Weitere ähnliche Inhalte

Was ist angesagt?

bettenhausen_igarss11_talk.pdf
bettenhausen_igarss11_talk.pdfbettenhausen_igarss11_talk.pdf
bettenhausen_igarss11_talk.pdfgrssieee
 
Echosounding ,shallow seismic reflection and underwater sonographic investiga...
Echosounding ,shallow seismic reflection and underwater sonographic investiga...Echosounding ,shallow seismic reflection and underwater sonographic investiga...
Echosounding ,shallow seismic reflection and underwater sonographic investiga...Sabna Thilakan
 
Intro to seismic 2
Intro to seismic 2Intro to seismic 2
Intro to seismic 2zhwchen
 
Advances in polarimetric X-band weather radar
Advances in polarimetric X-band weather radarAdvances in polarimetric X-band weather radar
Advances in polarimetric X-band weather radartobiasotto
 
Doppler Effect - Ultrasound
Doppler Effect - UltrasoundDoppler Effect - Ultrasound
Doppler Effect - UltrasoundVictor Ekpo
 
Basic radar principles 2012
Basic radar principles 2012Basic radar principles 2012
Basic radar principles 2012Jaime Gonzalez
 
The active remote sensing equation
The active remote sensing equationThe active remote sensing equation
The active remote sensing equationtobiasotto
 
Molecular Rayleigh Scattering to Measure Fluctuations in Density, Velocity an...
Molecular Rayleigh Scattering to Measure Fluctuations in Density, Velocity an...Molecular Rayleigh Scattering to Measure Fluctuations in Density, Velocity an...
Molecular Rayleigh Scattering to Measure Fluctuations in Density, Velocity an...Chief Technologist Office
 
1-Wang-FR1020-IGARSS11.pptx
1-Wang-FR1020-IGARSS11.pptx1-Wang-FR1020-IGARSS11.pptx
1-Wang-FR1020-IGARSS11.pptxgrssieee
 
Mechanical Waves Doppler Effect And its application In medicine
Mechanical Waves Doppler Effect And its application In medicineMechanical Waves Doppler Effect And its application In medicine
Mechanical Waves Doppler Effect And its application In medicineNihal Yuzbasheva
 

Was ist angesagt? (20)

bettenhausen_igarss11_talk.pdf
bettenhausen_igarss11_talk.pdfbettenhausen_igarss11_talk.pdf
bettenhausen_igarss11_talk.pdf
 
Doppler
DopplerDoppler
Doppler
 
Echosounding ,shallow seismic reflection and underwater sonographic investiga...
Echosounding ,shallow seismic reflection and underwater sonographic investiga...Echosounding ,shallow seismic reflection and underwater sonographic investiga...
Echosounding ,shallow seismic reflection and underwater sonographic investiga...
 
Intro to seismic 2
Intro to seismic 2Intro to seismic 2
Intro to seismic 2
 
Advances in polarimetric X-band weather radar
Advances in polarimetric X-band weather radarAdvances in polarimetric X-band weather radar
Advances in polarimetric X-band weather radar
 
Doppler Effect - Ultrasound
Doppler Effect - UltrasoundDoppler Effect - Ultrasound
Doppler Effect - Ultrasound
 
Basic radar principles 2012
Basic radar principles 2012Basic radar principles 2012
Basic radar principles 2012
 
Doppler physics
Doppler physics Doppler physics
Doppler physics
 
Sonar
SonarSonar
Sonar
 
Report on sonar
Report on sonarReport on sonar
Report on sonar
 
Sidescan sonar (nio)
Sidescan sonar (nio)Sidescan sonar (nio)
Sidescan sonar (nio)
 
Doppler physics ppt
Doppler physics pptDoppler physics ppt
Doppler physics ppt
 
Doppler physics by Dr Nani
Doppler physics by Dr NaniDoppler physics by Dr Nani
Doppler physics by Dr Nani
 
The active remote sensing equation
The active remote sensing equationThe active remote sensing equation
The active remote sensing equation
 
Molecular Rayleigh Scattering to Measure Fluctuations in Density, Velocity an...
Molecular Rayleigh Scattering to Measure Fluctuations in Density, Velocity an...Molecular Rayleigh Scattering to Measure Fluctuations in Density, Velocity an...
Molecular Rayleigh Scattering to Measure Fluctuations in Density, Velocity an...
 
1-Wang-FR1020-IGARSS11.pptx
1-Wang-FR1020-IGARSS11.pptx1-Wang-FR1020-IGARSS11.pptx
1-Wang-FR1020-IGARSS11.pptx
 
Sonar system
Sonar systemSonar system
Sonar system
 
Fading & Doppler Effect
Fading & Doppler EffectFading & Doppler Effect
Fading & Doppler Effect
 
Mechanical Waves Doppler Effect And its application In medicine
Mechanical Waves Doppler Effect And its application In medicineMechanical Waves Doppler Effect And its application In medicine
Mechanical Waves Doppler Effect And its application In medicine
 
MBES_ Taicheng Report
MBES_ Taicheng ReportMBES_ Taicheng Report
MBES_ Taicheng Report
 

Ähnlich wie Streamer technology innovations remove ghosting and boost frequencies

Time-Frequency Attenuation of Swell Noise on Seismic Data from Offshore Centr...
Time-Frequency Attenuation of Swell Noise on Seismic Data from Offshore Centr...Time-Frequency Attenuation of Swell Noise on Seismic Data from Offshore Centr...
Time-Frequency Attenuation of Swell Noise on Seismic Data from Offshore Centr...iosrjce
 
Some basic concepts
Some basic conceptsSome basic concepts
Some basic conceptsJamal Ahmad
 
Underwater channel modelling
Underwater channel modellingUnderwater channel modelling
Underwater channel modellingSupriya Ankushe
 
Underwater channel modelling
Underwater channel modellingUnderwater channel modelling
Underwater channel modellingSupriya Ankushe
 
Underwater channel modelling
Underwater channel modellingUnderwater channel modelling
Underwater channel modellingSupriya Ankushe
 
TGS IMG- Clari-Fi
TGS IMG- Clari-Fi TGS IMG- Clari-Fi
TGS IMG- Clari-Fi TGS
 
UNDER WATER NOISE REDUCTION USING WAVELET AND SAVITZKY-GOLAY
UNDER WATER NOISE REDUCTION USING WAVELET AND SAVITZKY-GOLAYUNDER WATER NOISE REDUCTION USING WAVELET AND SAVITZKY-GOLAY
UNDER WATER NOISE REDUCTION USING WAVELET AND SAVITZKY-GOLAYcsandit
 
Broadband seismic to support hydrocarbon exploration on the UK Continental Sh...
Broadband seismic to support hydrocarbon exploration on the UK Continental Sh...Broadband seismic to support hydrocarbon exploration on the UK Continental Sh...
Broadband seismic to support hydrocarbon exploration on the UK Continental Sh...ssuserb20d17
 
PROJECT REPORT1 (1) new
PROJECT REPORT1 (1) newPROJECT REPORT1 (1) new
PROJECT REPORT1 (1) newAnkita Badal
 
High-Sensitivity HydrophoneBased on Fiber Grating Laser And Acorrugated Diaph...
High-Sensitivity HydrophoneBased on Fiber Grating Laser And Acorrugated Diaph...High-Sensitivity HydrophoneBased on Fiber Grating Laser And Acorrugated Diaph...
High-Sensitivity HydrophoneBased on Fiber Grating Laser And Acorrugated Diaph...IJRESJOURNAL
 
Time domain sound spectrum measurements in ducted axial fan
Time domain sound spectrum measurements in ducted axial fanTime domain sound spectrum measurements in ducted axial fan
Time domain sound spectrum measurements in ducted axial fanIAEME Publication
 

Ähnlich wie Streamer technology innovations remove ghosting and boost frequencies (20)

Time-Frequency Attenuation of Swell Noise on Seismic Data from Offshore Centr...
Time-Frequency Attenuation of Swell Noise on Seismic Data from Offshore Centr...Time-Frequency Attenuation of Swell Noise on Seismic Data from Offshore Centr...
Time-Frequency Attenuation of Swell Noise on Seismic Data from Offshore Centr...
 
Some basic concepts
Some basic conceptsSome basic concepts
Some basic concepts
 
Sonic Log
Sonic Log Sonic Log
Sonic Log
 
Underwater channel modelling
Underwater channel modellingUnderwater channel modelling
Underwater channel modelling
 
Underwater channel modelling
Underwater channel modellingUnderwater channel modelling
Underwater channel modelling
 
Underwater channel modelling
Underwater channel modellingUnderwater channel modelling
Underwater channel modelling
 
Ultasonic testing
Ultasonic testingUltasonic testing
Ultasonic testing
 
TGS IMG- Clari-Fi
TGS IMG- Clari-Fi TGS IMG- Clari-Fi
TGS IMG- Clari-Fi
 
UNDER WATER NOISE REDUCTION USING WAVELET AND SAVITZKY-GOLAY
UNDER WATER NOISE REDUCTION USING WAVELET AND SAVITZKY-GOLAYUNDER WATER NOISE REDUCTION USING WAVELET AND SAVITZKY-GOLAY
UNDER WATER NOISE REDUCTION USING WAVELET AND SAVITZKY-GOLAY
 
1-5
1-51-5
1-5
 
Broadband seismic to support hydrocarbon exploration on the UK Continental Sh...
Broadband seismic to support hydrocarbon exploration on the UK Continental Sh...Broadband seismic to support hydrocarbon exploration on the UK Continental Sh...
Broadband seismic to support hydrocarbon exploration on the UK Continental Sh...
 
IJET-V3I2P9
IJET-V3I2P9IJET-V3I2P9
IJET-V3I2P9
 
Extended abstract
Extended abstractExtended abstract
Extended abstract
 
Cased hole seismic (2)
Cased hole seismic (2)Cased hole seismic (2)
Cased hole seismic (2)
 
2014_SEG_poster
2014_SEG_poster2014_SEG_poster
2014_SEG_poster
 
Basalt Presentation
Basalt PresentationBasalt Presentation
Basalt Presentation
 
PROJECT REPORT1 (1) new
PROJECT REPORT1 (1) newPROJECT REPORT1 (1) new
PROJECT REPORT1 (1) new
 
High-Sensitivity HydrophoneBased on Fiber Grating Laser And Acorrugated Diaph...
High-Sensitivity HydrophoneBased on Fiber Grating Laser And Acorrugated Diaph...High-Sensitivity HydrophoneBased on Fiber Grating Laser And Acorrugated Diaph...
High-Sensitivity HydrophoneBased on Fiber Grating Laser And Acorrugated Diaph...
 
Time domain sound spectrum measurements in ducted axial fan
Time domain sound spectrum measurements in ducted axial fanTime domain sound spectrum measurements in ducted axial fan
Time domain sound spectrum measurements in ducted axial fan
 
IEEE paper Peizo_published
IEEE paper Peizo_publishedIEEE paper Peizo_published
IEEE paper Peizo_published
 

Kürzlich hochgeladen

The Ultimate Guide to Choosing WordPress Pros and Cons
The Ultimate Guide to Choosing WordPress Pros and ConsThe Ultimate Guide to Choosing WordPress Pros and Cons
The Ultimate Guide to Choosing WordPress Pros and ConsPixlogix Infotech
 
Time Series Foundation Models - current state and future directions
Time Series Foundation Models - current state and future directionsTime Series Foundation Models - current state and future directions
Time Series Foundation Models - current state and future directionsNathaniel Shimoni
 
TeamStation AI System Report LATAM IT Salaries 2024
TeamStation AI System Report LATAM IT Salaries 2024TeamStation AI System Report LATAM IT Salaries 2024
TeamStation AI System Report LATAM IT Salaries 2024Lonnie McRorey
 
Zeshan Sattar- Assessing the skill requirements and industry expectations for...
Zeshan Sattar- Assessing the skill requirements and industry expectations for...Zeshan Sattar- Assessing the skill requirements and industry expectations for...
Zeshan Sattar- Assessing the skill requirements and industry expectations for...itnewsafrica
 
2024 April Patch Tuesday
2024 April Patch Tuesday2024 April Patch Tuesday
2024 April Patch TuesdayIvanti
 
[Webinar] SpiraTest - Setting New Standards in Quality Assurance
[Webinar] SpiraTest - Setting New Standards in Quality Assurance[Webinar] SpiraTest - Setting New Standards in Quality Assurance
[Webinar] SpiraTest - Setting New Standards in Quality AssuranceInflectra
 
Digital Identity is Under Attack: FIDO Paris Seminar.pptx
Digital Identity is Under Attack: FIDO Paris Seminar.pptxDigital Identity is Under Attack: FIDO Paris Seminar.pptx
Digital Identity is Under Attack: FIDO Paris Seminar.pptxLoriGlavin3
 
Generative Artificial Intelligence: How generative AI works.pdf
Generative Artificial Intelligence: How generative AI works.pdfGenerative Artificial Intelligence: How generative AI works.pdf
Generative Artificial Intelligence: How generative AI works.pdfIngrid Airi González
 
Glenn Lazarus- Why Your Observability Strategy Needs Security Observability
Glenn Lazarus- Why Your Observability Strategy Needs Security ObservabilityGlenn Lazarus- Why Your Observability Strategy Needs Security Observability
Glenn Lazarus- Why Your Observability Strategy Needs Security Observabilityitnewsafrica
 
The Role of FIDO in a Cyber Secure Netherlands: FIDO Paris Seminar.pptx
The Role of FIDO in a Cyber Secure Netherlands: FIDO Paris Seminar.pptxThe Role of FIDO in a Cyber Secure Netherlands: FIDO Paris Seminar.pptx
The Role of FIDO in a Cyber Secure Netherlands: FIDO Paris Seminar.pptxLoriGlavin3
 
Decarbonising Buildings: Making a net-zero built environment a reality
Decarbonising Buildings: Making a net-zero built environment a realityDecarbonising Buildings: Making a net-zero built environment a reality
Decarbonising Buildings: Making a net-zero built environment a realityIES VE
 
Potential of AI (Generative AI) in Business: Learnings and Insights
Potential of AI (Generative AI) in Business: Learnings and InsightsPotential of AI (Generative AI) in Business: Learnings and Insights
Potential of AI (Generative AI) in Business: Learnings and InsightsRavi Sanghani
 
The State of Passkeys with FIDO Alliance.pptx
The State of Passkeys with FIDO Alliance.pptxThe State of Passkeys with FIDO Alliance.pptx
The State of Passkeys with FIDO Alliance.pptxLoriGlavin3
 
Data governance with Unity Catalog Presentation
Data governance with Unity Catalog PresentationData governance with Unity Catalog Presentation
Data governance with Unity Catalog PresentationKnoldus Inc.
 
Unleashing Real-time Insights with ClickHouse_ Navigating the Landscape in 20...
Unleashing Real-time Insights with ClickHouse_ Navigating the Landscape in 20...Unleashing Real-time Insights with ClickHouse_ Navigating the Landscape in 20...
Unleashing Real-time Insights with ClickHouse_ Navigating the Landscape in 20...Alkin Tezuysal
 
Long journey of Ruby standard library at RubyConf AU 2024
Long journey of Ruby standard library at RubyConf AU 2024Long journey of Ruby standard library at RubyConf AU 2024
Long journey of Ruby standard library at RubyConf AU 2024Hiroshi SHIBATA
 
Generative AI - Gitex v1Generative AI - Gitex v1.pptx
Generative AI - Gitex v1Generative AI - Gitex v1.pptxGenerative AI - Gitex v1Generative AI - Gitex v1.pptx
Generative AI - Gitex v1Generative AI - Gitex v1.pptxfnnc6jmgwh
 
The Future Roadmap for the Composable Data Stack - Wes McKinney - Data Counci...
The Future Roadmap for the Composable Data Stack - Wes McKinney - Data Counci...The Future Roadmap for the Composable Data Stack - Wes McKinney - Data Counci...
The Future Roadmap for the Composable Data Stack - Wes McKinney - Data Counci...Wes McKinney
 
A Deep Dive on Passkeys: FIDO Paris Seminar.pptx
A Deep Dive on Passkeys: FIDO Paris Seminar.pptxA Deep Dive on Passkeys: FIDO Paris Seminar.pptx
A Deep Dive on Passkeys: FIDO Paris Seminar.pptxLoriGlavin3
 
So einfach geht modernes Roaming fuer Notes und Nomad.pdf
So einfach geht modernes Roaming fuer Notes und Nomad.pdfSo einfach geht modernes Roaming fuer Notes und Nomad.pdf
So einfach geht modernes Roaming fuer Notes und Nomad.pdfpanagenda
 

Kürzlich hochgeladen (20)

The Ultimate Guide to Choosing WordPress Pros and Cons
The Ultimate Guide to Choosing WordPress Pros and ConsThe Ultimate Guide to Choosing WordPress Pros and Cons
The Ultimate Guide to Choosing WordPress Pros and Cons
 
Time Series Foundation Models - current state and future directions
Time Series Foundation Models - current state and future directionsTime Series Foundation Models - current state and future directions
Time Series Foundation Models - current state and future directions
 
TeamStation AI System Report LATAM IT Salaries 2024
TeamStation AI System Report LATAM IT Salaries 2024TeamStation AI System Report LATAM IT Salaries 2024
TeamStation AI System Report LATAM IT Salaries 2024
 
Zeshan Sattar- Assessing the skill requirements and industry expectations for...
Zeshan Sattar- Assessing the skill requirements and industry expectations for...Zeshan Sattar- Assessing the skill requirements and industry expectations for...
Zeshan Sattar- Assessing the skill requirements and industry expectations for...
 
2024 April Patch Tuesday
2024 April Patch Tuesday2024 April Patch Tuesday
2024 April Patch Tuesday
 
[Webinar] SpiraTest - Setting New Standards in Quality Assurance
[Webinar] SpiraTest - Setting New Standards in Quality Assurance[Webinar] SpiraTest - Setting New Standards in Quality Assurance
[Webinar] SpiraTest - Setting New Standards in Quality Assurance
 
Digital Identity is Under Attack: FIDO Paris Seminar.pptx
Digital Identity is Under Attack: FIDO Paris Seminar.pptxDigital Identity is Under Attack: FIDO Paris Seminar.pptx
Digital Identity is Under Attack: FIDO Paris Seminar.pptx
 
Generative Artificial Intelligence: How generative AI works.pdf
Generative Artificial Intelligence: How generative AI works.pdfGenerative Artificial Intelligence: How generative AI works.pdf
Generative Artificial Intelligence: How generative AI works.pdf
 
Glenn Lazarus- Why Your Observability Strategy Needs Security Observability
Glenn Lazarus- Why Your Observability Strategy Needs Security ObservabilityGlenn Lazarus- Why Your Observability Strategy Needs Security Observability
Glenn Lazarus- Why Your Observability Strategy Needs Security Observability
 
The Role of FIDO in a Cyber Secure Netherlands: FIDO Paris Seminar.pptx
The Role of FIDO in a Cyber Secure Netherlands: FIDO Paris Seminar.pptxThe Role of FIDO in a Cyber Secure Netherlands: FIDO Paris Seminar.pptx
The Role of FIDO in a Cyber Secure Netherlands: FIDO Paris Seminar.pptx
 
Decarbonising Buildings: Making a net-zero built environment a reality
Decarbonising Buildings: Making a net-zero built environment a realityDecarbonising Buildings: Making a net-zero built environment a reality
Decarbonising Buildings: Making a net-zero built environment a reality
 
Potential of AI (Generative AI) in Business: Learnings and Insights
Potential of AI (Generative AI) in Business: Learnings and InsightsPotential of AI (Generative AI) in Business: Learnings and Insights
Potential of AI (Generative AI) in Business: Learnings and Insights
 
The State of Passkeys with FIDO Alliance.pptx
The State of Passkeys with FIDO Alliance.pptxThe State of Passkeys with FIDO Alliance.pptx
The State of Passkeys with FIDO Alliance.pptx
 
Data governance with Unity Catalog Presentation
Data governance with Unity Catalog PresentationData governance with Unity Catalog Presentation
Data governance with Unity Catalog Presentation
 
Unleashing Real-time Insights with ClickHouse_ Navigating the Landscape in 20...
Unleashing Real-time Insights with ClickHouse_ Navigating the Landscape in 20...Unleashing Real-time Insights with ClickHouse_ Navigating the Landscape in 20...
Unleashing Real-time Insights with ClickHouse_ Navigating the Landscape in 20...
 
Long journey of Ruby standard library at RubyConf AU 2024
Long journey of Ruby standard library at RubyConf AU 2024Long journey of Ruby standard library at RubyConf AU 2024
Long journey of Ruby standard library at RubyConf AU 2024
 
Generative AI - Gitex v1Generative AI - Gitex v1.pptx
Generative AI - Gitex v1Generative AI - Gitex v1.pptxGenerative AI - Gitex v1Generative AI - Gitex v1.pptx
Generative AI - Gitex v1Generative AI - Gitex v1.pptx
 
The Future Roadmap for the Composable Data Stack - Wes McKinney - Data Counci...
The Future Roadmap for the Composable Data Stack - Wes McKinney - Data Counci...The Future Roadmap for the Composable Data Stack - Wes McKinney - Data Counci...
The Future Roadmap for the Composable Data Stack - Wes McKinney - Data Counci...
 
A Deep Dive on Passkeys: FIDO Paris Seminar.pptx
A Deep Dive on Passkeys: FIDO Paris Seminar.pptxA Deep Dive on Passkeys: FIDO Paris Seminar.pptx
A Deep Dive on Passkeys: FIDO Paris Seminar.pptx
 
So einfach geht modernes Roaming fuer Notes und Nomad.pdf
So einfach geht modernes Roaming fuer Notes und Nomad.pdfSo einfach geht modernes Roaming fuer Notes und Nomad.pdf
So einfach geht modernes Roaming fuer Notes und Nomad.pdf
 

Streamer technology innovations remove ghosting and boost frequencies

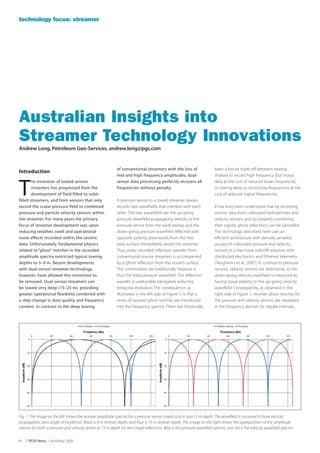
  • 1. technology focus: streamer Australian Insights into Streamer Technology Innovations Andrew Long, Petroleum Geo-Services, andrew.long@pgs.com of conventional streamers with the loss of been a forced trade-off between towing Introduction mid and high frequency amplitudes, dual- shallow to record high frequency (but noisy) T he evolution of towed seismic sensor data processing perfectly recovers all data at the cost of reduced lower frequencies, streamers has progressed from the frequencies without penalty. or towing deep to record low frequencies at the development of fluid-filled to solid- cost of reduced higher frequencies. filled streamers, and from sensors that only A pressure sensor in a towed streamer always record the scalar pressure field to combined records two wavefields that interfere with each It has long been understood that by recording pressure and particle velocity sensors within other. The two wavefields are the up-going seismic data from collocated hydrophones and the streamer. For many years the primary pressure wavefield propagating directly to the velocity sensors, and by properly combining focus of streamer development was upon pressure sensor from the earth below, and the their signals, ghost reflections can be cancelled. reducing weather, swell and operational down-going pressure wavefield reflected with The technology described here uses an noise effects recorded within the seismic opposite polarity downwards from the free efficient architecture with densely sampled data. Unfortunately, fundamental physics (sea) surface immediately above the streamer. groups of collocated pressure and velocity related to “ghost” notches in the recorded Thus, every recorded reflection wavelet from sensors in a low-noise solid-fill streamer with amplitude spectra restricted typical towing conventional marine streamers is accompanied distributed electronics and Ethernet telemetry depths to 5–9 m. Recent developments by a ‘ghost’ reflection from the ocean’s surface. (Tenghamn et al., 2007). In contrast to pressure with dual-sensor streamer technology, The combination we traditionally measure is sensors, velocity sensors are directional, so the however, have allowed this restriction to thus the ‘total pressure’ wavefield. The reflection down-going velocity wavefield is measured as be removed. Dual-sensor streamers can wavelet is undesirably elongated, reducing having equal polarity to the up-going velocity be towed very deep (15–25 m), providing temporal resolution. The consequence, as wavefield. Consequently, as observed in the greater operational flexibility combined with illustrated in the left side of Figure 1, is that a right side of Figure 1, receiver ghost notches for a step-change in data quality and frequency series of receiver ghost notches are introduced the pressure and velocity sensors are separated content. In contrast to the deep towing into the frequency spectra. There has historically in the frequency domain by regular intervals, Fig. 1. The image on the left shows the receiver amplitude spectra for a pressure sensor towed at 8 m and 15 m depth. The wavefield is assumed to have vertical propagation (zero angle of incidence). Black is 8 m receiver depth, and blue is 15 m receiver depth. The image on the right shows the superposition of the amplitude spectra for both a pressure and velocity sensor at 15 m depth for zero angle reflections. Blue is the pressure wavefield spectra, and red is the velocity wavefield spectra. 34 | PESA News | April/May 2009
  • 2. technology focus: streamer but are perfectly offset from each other in terms of complementary peaks and notches. Appropriate processing of the measured pressure and velocity data will completely cancel the amplitude of the ghost event trailing each primary event, and the notches in the amplitude spectra will be removed. This is the case for all angles of incidence, i.e. for all source- receiver offsets. Historical streamer efforts to remove the receiver ghost It has been demonstrated that the noise effects of weather-induced surface waves decrease significantly when the tow depth is increased to about 15 m or more. This can be seen in Figure 2, which compares the levels of recorded moderate weather surface-wave noise at tow depths of 7 and 15 m. Fig. 2. Weather noise levels at streamer towing depths of 7 and 15 m. The streamer used was towed to passively record the ambient background energy without any active source firing. It makes obvious sense to tow deep if Unfortunately, as demonstrated above, the effect the receiver ghost can be removed in processing. of the receiver ghost has prevented conventional streamers from being towed any deeper than about 8 meters. At conventional towing depths streamer spread being towed shallow. By grossly project flexibility. Both low and high frequencies the low frequencies required for robust seismic relaxing the spatial sampling assumptions, the are boosted without compromise in fidelity impedance inversion are absent, operations are methodology is less sensitive to streamer depth or accuracy all the way up to the Nyquist exposed to surface-related weather, sea swell errors, and the deeper streamers are only used frequency. Thus, the only constraints upon the and other hazards that will create unwanted to contribute very low frequencies to the final recoverable high frequencies are the effects noise, and high frequencies required for thin bed processed result (e.g. 0–20 Hz). Thus, the trade- of the source ghost and the inescapable resolution are also often absent. off is that mid and higher frequencies retain the attenuation effects of the earth. The source down-going pressure wavefield effects (receiver ghost is briefly addressed below. Several historical efforts have been made to ghosting), and have a signal-to-noise content combine the frequency spectra of streamers appropriate to streamers towed closer to the Spectral enhancement in processing of high towed simultaneously at different depths; surface. frequencies lost to attenuation benefits from variously referred to as ‘twin streamers’ or dual-sensor data acquisition for two main ‘over-under’ towing. In the simplest approaches Many attempts have been made through the reasons: taken (Monk, 1990), time shifts and/or phase years to incorporate vertical particle velocity corrections are used in an effort to align and detectors into the towed streamer, but their 1. The high frequencies have signal-to-noise combine data acquired at different depths. response to vibration noise propagating content appropriate to streamers towed very More recent publications from Posthumus along the streamer always overwhelmed their deep; and (1993) and Özdemir et al. (2008) describe response to the desired seismic reflection 2. The removal of the receiver ghost effects extensions of these ideas to address residual signals. PGS eventually made the required have already boosted the signal content of noise from the down-going pressure wavefield, engineering breakthroughs, and introduced a high frequencies relative to conventional and reduce noise and errors introduced commercial solution (the ‘GeoStreamer’) at the streamer data anyway. or enhanced via the methodology. On the 2007 EAGE international technical conference. operational side it is obviously expensive Thus, high frequency amplitudes can be and challenging to tow half of the available By having collocated pressure and particle robustly recovered before noise levels become streamers at one depth and the other half of velocity sensors, there are no issues related unacceptable. the available streamers at another depth. Each to streamer depth control and the removal streamer spread will be exposed to different of the receiver ghost. In fact, the dual-sensor Field tests and data analyses in local forces and noise effects. In addition configuration enables a methodology to Australia: The receiver ghost to the well-known critical requirements to accurately identify the streamer depth to laterally align the shallow and deep streamers, within 0.2 m on an offset-dependent and The test line location a lesser-known problem is the sensitivity of shot-dependent basis. Any errors in receiver the methodology to small errors in streamer ghost removal are thus identified and removed A regional 2D streamer seismic survey was depth. As a consequence of vertical streamer early in processing. By towing the collocated acquired in two regionally overlapping phases separation errors, the up-going pressure data dual-sensors very deep (typically 25 m) the over the North West Shelf of Australia during derived from processing becomes less robust signal-to-noise content across all frequencies 2007 and 2008 (Figure 3). Water depths vary at higher frequencies; typically beyond 70 Hz after removal of the down-going wavefield between 50 and 3,500 m. Phase I was acquired in normal operating conditions. One pragmatic is high. This increased “insulation” from the with a 7,950 m fluid-fill streamer at a depth of solution is to tow a smaller number of coarsely- effects of bad weather also increases the 7 m, and Phase II was acquired with a 8,100 m spaced streamers at larger depths than the operational weather window and enhances solid-fill dual-sensor streamer at a depth of April/May 2009 | PESA News | 35
  • 3. technology focus: streamer and offsets. The resultant up-going pressure wavefield is free of the receiver ghost, and has been extrapolated to an equivalent receiver depth of 7 m for comparison with the existing total pressure (hydrophone) data. The power of dual-sensor acquisition and processing is demonstrated here on the North West Shelf (NWS) of Australia. A 156 km 2D seismic line in the northern Carnarvon Basin was acquired twice; both in Phase I (conventional streamer) and Phase II (dual- sensor streamer). Thus, a true apples-for- apples comparison was made. The NW-SE line orientation is in the dip direction, and intersects a known gas field associated with a pronounced amplitude anomaly. Water depth exceeds 750 m. Challenges to seismic penetration and resolution Much of the North West Shelf is affected by relatively near-surface barriers to deeper target seismic imaging and resolution. Major sequence boundaries in the post-rift section occur in the Turonian (Late Cretaceous) Fig. 3. 2D survey location on the North West Shelf of Australia. The survey area is about 1000 km long. Two test and Base Tertiary. Campanian inversion of lines were acquired in multiple passes to quantify the removal of the receiver and source ghost effects from transpressional structures was accentuated streamer data. The line used to quantify receiver ghost removal described here lies in the northern Carnarvon by regional tectonism in the Neogene, and Basin; in the southern part of the survey area. The line used to address source ghost attenuation described here is associated with trap breach in the area. lies in the central Browse Basin; in the northern part of the survey area. Complex swarm faulting affects the Tertiary section, and requires rich high frequency 15 m. Receiver interval in both phases of the Typical of the area, processing follows a content for high resolution seismic imaging. survey was 12.5 m. A symmetric 2,980 in3 cascaded flow, incorporating velocity mute in Analysis of the dual-sensor data (refer to source array of Sodera G-guns was towed at the tau-p domain, SRME and high-resolution Figure 5) shows that brute stack frequencies a depth of 6 m for both surveys, with a shot radon demultiple. Pre-stack Kirchhoff time beyond the source ghost in the up-going interval of 37.5 m. Record length was 12 s. Phase migration used an optimised high-order velocity pressure wavefield have much stronger I acquisition and processing was completed function to accurately incorporate longer offsets amplitudes; up to at least 200 Hz. This in 2007. Phase II (dual-sensor) acquisition and into imaging. Specialised pre-processing and particularly benefits thin bed resolution and processing was completed in 2008. As observed wavefield separation used for the Phase II dual- subtle stratigraphic interpretation in the first in Figure 4, the recorded pressure and particle sensor data followed the methods described in second two-way time (TWT) below the water velocity data yield complementary information Tenghamn et al. (2007) and Carlson et al. (2007). bottom. Although no spectral enhancement about the subsurface, and together in The obliquity term is automatically included processing has been applied to any of the processing, result in significant data resolution, during wavefield separation, and amplitudes figures here, estimation of the quality factor quality and deep target imaging improvements. are equally correct for all incidence angles (Q) is more robust using up-going pressure Fig. 4. Near-trace gathers for pressure (left) and velocity (right) sensor data from the study area in the northern Carnarvon Basin. The window width is about 75 km, and the vertical extent is 0.0–4.2 s TWT. 36 | PESA News | April/May 2009
  • 4. technology focus: streamer data, and linear regressions using the spectral ratio method have good fit down to about 3 Hz. Carbonates are mapped in the Mid Cretaceous/Aptian, and are more regionally pervasive in the Late Cretaceous and Late Tertiary, producing complex seismic multiple noise events. The seismic multiple problems become more severe to the north and east of the survey area (towards the southern Browse Basin), creating problems for velocity picking and seismic imaging. Production velocity picking was, however, significantly easier on up-going pressure data, in large part because of the characteristic low frequency boost at all TWT (refer also to Figure 7 and discussion below). A clearer primary semblance trend Fig. 5. Superimposed amplitude spectra from brute stacks. Red is the up-going pressure data from the is evident during analysis, and associated dual-sensor streamer used in 2008, and black is the total pressure data from the conventional streamer improvements in later stage velocity analysis used in 2007. The time window used was 1.5 – 4.0 seconds TWT. Removal of the receiver ghost also benefits amplitudes at frequencies beyond the source ghost at about 125 Hz. Processing sample rate is 2 ms. Fig. 6 subsequently derive from improved multiple demonstrates the combined benefits of higher resolution and high signal-to-noise content. removal. Fig. 6. Shallow PSTM comparison of total pressure (conventional streamer: left) vs. up-going pressure (dual-sensor streamer: right) stacks that are spatially coincident. The window width is about 38 km, and the vertical extent is 1.3–2.7 s TWT. Over this depth range the up-going pressure data are visibly richer in high frequencies, very clean, and demonstrate enhanced thin bed resolution. Fig. 7. Stack filter panels for total pressure (conventional streamer: left) vs. up-going pressure (dual-sensor streamer: right). Data stacked at an effective receiver depth of 7 m in both cases. Frequency ranges are as follows: All, 0-5 Hz, 15-20 Hz, 30-35 Hz, 45-50 Hz, 60-65 Hz, 75-80 Hz, 90-95 Hz, 105-110 Hz, 120-125 Hz and 135-140 Hz. Frequencies beyond the source ghost (refer to Figure 5) have been truncated for display purposes. Processing sample rate is 2 ms. Note the low frequency contrast in the second panel. April/May 2009 | PESA News | 37
  • 5. technology focus: streamer Fig. 8. Deep PSTM comparison of total pressure (conventional streamer: left) vs. up-going pressure (dual-sensor streamer: right) stacks that are spatially coincident. The window width is about 44 km, and the vertical extent is 5.0 – 6.8 s TWT. Over this depth range the up-going pressure data are visibly richer in low frequencies, very clean, and demonstrate enhanced event continuity, character, and fundamental interpretability. Although untested as potential hydrocarbon underlying Triassic sediments during the Early considerably easier to pick in poor data areas plays, the two strongest seismic markers Cretaceous, and again later by the regional by examination of the up-going pressure throughout the survey area correspond to Campanian inversion. Post-rift fault reactivation data. Additional low frequency imaging Top Triassic and Callovian events. These two is more clearly interpreted to affect internal benefits were proven in the Browse basin events can be easily confused with each other reservoir and trap geometry. using a dual-sensor streamer complemented wherever the Lower Jurassic section thins by a source array configured to attenuate the over Triassic structural highs – typically the Finally, the Triassic Mungaroo Formation source ghost (see below). top of rotated Triassic fault blocks. Various is a thick pre-rift section that contains investigations were made to address potential dolerite intrusions. Mapping the intrusives Quantification of signal and noise hydrocarbon-related amplitude anomalies at is a key to constraining basin evolution; the top of these Triassic fault blocks. The results notably areas of basin weakness during the It is self-evident that a seismic dataset rich from a relative impedance inversion study are main Callovian extensional event. Figures in very low frequency content and with high discussed below. 7 and 8 demonstrate the overwhelming signal-to-noise ratio across all frequencies and improvements in deep target image clarity for all two-way time (TWT) provides the best The largest gas field in the survey area is hosted and character on up-going pressure data. platform for the recovery of elastic rock and below the Valanginian Unconformity, and was The deeper target velocity field is surprisingly fluid properties in a hydrocarbon-saturated probably affected by fault block rotation of the variable throughout the region, and was reservoir. High frequencies required for thin bed Fig. 9. Relative pre-stack P-impedance inversion for conventional (top left) vs. dual-sensor data (top right), and S-impedance inversion for conventional (lower left) vs. dual-sensor data (lower right). Note the profound improvements in impedance character, low frequency content, and resolution for both dual-sensor results. A large gas field is evident on the P-impedance sections. 38 | PESA News | April/May 2009
  • 6. technology focus: streamer impedance information. Thus, a bridge is made in the historical gap between the seismic bandwidth and the low frequency bandwidth derived from well log data and the seismic velocity model. The next stage of this ongoing investigation (at the time of writing) will be to perform absolute impedance inversions, and calibrate predicted reservoir properties such as porosity between well locations at large separations. Velocity picking and model building The survey area is infamous for regional carbonates and severe seismic multiple problems. In fact, many areas of the NWS have historically yielded seismic data that is too poor for even basic exploration efforts. The upper part of Figure 10 demonstrates the characteristic historical problems with ambiguous primary vs. multiple trends on velocity semblance, noisy and weakly coherent energy on image gathers, and the associated poor stacking results. In contrast, the lower part of Figure 10 demonstrates a clearer semblance trend, strong and coherent events on image gathers, and an uplift in the associated stack Fig. 10. Comparison of velocity picking panels for a discrete analysis location with conventional (upper) quality. vs. dual-sensor (lower) data. Note the striking improvement in the strength and coherency of events and semblance amplitudes on the dual-sensor panels. These improvements arise from much stronger lower Furthermore, it is our observation that dual- frequency content and higher signal-to-noise ratio on the raw dual-sensor streamer field data. sensor streamer data acquired in all global locations to date, demonstrate significant resolution are inevitably and universally lost ■ At maximum frequency, the signal is improvements in low frequency content and faster than low frequencies during transmission consistently an additional 10 dB (a factor signal-to-noise ratio. Thus, velocity model through the earth. It is only possible to recover of 3 to 4) stronger than noise for the first building and multiple removal are greatly some of these high frequency amplitudes at couple of seconds TWT below water bottom, facilitated from day one of any data processing large target depths during data processing tapering to lower values as attenuation in project when dual-sensor data are available. if the signal at these depths is demonstrably the earth affects deeper targets. stronger than the noise component of the ■ The frequency range of signal is consistently It is worth noting that four unique wavefields seismic wavefield. an additional 55–65% greater for the first are created during the wavefield separation in couple of seconds TWT below water bottom, dual-sensor processing: up-going and down- After data processing to recover the up-going tapering to lower values as attenuation in going pressure, and up-going and down-going pressure wavefield, completely free of any the earth affects deeper targets. particle velocity. Whilst the up-going pressure receiver ghost effects, a cross-spectral analysis ■ The signal-to-noise ratio is greater for all wavefield is the primary product for velocity was pursued using methodology influenced by frequencies and for all TWT. picking, interpretation and inversion, the other White (1973). The signal and noise components wavefields can be used for various high-end of the up-going pressure wavefield were used Seismic impedance inversion comparison multiple removal and seismic imaging pursuits. to derive frequency spectra for various TWT windows. A systematic set of comparative A pre-stack relative impedance inversion Field tests and data analyses in analyses were then possible. was done for the 2007 and 2008 surveys Australia: The source ghost using a simultaneous sparse spike algorithm In comparison to conventional streamer data, (refer to Figure 9). The wavelet through the A new approach to seismic acquisition has the dual-sensor streamer data show significant target interval was extracted using a Bayesian also been tested in the southern Browse Basin improvements in low and high frequency signal inversion scheme, but the well log data were during 2008, in an effort to remove both content, less low and high frequency noise not used to derive any low frequency model. source ghost and receiver ghost effects from content, greater frequency range for signal at all Thus, only the seismic data contribute to towed streamer data. Of particular relevance in TWT, and greater signal-to-noise ratio of signal each impedance inversion. It is demonstrated the test area is the almost complete absence across all frequencies and for all TWT: that the dual-sensor data inversion result on conventional streamer data of coherent has contributed at least half an octave of seismic events at depths greater than about ■ At 10 Hz, the signal is consistently an low frequency impedance information in two seconds TWT. A 100 km 2D line was additional 12–15 dB (a factor of 4 to 5) comparison to the conventional streamer result, acquired three times in a spatially-coincident stronger than noise for all TWT. and has also yielded more high frequency manner during 2008: With a conventional April/May 2009 | PESA News | 39
  • 7. technology focus: streamer Fig. 11. When a conventional source array (upper) has all source elements fired simultaneously the (down-going) primary and ghost source wavefronts are parallel to the sea-surface, and effectively coupled by a constant time delay. In contrast, the staged firing of successively deeper source elements in the multi-level source array (lower) decouples the primary and ghost source wavefronts. The ghost source wavefront is no longer parallel to the sea-surface, but the primary source wavefront still is. source array and solid streamer in 2007, with of air gun elements at different depths. The strongly-represented at most locations along the a conventional source array and the dual- shallowest sub-array is fired first, sequentially line when the dual-sensor data is used to remove sensor streamer in 2008, and then finally with followed by the firing of successively deeper the effects of the receiver ghost and the multi- a prototype “multi-level” source array and source arrays. Thus, the source ghost wavefront level source array is used to reduce the effects of the dual-sensor streamer. The objectives in is decoupled from the primary source the source ghost. New plays are apparent in both this case were to address signal penetration wavefront. In the test described here, two the shallow and deeper data. The data quality problems by a combination of receiver sub-arrays were towed in vertical alignment at is in between the two results shown in Figure ghost removal and source ghost attenuation. depths of 12 and 18 m. The deeper sub-array 12, when a conventional source array is used Receiver ghost removal arises from the dual- was fired 4 ms after the shallow sub-array, with the dual-sensor streamer. Velocity picking sensor streamer processing, and source coincident in time with the arrival at 18 m was greatly facilitated by the improved data ghost attenuation arises from the multi-level depth of the primary source wavefront from the quality arising from the combination of the dual- source array. Again, true apples-for-apples 12 m sub-array. sensor streamer and the multi-level source. The comparisons were possible. output of this prototype source array was biased Reference to Figure 12 shows that data in towards low frequencies. Future implementations As illustrated schematically in Figure 11, the the target depth range of two to at least four will be designed to yield richer high frequency multi-level source array deploys sub-arrays seconds TWT are now both coherent and output too. Fig. 12. Raw PSTM stack comparison of the test line in the target time window of 2 – 4 s TWT. When the effects of both the receiver and source ghost are present on conventional data (left) the target events are very weak, incoherent and impossible to interpret. In contrast, the dual-sensor streamer + multi-level source result (right) demonstrates a profound improvement in event strength, spatial coherency and interpretability. 40 | PESA News | April/May 2009
  • 8. technology focus: streamer Conclusions References Quantitative analysis of dual-sensor data Carlson, D., Long, A., Söllner, W., Tabti, H., Posthumus, B.J., 1993, Deghosting using a acquired in a spatially-coincident manner with Tenghamn,R., and Lunde, N., 2007, Increased twin streamer configuration. Geophysical conventional streamer data on the North West resolution and penetration from a towed dual- Prospecting, 41, 267-286. Shelf of Australia demonstrate a four to five- sensor streamer. First Break, 25, 12, 71-77. fold boost in the low frequency signal content, Tenghamn, R., S. Vaage, and C. Borresen, 2007, A about three times the high frequency signal Monk, D.J., 1990, Wavefield separation of twin dual-sensor, towed marine streamer; its viable content (before the application of any spectral streamer data. First Break, 8, 3, 96-104. implementation and initial results: 77th Annual enhancement processing), and a higher signal- International Meeting, SEG, Expanded Abstracts, to-noise content for all frequencies and for all Özdemir, A.K., Caprioli, P., Özbek, A., Kragh, 989-993. depths. Furthermore, the frequency range of E., and Robertsson, J.O.A., 2008, Optimized signal is boosted by 55–65% through the main deghosting of over/under towed-streamer data White, R.E., 1973, The estimation of signal target interval. The low frequency boost arises in the presence of noise. The Leading Edge, 2, spectra and related quantities by means of from deeper streamer towing and the removal 190-199. the multiple coherence function. Geophysical of the effects of the receiver ghost in processing. Prospecting, 21, 4, 660-703. ■ The high frequency boost (up to at least 200 Hz) arises from the removal of the effects of the receiver ghost. Less noise is also recorded for deeper streamer towing, stabilising the wavefield separation processing. The high frequencies benefit the interpretation of subtle stratigraphic features and allow clearer imaging of features affected by transpressional fault reactivation. The pronounced low frequency boost has many benefits, including better velocity semblances (particularly in poor data areas affected by carbonates), more robust Q estimation, and significant signal penetration improvements for the seismic imaging of Triassic fault block plays and deeper dolerite intrusive features. Overall, the dual-sensor dataset has better resolution and is more interpretable at all depths. Pre-stack relative impedance inversion analysis demonstrates a significant improvement in low frequency content and character, and high frequency resolution. Dual-sensor data thus provides a bridge through the historical gap between the seismic bandwidth available for inversion and the low frequency model derived from well log data. Advertiser | Geokinetics Finally, a test using the dual-sensor streamer combined with a ‘multi-level’ source array also demonstrates the additional improvements derived from attenuating the source ghost, in addition to removing the receiver ghost. Data Instruction | Open in one of the most problematic seismic areas of the North West Shelf of Australia is improved. Collectively, the pioneering lessons learned on the NW Shelf Australia demonstrate the diverse opportunities possible when the receiver and source ghost effects can be robustly and accurately removed. Acknowledgements Thanks to ESSO Australia and BHP Petroleum for access to the well data used for wavelet extraction in the seismic inversion exercise. DownUnder GeoSolutions produced the inversion results. April/May 2009 | PESA News | 41