RDAP14 Poster: The blueprint as a map: designing better data services with service blueprinting
•
1 gefällt mir•6,502 views

Research Data Access & Preservation Summit March 26-28, 2014 San Diego, CA Ryan Clement, Reed College
Empfohlen

Empfohlen
Weitere ähnliche Inhalte
Mehr von ASIS&T
Mehr von ASIS&T (20)
RDAP14 Poster: The blueprint as a map: designing better data services with service blueprinting
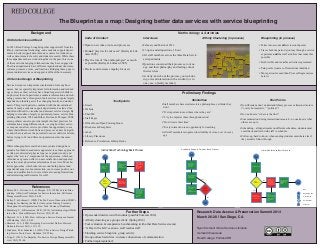
- 1. The Blueprint as a map: Designing better data services with service blueprinting Touchpoints • Email • Website • Chat/IM • Staff Pages • Office Hours/Open Tutoring Hours • Brochures & Pamphlets • mLab • Library Classroom • Reference, Circulation, & Help Desks Preliminary Findings Similarities • Staff members have similar service philosophies, yet think they don’t • “It’s important to meet them where they are” • “I try to empower them through education” • “Don’t waste their time” • “Every interaction is an opportunity for teaching • All staff members recognized inevitability of cross-over in cover- age Pain Points • Non-librarians don’t understand library process or liaison structure (“overly bureaucratic,” “political”) • No one knows: “where is the line?” • Communication during interactions/research - no one knows what others are up to • Scheduling - all departments on different schedules, students must email back and forth with staff to schedule • Follow-up: hard to know when sending student somewhere else if they actually follow through start! Reconvene with user, show process & tool, explain/ instruct in WHY, run trial(s) with user to judge efficacy.! Staff goes to outside resources (e.g. network, web forums, documentation) to find possible solutions.! ! Appt. – ! Further Discussion, Sketching out solutions, investigating needs! ! ! Email to set up appt. & get details – back and forth! ! ! First Meeting – Informal Discussion! More Contact Needed?! end! Yes! No! Instruc(onal Technology Basic Process start! ! ! Email student with information and HOW/WHY of search.! ! Staff goes to outside resources (e.g. network, library databases, colleauges) to find possible solutions.! ! Appt. – ! Further discussion, reference interview, setting priorities and assessing needs! ! ! Email to set up appt. & get details – back and forth! ! ! ! Email from student! ! Appt. Needed?! end! Yes! No! Library Reference Basic Process start! ! Appt. – ! Further Discussion, Sketching out solutions, investigating needs! ! ! Set up appointment to meet – using YouCanBookMe! ! ! Contact with student (email, in person after workshop)! More Contact Needed?! end! Yes! No! Academic Support Services Basic Process Key! • Beginning & End! ! • Process Step! ! • Decision Point! ! • Pain Point! Code of Conduct • Open to new ideas, tools, and processes • Do not “play devil’s advocate” (Kelley & Litt- man, 2005) • Play the role of “the anthropologist” as much as possible (Kelley & Littman, 2005) • Practice and increase empathy for users Interviews • February and March of 2013 • 13 open-ended questions, 1 hour • All staff members across the three Data Servic- es departments • Questions concerned their processes, tool us- age, and their philosophy and feelings about their services. • Activity: sketch out the process you took dur- ing a recent interaction with a student (or, in one case, a faculty member) Affinity Clustering (in process) Blueprinting (in process) • Takes into account all service touchpoints • Traces both the patron’s journey through a service experience and the staff activities that make this possible • Both visible and invisible activities represented • Pain points (sources of frustration) identified • More patron-focused than Process Diagrams (see below) Background On Data Services at Reed In 2013, Reed College brought together support staff from the library, instructional technology, and academic support depart- ments to better support data-intensive courses for students, as well as data-intensive faculty and student research. While these three departments have worked together in the past, this is one of the most wide-ranging collaborations they have engaged in. The three departments have different organizational structures, cultures, processes, tools, and locations. Bridging these gaps to present unified services and support is difficult but necessary. On Service Design & Blueprinting Service design is an important consideration for many busi- nesses, but is especially important for information and technol- ogy centers, as their services have broad impacts with little to no physical form. In particular, academic information and tech- nology centers have often grown their services in spurts largely dependant on funding as well as changing faculty and student needs. This growth pattern, combined with the decentralized nature of many academic support departments, has led ad hoc and often difficult to visualize (and discuss) service design. By helping to visualize a largely experiential process, service blue- printing (Shostack, 1984 and Bitner, Ostrom, & Morgan, 2008, among others) can also provide insight into best practices for collaboration among different units -- seeing how their servic- es map out can allow service providers the opportunity to see where their different workflows and process can best fit togeth- er, and what areas have the potential to cause conflict or failure, before trying to fit two different organizations into the same mold. While ethnographic research and user-centered design have gained a foothold in academic support services, these approach- es often are directed at physical spaces or products only, and neglect the “service” component of the experience, which can often have as great an effect on user satisfaction and repeated use as the more physical manifestations of a service. More ho- listic approaches, which take into account both physical and experiential aspects of an interaction, can increase positive out- comes and satisfaction for users, while also easing frustrations and minimizing inefficiencies for staff. References • Bitner, M. J., Ostrom, A. L., & Morgan, F. N. (2008). Service Blue- printing: A Practical Technique for Service Innovation. California Management Review, 50(3), 66–94. • Kelley, T. & Littman, J. (2005). The Ten Faces of Innovation: IDEO’s Strategies for Beating the Devil’s Advocate & Driving Creativity Throughout Your Organization. New York: Currency/Doubleday. • Madsbjerg, C., & Rasmussen, M. B. (2014). An Anthropologist Walks into a Bar... Harvard Business Review, 92(3), 80–88. • Shostack, G. L. (1982). How to Design a Service. European Journal of Marketing, 16(1), 49–63. • Shostack, G. L. (1984). Designing Services that Deliver. Harvard Business Review, 62(1), 133–139. • Stickdorn, M. & Schneider, J. (2011). This is Service Design Think- ing: Basics, Tools, Cases. Hoboken, N.J: Wiley. • Tripp, C. (2013). No Empathy–No Service. Design Management Re- view, 24(3), 58–64. Further Steps • Open-ended interviews with students (possible Summer 2014) • Affinity clustering as a group activity (Spring 2014) • Tool evaluation & comparative benchmarking (with other Data Services teams) • “A Day in the Life” sessions - staff teaches staff • Finishing service blueprint - group activity • Group outreach activities - increase cohesiveness of communication • Further implementation? Methodology & Activities Ryan Clement | Data Services Librarian clementr@reed.edu Reed College, Portland OR Research Data Access & Preservation Summit 2014 March 26-28 | San Diego, CA