Prof. arvind kumar_air_pollution
•Als PPSX, PDF herunterladen•
2 gefällt mir•2,283 views

Air pollution

Empfohlen
Weitere ähnliche Inhalte
Was ist angesagt?
Was ist angesagt? (20)
Andere mochten auch
Andere mochten auch (16)
Ähnlich wie Prof. arvind kumar_air_pollution
Ähnlich wie Prof. arvind kumar_air_pollution (20)
Mehr von Arvind Kumar
Mehr von Arvind Kumar (20)
Kürzlich hochgeladen
Kürzlich hochgeladen (20)
Prof. arvind kumar_air_pollution
- 3. The Atmosphere Gas Concentration, % by volume Nitrogen 78.1 Oxygen 21.0 Argon 0.9 Carbon dioxide* 3.3 x 10⁻² Hydrogen 5 x 10⁻⁵ Ozone 1 x 10⁻⁶ Methane* 2 x 10⁻⁴ 9/20/2014 AIR POLLUTION 3
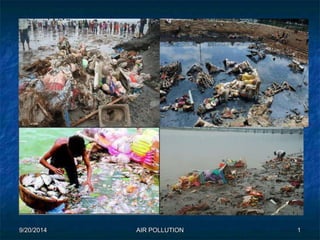
- 5. Air Pollution: Sources, Effects & Remediation Fresh air is good if you do not take too much of it; most of the achievements and pleasures of life are in bad air. Oliver Wendell Holmes Definition: contamination of the air by noxious gases and minute particles of solid and liquid matter (particulates) in concentrations that endanger health-Air pollution only occurs outdoors 9/20/2014 AIR POLLUTION 2
- 8. Criteria Air Pollutants: Air Quality Index (AQI) Do we have a way to determine local air quality? AQI/PSI (formerly Pollutants Std Index) Assigns numerical rating to air quality of six criteria pollutants (TSP, SO2, CO, O3, NO2, and TSP*SO2) API Value Air Quality Descriptor 0-50 Good 51-100 Moderate 101-199 Unhealthful 200-299 Very unhealthful 300 Hazardous 9/20/2014 AIR POLLUTION 8
- 9. Sources of Air Pollution Natural Sources (Biogenic sources) Volcanoes Coniferous forests Forest fires Pollens Spores Dust storms Hot springs Anthropogenic Fuel combustion - Largest contributor Chemical plants Motor vehicles Power and heat generators Waste disposal sites Operation of internal-combustion engines 9/20/2014 AIR POLLUTION 9
- 10. 9/20/2014 AIR POLLUTION 10
- 11. Sources of Outside Air Pollution Combustion of gasoline and other hydrocarbon fuels in cars, trucks, and airplanes Burning of fossil fuels (oil, coal, and dinosaur bones) Insecticides Herbicides Everyday radioactive fallouts Dust from fertilizers Mining operations Livestock feedlots 9/20/2014 AIR POLLUTION 11
- 12. Physical Forms of an Air Pollutant Gaseous form o Sulfur dioxide o Ozone o Hydro-carbon vapors Particulate form o Smoke o Dust o Fly ash o Mists 9/20/2014 AIR POLLUTION 12
- 13. CLASSICAL AIR POLLUTANTS Nitrogen dioxide Ozone and other photochemical oxidants Particulate matter Sulfur dioxide 9/20/2014 AIR POLLUTION 13
- 14. A major form of air pollution is emissions given off by vehicles. 9/20/2014 AIR POLLUTION 14
- 15. What’s in smog particulates (especially lead) nitrous oxides potassium Carbon monoxide Other toxic chemicals 9/20/2014 AIR POLLUTION 15
- 16. Sources of Indoor pollution Efficient insulation Bacteria Molds and mildews Viruses animal dander and cat saliva plants house dust Mites Cockroaches pollen 9/20/2014 AIR POLLUTION 16
- 17. Effects on the environment Acid rain Ozone depletion Global warming In human population- respiratory problems, allergies, strengthens lugs, and a risk for cancer 9/20/2014 AIR POLLUTION 17
- 18. Comparative Photos Showing Yuschenko Immediately Prior To And Immediately Following Dioxin Poisoning http://en.wikipedia.org/wiki/Viktor_Yushchenko (Note: this is an extreme case of dioxin poisoning) 9/20/2014 AIR POLLUTION 18
- 19. = NO3 H+ SO4 http://www.umac.org/ocp/4/info.html - 9/20/2014 AIR POLLUTION 19
- 20. 9/20/2014 AIR POLLUTION 20
- 21. Acid rain contains high levels of sulfuric or nitric acids contaminate drinking water and vegetation damage aquatic life erode buildings Alters the chemical equilibrium of some soils 9/20/2014 AIR POLLUTION 21
- 22. 9/20/2014 AIR POLLUTION 22
- 23. 9/20/2014 AIR POLLUTION 23
- 24. Strategies Air Quality Management Plan Development of new technology- electric cars, cleaner fuels, low nitrogen oxide boilers and water healers, zero polluting paints Use of natural gas Carpooling Follow the laws enacted 9/20/2014 AIR POLLUTION 24
- 25. Urban Emissions •There are small emissions of NOx from industrial processes •The main emissions are from combustion. •There is negligible nitrogen in gasoline or diesel fuels so the nitrogen oxides arise from the N2 and O2 in the air. •Sulphur dioxides arise from the sulphur present in most fuels. •Particulate matter describes matter below 10μm aerodynamic diameter. 9/20/2014 AIR POLLUTION 25
- 26. 9/20/2014 AIR POLLUTION 26
- 27. Role of Engines and Fuel Different engines and fuel combinations give out different emissions in different quantities. Some engines have catalysts which effectively remove part of the harmful gases. 9/20/2014 AIR POLLUTION 27
- 28. Catalytic Converters and Particle Traps Catalytic converters can be fitted to cars to reduce NOx emissions. CO + HC + NOx H2O + N2 + CO2 Platinum Honeycomb Particle traps can be used to reduce PM10 and NOx, but the effectiveness is severely reduced if the fuel the vehicle burns has a high sulphur content. The major target in the battle for cleaner cities is diesel. 9/20/2014 AIR POLLUTION 28
- 29. 9/20/2014 AIR POLLUTION 29
- 30. STRATEGIE The Clean Air approach: Based on scientific knowledge Using best available, quality-controlled real-world data With close involvement of stakeholders: 1. Project future emissions and air quality resulting from full implementation 2. Explore scope and costs for further measures 3. Analyze cost-effective policy scenarios 4. Estimate benefits of policy scenarios 9/20/2014 AIR POLLUTION 30
- 31. Main pollutants used in the CAFE assessment 9/20/2014 AIR POLLUTION 31
- 32. Particulate Matter (PM ) Pollution - Traffic emissions including diesel engines - Small combustion sources burnng coal and wood - Reductions of SO2, N0x, NH3 and VOC 9/20/2014 AIR POLLUTION 32
- 33. Ground level ozone - VOC control to reduce ozone in cities - N0x reduction from traffic - Control of N0x emissions from ships - Methane reduction 9/20/2014 AIR POLLUTION 33
- 35. Ozone Formed 9/20/2014 AIR POLLUTION 35
- 36. 9/20/2014 AIR POLLUTION 36
- 37. Climate Problems/Global Change/Air Pollution 21st Century Greenhouse gases: global warming (CO2, CFCs, NOx, CH4, H20) Air pollution: NOx, SO2, haze, aerosols, O3, heavy metals (Hg, Pb, Cd), organic compounds Ozone depletion: O3 9/20/2014 AIR POLLUTION 37
- 38. 9/20/2014 38
- 39. 9/20/2014 AIR POLLUTION 39
- 40. 9/20/2014 AIR POLLUTION 40
- 41. 9/20/2014 AIR POLLUTION 41
- 42. 9/20/2014 AIR POLLUTION 42
- 43. 9/20/2014 AIR POLLUTION 43
- 44. 9/20/2014 AIR POLLUTION 44
- 45. Industrial Pollution Control System Solution of the Pollution is Dilution 9/20/2014 AIR POLLUTION 45
- 46. Particulate Matter Pollutant Particulate Matter (PM10) Particulate Matter (PM2.5) 9/20/2014 AIR POLLUTION 46
- 47. 9/20/2014 AIR POLLUTION 47
- 48. 9/20/2014 AIR POLLUTION 48
- 49. Two possible fates Factors affecting fate Aerodynamic properties Physiological behavior Methods of Deposition Impaction* Interception* Diffusion* Electrostatic Attraction Gravitational Settling 9/20/2014 AIR POLLUTION 49
- 50. INCINERATOR organic compounds from process industries are destroyed at high temperature (590 and 650oC & 1800 to 2200oF for most hazardous waste) Oxidizing organic compounds containing sulfur or halogens produce unwanted pollutants such as sulfur dioxide, hydrochloric acid, hydrofluoric acid, or phosgene 9/20/2014 AIR POLLUTION 50
- 51. SRCUBBERS 9/20/2014 AIR POLLUTION 51
- 52. 9/20/2014 AIR POLLUTION 52
- 53. Control Techniques Gravity settling chamber Mechanical collectors Particulate wet scrubbers Electrostatic precipitators Fabric filters 9/20/2014 AIR POLLUTION 53
- 54. Fabric Filter High collection Efficiency over a broad range of particles sizes Application: Cement kiln, Foundries, Steel furnaces and Grain handling plants 9/20/2014 AIR POLLUTION 54
- 55. 9/20/2014 AIR POLLUTION 55
- 56. 9/20/2014 AIR POLLUTION 56
- 57. GRAVITY SETTLING CHAMBERS The removal of larger-sized particles, e.g., 40–60μm in diameter Velocities (in the range of 1–10 ft/s) 9/20/2014 AIR POLLUTION 57
- 58. 9/20/2014 AIR POLLUTION 58
- 59. 9/20/2014 AIR POLLUTION 59
- 60. 9/20/2014 AIR POLLUTION 60
- 61. 9/20/2014 AIR POLLUTION 61
- 62. 9/20/2014 AIR POLLUTION 62
- 63. 9/20/2014 AIR POLLUTION 63
- 64. 9/20/2014 AIR POLLUTION 64
- 65. CYCLONES Large diameter cyclones have good collection efficiencies for particle 40- 50μm dia <23 cm diameter cyclones have good collection efficiencies for particle 15- 20μm dia 9/20/2014 AIR POLLUTION 65
- 66. 9/20/2014 AIR POLLUTION 66
- 67. 9/20/2014 AIR POLLUTION 67
- 68. 9/20/2014 AIR POLLUTION 68
- 69. 9/20/2014 AIR POLLUTION 69
- 70. 9/20/2014 AIR POLLUTION 70
- 71. 9/20/2014 AIR POLLUTION 71
- 72. 9/20/2014 AIR POLLUTION 72
- 73. 9/20/2014 AIR POLLUTION 73
- 74. 9/20/2014 AIR POLLUTION 74
- 75. Device Min. Particle size μm Efficiency % (mass basis) Advantage Disadvantages Gravitational settler >50 <50 •Low pressure loss, •Simplicity of design •maintenance •Much space required •Low collection efficiency Centrifugal collector 5-25 50-90 •Simplicity of design and maintenance •Little floor space required •Dry continuous disposal of collected dusts •Low to moderate pressure loss •Handles high dust loadings •Temperature independent •Much head room required •Low collection efficiency for small particles •Sensitive to variables dust loading and flow rates 9/20/2014 AIR POLLUTION 75
- 76. ELECTROSTATIC PRECIPITATORS Extremely efficient for wide range of particle sizes; even submicron size 9/20/2014 AIR POLLUTION 76
- 77. 9/20/2014 AIR POLLUTION 77
- 78. 9/20/2014 AIR POLLUTION 78
- 79. 9/20/2014 AIR POLLUTION 79
- 80. 9/20/2014 AIR POLLUTION 80
- 81. 9/20/2014 AIR POLLUTION 81
- 82. 9/20/2014 AIR POLLUTION 82
- 83. 9/20/2014 AIR POLLUTION 83
- 84. 9/20/2014 AIR POLLUTION 84
- 85. 9/20/2014 AIR POLLUTION 85
- 86. Wind Rose how wind speed and direction are typically distributed at a particular location The directions of the rose with the longest spoke show the wind direction with the greatest frequency 9/20/2014 AIR POLLUTION 86
- 87. 9/20/2014 AIR POLLUTION 87
- 88. 9/20/2014 AIR POLLUTION 88
- 89. Applications Urban Planning Siting of industrial locations including chimney & other air polluting source Industrial zoning & industrial estate planning Air pollution modeling. Disaster Management Street layout Ventilation of urban, industrial and housing Environmental Impact Assessment study. Oceanography Wind Energy Agriculture Engineering Ambient Air Monitoring Noise Impact Modeling 9/20/2014 AIR POLLUTION 89
- 90. 9/20/2014 AIR POLLUTION 90
- 91. 9/20/2014 AIR POLLUTION 91
- 92. Parameters Affecting Dispersion wind speed As the wind speed increases, the plume becomes longer and narrower; the substance is carried downwind faster but is diluted faster by a larger quantity of air. 9/20/2014 AIR POLLUTION 92
- 93. 9/20/2014 AIR POLLUTION 93
- 94. ground conditions Ground conditions affect the mechanical mixing at the surface and the wind profile with height. Trees and buildings increase mixing, whereas lakes and open areas decrease it. 9/20/2014 AIR POLLUTION 94
- 95. height of the release above ground level The release height significantly affects ground-level concentrations. As the release height increases, ground-level concentrations are reduced because the plume must disperse a greater distance vertically. 9/20/2014 AIR POLLUTION 95
- 96. momentum and buoyancy of the initial material released The buoyancy and momentum of the material released change the effective height of the release. 9/20/2014 AIR POLLUTION 96
- 97. Gases cool as they Neutral mix and dilute with COOl air . Neutral Buoyancy Smokestack plume demonstrating initial buoyant rise of hot gases 9/20/2014 AIR POLLUTION 97
- 98. 9/20/2014 98
- 99. Calculation of effective stack height Using following data a) Physical stack is 203 m tall with 1.07m diameter b) Wind velocity is 3.56 m/s c) Air temperature is 13 oC d) Barometric pressure is 1000 millibars e) Stack gas velocity is 9.14 m/s f) Stack gas temperature is 149oC. 9/20/2014 AIR POLLUTION 99
- 100. Atmospheric stability Atmospheric stability relates to vertical mixing of the air. During the day, the air temperature decreases rapidly with height, encouraging vertical motions. At night the temperature decrease is less, resulting in less vertical motion. 9/20/2014 AIR POLLUTION 100
- 101. 9/20/2014 AIR POLLUTION 101
- 102. Atmospheric stability … Dry adiabatic lapse rate (stable, neutral atmosphere) dT - 1 C 100 m dZ dA P Pd + P dZ Natural balance between hydrostatic head, g dA dZ, and pressure forces 9/20/2014 AIR POLLUTION 102
- 103. 9/20/2014 AIR POLLUTION 103
- 104. Dry adiabatic lapse rate (dry adiabat, DALR or unsaturated lapse rate): lapse rate of unsaturated air (i.e., air with a relative humidity of less than 100%) Wet adiabatic lapse rate (wet adiabat, saturated lapse rate, SALR, moist adiabatic lapse rate or MALR) : the air parcel is saturated and, because of the release of the heat of vaporization, the rate of cooling will decrease to what is known as the wet adiabatic lapse rate. Environmental lapse rate (ELR, prevailing lapse rate or ambient lapse rate) : The actual real-world profile of temperature versus altitude that exists at any given time and in any given geographical location is called the environmental lapse rate 9/20/2014 AIR POLLUTION 104
- 105. 9/20/2014 AIR POLLUTION 105
- 106. 9/20/2014 AIR POLLUTION 106
- 107. the atmospheric stability can be characterized by these four categories A very stable atmosphere is one that has very little, if any, vertical motion of the air. A stable atmosphere is one that discourages vertical motion but does have some motion of the air. An unstable atmosphere is one that encourages continual vertical motion of the air, upwards or downwards. A neutral atmosphere is one that neither discourages nor encourages vertical motion of the air and is often referred to as conditionally stable. 9/20/2014 AIR POLLUTION 107
- 108. Lapse Rate Effect ELR > 0 1 the atmospheric temperature increases with altitude. There is essentially no vertical turbulence and the atmosphere is said to be very stable or extremely stable. ELR> – 5.5 K/km 2 some small amount of vertical turbulence and the atmosphere is said to be stable. It is also referred to as being sub-adiabatic. MALR> ELR> DALR 3 the atmosphere is said to be neutral. *U.S. Standard Atmosphere of – 6.5 K/km in most cases ELR < DALR 4 there turbulence in the atmosphere and it is said to be unstable. It is also referred to as being super-adiabatic . ELR= 0 the atmosphere would be in an isothermal condition (no change of temperature with altitude) and would be also be said to be very stable. 9/20/2014 AIR POLLUTION 108
- 109. 9/20/2014 AIR POLLUTION 109
- 110. 9/20/2014 AIR POLLUTION 110 A “buoyant” atmosphere et aR espaL t hgi e H Super-adiabatic lapse rate: t hgi e H t hgi e H 001 l art ueN 0 001 22 12 02 cit abai dA yr D cit abai dar epuS meT t hgi e H er ut ar ep meT gni pooL
- 111. 9/20/2014 AIR POLLUTION 111 er ut ar ep meT t hgi e H Sub-adiabatic lapse rate: t hgi e H t hgi e H t hgi e H t hgi e H er ut ar ep meT er ut ar ep meT gni nnaF gni no C gni pooL er ut ar ep meT t hgi e H t hgi e H 001 0 001 22 12 02 l a mr eht osI 0 0 001 22 12 02 l art ueN 001 22 12 02 cit abai dabuS 22 12 02 er ut ar ep meT er ut ar ep meT
- 112. 9/20/2014 AIR POLLUTION 112
- 113. 9/20/2014 AIR POLLUTION 113
- 114. 9/20/2014 AIR POLLUTION 114
- 115. 9/20/2014 AIR POLLUTION 115
- 116. 9/20/2014 AIR POLLUTION 116
- 117. 9/20/2014 AIR POLLUTION 117
- 118. 9/20/2014 AIR POLLUTION 118
- 119. 9/20/2014 AIR POLLUTION 119
- 120. 9/20/2014 AIR POLLUTION 120
- 121. 9/20/2014 AIR POLLUTION 121
- 122. 9/20/2014 AIR POLLUTION 122
- 123. atmosphere’s dispersive capability = maximum mixing depth*the average wind speed. This product is known as the ventilation coefficient (m2/s) . Values of ventilation coefficient less than about 6000 m2/s are considered indicative of high air pollution potential 9/20/2014 AIR POLLUTION 123
- 124. 9/20/2014 AIR POLLUTION 124
- 125. 9/20/2014 AIR POLLUTION 125
- 126. 9/20/2014 AIR POLLUTION 126
- 127. 9/20/2014 AIR POLLUTION 127
- 128. 10000 1000 100 10 A B C D E F z, m 0.1 1 10 100 Downwind distance, km y, m 1000 A 100 10 1 B C D E F 0.1 1 10 100 Downwind distance, km A= Extremely unstable; B-moderately unstable; C-Slightly unstable; D-Neutral; E-Slightly stable; F- Moderately stable 9/20/2014 AIR POLLUTION 128
- 129. Pasquill Stability classes A - F A= Extremely unstable; B-moderately unstable; C-Slightly unstable; D-Neutral; E-Slightly stable; F- Moderately stable 9/20/2014 AIR POLLUTION 129
- 130. 9/20/2014 AIR POLLUTION 130
- 131. 1 Gaussian concentration distribution H 1 Q x,y σ H 1 Plume centre line Concentration exp Q x, 0 π u σ σ σ Q x, 0 π u σ σ Location Maximum concentration 9/20/2014 AIR POLLUTION 2 2 z y z C Effective stack height is zero z y C 2 y 2 z y z y 2 exp σ 2 exp π u σ σ C H 2 z 131
- 132. The maximum ground level concentration along the x axis can be calculated σ 2Q max σ z y 2 r e π u H C 9/20/2014 AIR POLLUTION 132
- 133. Determining Max. ground level concentration: A power plant burns 5.45 tonnes of coal/hr and discharges the combustion products through a stack that has an effective height of 75 m. The coal has sulfur content of 4.2 %, and the wind velocity at the top of the stack is 6 m/s. The atm conditions are moderately to slightly stable. Determine Max. ground level concentration of SO2 and the distance from the stack at which the maximum occurs Determine the ground-level concentrations at a distance of 3 km downwind at the centre line of the plume and at a crosswind distance of 0.4 km on either side of the centerline. 9/20/2014 AIR POLLUTION 133
- 134. 9/20/2014 AIR POLLUTION 134
- 135. 9/20/2014 AIR POLLUTION 135 Thank you for kind attention Thank you for kind attention