Digital Identity is Under Attack: FIDO Paris Seminar.pptx
Bren 3 equipment procedures and sampling
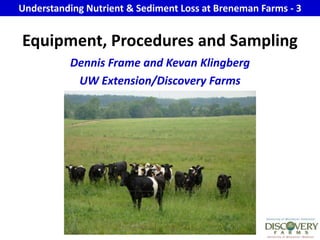
1. Understanding Nutrient & Sediment Loss at Breneman Farms - 3 Equipment, Procedures and Sampling Dennis Frame and Kevan Klingberg UW Extension/Discovery Farms
2. BrenemanOn-Farm Research On-farm research was conducted on the Breneman farm to investigate environmental challenges and opportunities for grass-based dairies on the Wisconsin landscape, 2002-2007. Surface water quality monitoring was conducted to measure sediment and nutrient loads in runoff water from paddocks that were used for regular rotational grazing, then again used to seasonally out-winter the dairy herd.
3. Water Quality Monitoring Grazing-based dairy. 42 paddocks. 80 crossbred dairy cows + young stock. (1.6 acres / AU) Coarse textured soil Out-winter cows and older heifers Columbia County, WI
4. Water Quality Monitoring Total watershed = 142.7 acres Area east of road as well as western wooded area were determined to contribute negligible runoff towards watershed outlet. Monitored acreage adjusted to 28.5 acres. Monitored area: small watershed where cattle are grazed through the season as well as out-wintered. (middle area)
5. Water Quality Monitoring To fully assess annual nutrient and sediment losses, the UW-Discovery Farms Program conducts year-round monitoring. Surface water monitoring on this farm was a partnership between the Brenemans, UW – Extension and UW-Biological Systems Engineering Department.
6. Water Quality Monitoring Equipment was selected and procedures developed and implemented to provide high-quality, agricultural runoff and water quality data during the full range of weather conditions.
7. Water Quality Monitoring Faculty and graduate students from the University of Wisconsin Biological Systems Engineering Department worked cooperatively with the Discovery Farms Program to collect hydrologic and water quality data from a small watershed on the Breneman farm where cattle were out-wintered, October 2005 to September 2007.
8. 24-Bottle ISCO Sampler (non-refrigerated) Plywood wing wall 2-ft Pre-Rated H flume Monitoring Equipment at Breneman Farms, Rio, WI
9. Monitoring Stations A simple wooden enclosure, elevated 3 ft off the ground. Initial power was battery. Electricity installed to power heat tapes, eventually needed to ensure quality data collection through winter times. Enclosure padlocked to prevent unauthorized access.
10. Monitoring Stations A 2.0-foot pre-rated, fiberglass H-flume was selected to measure surface water runoff volume (discharge) based on the drainage area and the general terrain.
11. Monitoring Stations The flume was attached to a thick sheet (¾-inch) of treated plywood, installed perpendicular to the flow in the intermittent stream. The wing wall was designed to funnel all the surface water through the flume so the discharge could be measured.
12. Monitoring Stations An automated, non-refrigerated, 24-bottle ISCO® 6712 sampler was used to collect surface water runoff samples.
13. Monitoring Stations Samples were pumped from the H-flume through a Teflon – lined sample intake line into one-liter polypropylene bottles housed in the ISCO canister. Flow and sample data were stored internally on the ISCO 6712 sampler. Hobo data loggers were used to read and store precipitation and air temperature data.
14. Sample Collection A runoff event was defined as the time from the onset of rainfall- or snowmelt-induced surface water runoff to the time when runoff ceased. Automatic sampler was programmed to take samples when runoff depth in the flume exceeded 1 inch.
15. Sample Collection During sampling cycles, water was collected at uniform 30-minute intervals until the sampler became disabled, i.e.: Runoff dropped was below 1 inch, or All 24 bottles were filled. Flow data was recorded every minute during runoff events.
16. Sample Collection Water samples were generally retrieved within 24 hours of the end of a runoff event. Upon collection, sample quantity and appearance was recorded, and equipment accuracy was checked and noted.
17. Sample Collection Samples were labeled, placed in coolers with ice and transported to the UW-Stevens Point Water and Environmental Analysis Lab (WEAL) for analysis.
18. Sample Collection The lab tested for the following parameters: suspended sediment and total dissolved solids nitrogen: nitrate/nitrite, ammonium and total kjeldahl nitrogen unfiltered phosphorus: total P unfiltered and dissolved reactive P chloride
19. Maintenance Maintenance was vital to accurately measure the annual quantity and quality of surface water runoff from the monitoring station. During spring, summer and fall, the station was periodically maintained by mowing around the gauge and along the wing wall.
20. Maintenance More maintenance was needed for monitoring during winter than for the rest of the year. During winter, snow and ice can fill the H-flume and downstream channel, causing backwater conditions if runoff occurred.
21. Maintenance Frequent maintenance visits were necessary to keep the flume free of ice and snow and to provide maintenance for other equipment. Snow and ice were removed from the H-flume prior to anticipated wintertime runoff events. In most cases, a trench was dug in the snow upstream and downstream of the H-flume.
22. Information Available For more detailed information on sampling materials and methods see: Environmental Outcomes Originating from Over-Wintering Areas on Management Intensive Rotational Grazing Pasture systems. Amanda D. Crowe’s thesis for Master of Science, Biological Systems Engineering, University of Wisconsin – Madison, 2006. http://www.uwdiscoveryfarms.org
23. Information Available For more detailed information on sampling materials and methods used on other UW-Discovery Farms projects see: Methods of Data Collection, Sample Processing, and Data Analysis for Edge-of-Field, Streamgaging, Subsurface-Tile, and Meteorological Stations at Discovery Farms and Pioneer Farm in Wisconsin, 2001–7. http://wi.water.usgs.gov/pubs/index.html.
24. Information Available This presentation is the third in a series of seven developed to provide the data and information collected at Breneman Farms. All of the presentations, factsheets and briefs are available on the UW - Discovery Farms website. http://www.uwdiscoveryfarms.org
25.
26. There are eight briefs available for Breneman Farms (2 page summaries of the factsheets).