Stock Market Brief Deck for "this does not happen often".pdf
The right role for multiples in valuation mck quarterly
1. Finanzas II – Calviño/Alonso – The Right Role For Multiples In Valuation
The right role for multiples in valuation
A properly executed multiples analysis can make financial forecasts more accurate.
Marc Goedhart, Timothy Koller, and David Wessels
The McKinsey Quarterly, Web exclusive, March 2005
Senior executives know that not all valuation methods are created equal. In our experience, managers dedicated
to maximizing shareholder value gravitate toward discounted-cash-flow (DCF) analyses as the most accurate and
flexible method for valuing projects, divisions, and companies. Any analysis, however, is only as accurate as the
forecasts it relies on. Errors in estimating the key ingredients of corporate value—ingredients such as a company's
return on invested capital (ROIC), its growth rate, and its weighted average cost of capital—can lead to mistakes
in valuation and, ultimately, to strategic errors.
We believe that a careful analysis comparing a company's multiples with those of other companies can be useful in
making such forecasts, and the DCF valuations they inform, more accurate. Properly executed, such an analysis
can help a company to stress-test its cash flow forecasts, to understand mismatches between its performance and
that of its competitors, and to hold useful discussions about whether it is strategically positioned to create more
value than other industry players are. As a company's executives seek to understand why its multiples are higher
or lower than those of the competition, a multiples analysis can also generate insights into the key factors creating
value in an industry.
Yet multiples are often misunderstood and, even more often, misapplied. Many financial analysts, for example,
calculate an industry-average price-to-earnings ratio and multiply it by a company's earnings to establish a "fair"
valuation. The use of the industry average, however, overlooks the fact that companies, even in the same
industry, can have drastically different expected growth rates, returns on invested capital, and capital structures.
Even when companies with identical prospects are compared, the P/E ratio itself is subject to problems, since net
income commingles operating and nonoperating items. By contrast, a company can design an accurate multiples
analysis that provides valuable insights about itself and its competitors.
When multiples mislead
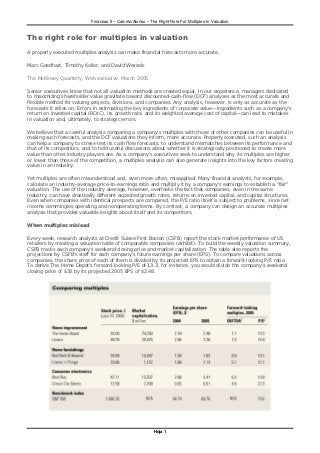
Every week, research analysts at Credit Suisse First Boston (CSFB) report the stock market performance of US
retailers by creating a valuation table of comparable companies (exhibit). To build the weekly valuation summary,
CSFB tracks each company's weekend closing price and market capitalization. The table also reports the
projections by CSFB's staff for each company's future earnings per share (EPS). To compare valuations across
companies, the share price of each of them is divided by its projected EPS to obtain a forward-looking P/E ratio.
To derive The Home Depot's forward-looking P/E of 13.3, for instance, you would divide the company's weekend
closing price of $33 by its projected 2005 EPS of $2.48.
Hoja 1
2. Finanzas II – Calviño/Alonso – The Right Role For Multiples In Valuation
But which companies are truly comparable? For the period covered in the exhibit, Home Depot and its primary
competitor, Lowe's, traded at nearly identical multiples. Their P/E ratios differed by only 8 percent, and their
enterprise-value-to-EBITDA (earnings before interest, taxes, depreciation, and amortization) ratios1 by only 3
percent. But this similarity doesn't extend to a larger set of hard-lines retailers, whose enterprise multiples vary
from 4.4 to 9.9. Why such a wide range? Investors have different expectations about each company's ability to
create value going forward, so not every hard-lines retailer is truly comparable. To choose the right companies,
you have to match those with similar expectations for growth and ROIC.
A second problem with mutiples is that different ones can suggest conflicting conclusions. Best Buy, for instance,
trades at a premium to Circuit City Stores when measured using their respective enterprise-value multiples (6.3
versus 4.4) but at a discount according to their P/E ratios (13.8 versus 22.3). Which is right—the premium or the
discount? It turns out that Circuit City's P/E multiple isn't meaningful. In July 2004, the total equity value of this
company was approximately $2.7 billion, but it held nearly $1 billion in cash. Since cash generates very little
income, its P/E ratio is high; a 2 percent after-tax return on cash translates into a P/E of 50. So the extremely
high P/E of cash artificially increases the company's aggregate P/E. When you remove cash from the equity value
($2.7 billion – $1 billion) and divide by earnings less after-tax interest income ($122 – $8), the P/E drops from
22.3 to 14.9.
Finally, different multiples are meaningful in different contexts. Many corporate managers believe that growth
alone drives multiples. In reality, growth rates and multiples don't move in lockstep.2 Growth increases the P/E
multiple only when combined with healthy returns on invested capital, and both can vary dramatically across
companies. Executives and investors must pay attention to growth and to returns on capital or a company might
achieve its growth objectives but forfeit the benefits of a higher P/E.
The well-tempered multiple
Four basic principles can help companies apply multiples properly: the use of peers with similar ROIC and growth
projections, of forward-looking multiples, and of enterprise-value multiples, as well as the adjustment of
enterprise-value multiples for nonoperating items.
1. Use peers with similar prospects for ROIC and growth
Finding the right companies for the comparable set is challenging; indeed, the ability to choose appropriate
comparables distinguishes sophisticated veterans from newcomers. Most financial analysts start by examining a
company's industry—but industries are often loosely defined. The company might list its competitors in its annual
report. An alternative is to use the Standard Industrial Classification codes published by the US government. A
slightly better (but proprietary) system is the Global Industry Classification Standard (GICS) recently developed
by Morgan Stanley Capital International and Standard & Poor's.
With an initial list of comparables in hand, the real digging begins. You must examine each company on the list
and answer some critical questions: why are the multiples different across the peer group? Do certain companies
in it have superior products, better access to customers, recurring revenues, or economies of scale? If these
strategic advantages translate into superior ROICs and growth rates, the companies that have an edge within an
industry will trade at higher multiples. You must become an expert on the operating and financial specifics of each
of the companies: what products they sell, how they generate revenue and profits, and how they grow. Not until
you have that expertise will a company's multiple appear in the appropriate context with other companies. In the
end, you will have a more appropriate peer group, which may be as small as one. In order to evaluate Home
Depot, for instance, only Lowe's remains in our final analysis, because both are pure-play companies earning the
vast majority of their revenues and profits from just a single business.
2. Use forward-looking multiples
Both the principles of valuation and the empirical evidence lead us to recommend that multiples be based on
forecast rather than historical profits.3 If no reliable forecasts are available and you must rely on historical data,
make sure to use the latest data possible—for the most recent four quarters, not the most recent fiscal year—and
eliminate one-time events.
Empirical evidence shows that forward-looking multiples are more accurate predictors of value. Jing Liu, Doron
Nissim, and Jacob Thomas, for example, compared the characteristics and performance of historical and forward
industry multiples for a subset of companies trading on the NYSE, the American Stock Exchange, and Nasdaq.4
When they compared individual companies against their industry mean, the dispersion of historical earnings-to-
price (E/P) ratios was nearly twice that of one-year forward E/P ratios. The three also found that forward-looking
multiples promoted greater accuracy in pricing. They examined the median pricing error for each multiple to
measure that accuracy.5 The error was 23 percent for historical multiples and to 18 percent for one-year
forecasted earnings. Two-year forecasts cut the median pricing error to 16 percent.
Hoja 2
3. Finanzas II – Calviño/Alonso – The Right Role For Multiples In Valuation
Similarly, when Moonchul Kim and Jay Ritter compared the pricing power of historical and forecast earnings for
142 initial public offerings, they found that the latter had better results.6 When the analysis moved from multiples
based on historical earnings to multiples based on one- and two-year forecasts, the average prediction error fell
from 55.0 percent, to 43.7 percent, to 28.5 percent, respectively, and the percentage of companies valued within
15 percent of their actual trading multiple increased from 15.4 percent, to 18.9 percent, to 36.4 percent,
respectively.
3. Use enterprise-value multiples
Although widely used, P/E multiples have two major flaws. First, they are systematically affected by capital
structure. For companies whose unlevered P/E (the ratio they would have if entirely financed by equity) is greater
than one over the cost of debt, P/E ratios rise with leverage. Thus, a company with a relatively high all-equity P/E
can artificially increase its P/E ratio by swapping debt for equity. Second, the P/E ratio is based on earnings, which
include many nonoperating items, such as restructuring charges and write-offs. Since these are often one-time
events, multiples based on P/Es can be misleading. In 2002, for instance, what was then called AOL Time Warner
wrote off nearly $100 billion in goodwill and other intangibles. Even though the EBITA (earnings before interest,
taxes, and amortization) of the company equaled $6.4 billion, it recorded a $98 billion loss. Since earnings were
negative, its P/E ratio wasn't meaningful.
One alternative to the P/E ratio is the ratio of enterprise value to EBITA. In general, this ratio is less susceptible to
manipulation by changes in capital structure. Since enterprise value includes both debt and equity, and EBITA is
the profit available to investors, a change in capital structure will have no systematic effect. Only when such a
change lowers the cost of capital will changes lead to a higher multiple. Even so, don't forget that enterprise-
value-to-EBITA multiples still depend on ROIC and growth.
4. Adjust the enterprise-value-to-EBITA multiple for nonoperating items
Although the one-time nonoperating items in net income make EBITA superior to earnings for calculating
multiples, even enterprise-value-to-EBITA multiples must be adjusted for nonoperating items hidden within
enterprise value and EBITA, both of which must be adjusted for these nonoperating items, such as excess cash
and operating leases. Failing to do so can generate misleading results. (Despite the common perception that
multiples are easy to calculate, calculating them correctly takes time and effort.) Here are the most common
adjustments.
• Excess cash and other nonoperating assets. Since EBITA excludes interest income from excess cash, the
enterprise value shouldn't include excess cash. Nonoperating assets must be evaluated separately.
• Operating leases. Companies with significant operating leases have an artificially low enterprise value
(because the value of lease-based debt is ignored) and an artificially low EBITA (because rental expenses include
interest costs). Although both affect the ratio in the same direction, they are not of the same magnitude. To
calculate an enterprise-value multiple, add the value of leased assets to the market value of debt and equity. Add
the implied interest expense to EBITA.
• Employee stock options. To determine the enterprise value, add the present value of all employee grants
currently outstanding. Since the EBITAs of companies that don't expense stock options are artificially high,
subtract new employee option grants (as reported in the footnotes of the company's annual report) from EBITA.
• Pensions. To determine the enterprise value, add the present value of pension liabilities. To remove the
nonoperating gains and losses related to pension plan assets, start with EBITA, add the pension interest expense,
deduct the recognized returns on plan assets, and adjust for any accounting changes resulting from changed
assumptions (as indicated in the footnotes of the company's annual report).
Other multiples too can be worthwhile, but only in limited situations. Price-to-sales multiples, for example, are of
limited use for comparing the valuations of different companies. Like enterprise-value-to-EBITA multiples, they
assume that comparable companies have similar growth rates and returns on incremental investments, but they
also assume that the companies' existing businesses have similar operating margins. For most industries, this
restriction is overly burdensome.
PEG ratios7 are more flexible than traditional ratios by virtue of allowing the expected level of growth to vary
across companies. It is therefore easier to extend comparisons across companies in different stages of the life
cycle. Yet PEG ratios do have drawbacks that can lead to errors in valuation. First, there is no standard time frame
for measuring expected growth; should you, for instance, use one-year, two-year, or long-term growth? Second,
these ratios assume a linear relation between multiples and growth, such that no growth implies zero value. Thus,
in a typical implementation, companies with low growth rates are undervalued by industry PEG ratios.
For valuing new companies (such as dot-coms in the late 1990s) that have small sales and negative profits,
nonfinancial multiples can help, despite the great uncertainty surrounding the potential market size and
profitability of these companies or the investments they require. Nonfinancial multiples compare enterprise value
Hoja 3
4. Finanzas II – Calviño/Alonso – The Right Role For Multiples In Valuation
to a nonoperating statistic, such as Web site hits, unique visitors, or the number of subscribers. Such multiples,
however, should be used only when they lead to better predictions than financial multiples do. If a company can't
translate visitors, page views, or subscribers into profits and cash flow, the nonfinancial metric is meaningless,
and a multiple based on financial forecasts will provide a superior result. Also, like all multiples, nonfinancial
multiples are only relative tools; they merely measure one company's valuation compared with another's. As the
experience of the late 1990s showed, an entire sector can become detached from economic fundamentals when
investors rely too heavily on relative-valuation methods.
Of the available valuation tools, a discounted-cash-flow analysis delivers the best results. Yet a thoughtful analysis
of multiples also merits a place in any valuation tool kit.
About the Authors
Marc Goedhart is an associate principal in McKinsey's Amsterdam office, and Tim Koller is a partner in the New
York office. David Wessels, an alumnus of the New York office, is an adjunct professor of finance at the Wharton
School of the University of Pennsylvania. This article is adapted from the authors' forthcoming book, Valuation:
Measuring and Managing the Value of Companies, fourth edition, Hoboken, New Jersey: John Wiley & Sons,
available online. It also appeared in the Spring 2005 issue of McKinsey on Finance.
Notes
1
Enterprise value equals market capitalization plus debt and preferred shares less cash not required for
operations.
2
Nidhi Chadda, Robert S. McNish, and Werner Rehm, "All P/Es are not created equal," McKinsey on Finance,
Number 11, Spring 2004, pp. 12–5.
3
A note of caution about forward multiples: some analysts forecast future earnings by assuming an industry
multiple and using the current price to back out the required earnings. As a result, any multiple calculated from
such data will reflect merely the analyst's assumptions about the appropriate forward multiple, and dispersion
(even when warranted) will be nonexistent.
4
Jing Liu, Doron Nissim, and Jacob K. Thomas, "Equity valuation using multiples," Journal of Accounting Research,
Volume 40, Number 1, pp. 135–72.
5
To forecast the price of a company, the authors multiplied its earnings by the industry median multiple. Pricing
error equals the difference between the forecast price and the actual price, divided by the actual price.
6
Moonchul Kim and Jay R. Ritter, "Valuing IPOs," Journal of Financial Economics, Volume 53, Number 3, pp. 409–
37.
7
PEG multiples are created by comparing a company's P/E ratio with its underlying growth rate in earnings per
share.
Hoja 4