2. r all the Commodity Coefficient Rel. pore volume Coeficient
were given in n epsilon c1
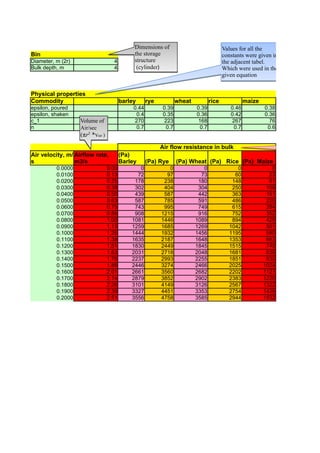
ent tabel. poured shaken m^n-4 kg s^-n
ere used in the
ation
Barley 0.7 0.44 0.4 270
Rye 0.7 0.39 0.35 223
Wheat 0.7 0.39 0.36 168
Rice 0.7 0.46 0.42 267
Maize 0.6 0.38 0.36 76 1 2− n
∆ pbulk = c1 ⋅ h ⋅ ⋅v
ε 4
Resistance curves were
5000 plotted using the equation
above for all the crops, Maize
4500
is the crop which was
4000 choosen for the final step.
3500
3000 Air velocity, m/s
(Pa) Barley
2500 (Pa) Rye
2000 (Pa) Wheat
(Pa) Rice
1500 (Pa) Maize
1000
500
0
Row 20 Row 22 Row 24 Row 26 Row 28 Row 30 Row 32 Row 34 Row 36 Row 38
Row 19 Row 21 Row 23 Row 25 Row 27 Row 29 Row 31 Row 33 Row 35 Row 37 Row 39
3. icient
-4 kg s^-n
1 2− n
∆ pbulk = c1 ⋅ h ⋅ ⋅v
ε 4
Air velocity, m/s
(Pa) Barley
(Pa) Rye
(Pa) Wheat
(Pa) Rice
(Pa) Maize
34 Row 36 Row 38
Row 35 Row 37 Row 39
4. 1. Reading points from manufacturers chart
n, rpm V_L p stat Referance points
4000 1.11 3000 at 4000rpm were
4000 1.81 2800 taken for 3500
3300
4000 2.78 1800 Pressure and Air 3150
4000 3.8 400 Flow volume. 3000 3000
2. Finding an equation via iteration 2500 2526.56
2372.5
2000
p_0 3300
Pressure
Value of the
c 150 cofficients are as
1500
m 2.20 follows, the red line
was fitted to the
n1 n2 blue points by 1000
n, rpm 4000 3500 constantly changing
these variables
V_L, m³/s p1, Pa p2, Pa 500
0 3300 2526.56
1 3150 2372.5 0
0 0.5 1 1.
2 2610.78 1818.69
3 1618.26 799.31
Value of the p1 has been fitted to the
4 133.18 -725.97
reference points , using the given equation
for p1. Then the transformation step was
taken by using the second equation which
is for p2. The values of all the cofficients
( p_0, c, m) has been obtained by hit and
trail method.
5. Fanlines
3300
3150
3000
2800
2610.78
2526.56
2372.5
1818.69 1800
1618.26
799.31
400
133.18
0 0.5 1 1.5 2 2.5 3 3.5 4 4.5 5
Air Volume
ted to the
given equation
tion step was
quation which
he cofficients
ned by hit and
6. 2 2 −m
n n
4.5 5
p2 = 2
n ⋅ p0 − c ⋅ 2
n
V m p = p − c ⋅V m
1 1 1 0