Developer Data Modeling Mistakes: From Postgres to NoSQL
Ada assignment
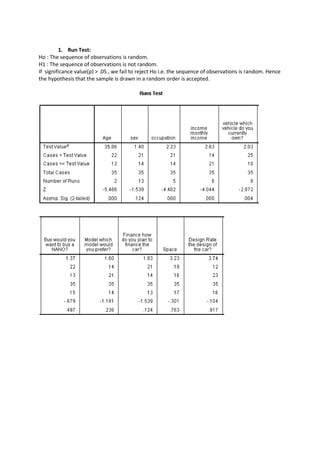
1. 1. Run Test:
Ho : The sequence of observations is random.
H1 : The sequence of observations is not random.
If significance value(p) > .05 , we fail to reject Ho i.e. the sequence of observations is random. Hence
the hypothesis that the sample is drawn in a random order is accepted.
2. 2.Kolmogorov-Smirnov Test – This test is used for testing whether the sample drawn has normal
distribution.
Ho: The population of random variable is normally distributed.
H1: The population of random variable is not normally distributed.
One-Sample Kolmogorov-Smirnov Test
3. would you want
sex to buy a NANO?
N 35 35
a,,b
Normal Parameters Mean 1.40 1.37
Std. Deviation .497 .490
Most Extreme Differences Absolute .390 .404
Positive .390 .404
Negative -.286 -.272
Kolmogorov-Smirnov Z 2.304 2.392
Asymp. Sig. (2-tailed) .000 .000
One-Sample Kolmogorov-Smirnov Test
how do you plan
to finance the Rate the design
car? Space of the car?
4. N 35 35 35
a,,b
Normal Parameters Mean 1.83 3.23 3.74
Std. Deviation 1.098 1.497 1.221
Most Extreme Differences Absolute .375 .167 .241
Positive .375 .132 .152
Negative -.225 -.167 -.241
Kolmogorov-Smirnov Z 2.217 .990 1.423
Asymp. Sig. (2-tailed) .000 .280 .035
One-Sample Kolmogorov-Smirnov Test
Rate the safety
of the car? Fuel effeciency
N 35 35
a,,b
Normal Parameters Mean 4.17 4.37
Std. Deviation .954 .646
Most Extreme Differences Absolute .257 .292
Positive .193 .260
Negative -.257 -.292
Kolmogorov-Smirnov Z 1.522 1.728
Asymp. Sig. (2-tailed) .019 .005
a. Test distribution is Normal.
b. Calculated from data.
One-Sample Kolmogorov-Smirnov Test
Considering the
increase in traffic
and pollution is it
Value for money a boon or curse
N 35 35
a,,b
Normal Parameters Mean 3.29 1.34
Std. Deviation 1.100 .482
Most Extreme Differences Absolute .202 .419
Positive .202 .419
Negative -.142 -.257
Kolmogorov-Smirnov Z 1.198 2.478
5. Asymp. Sig. (2-tailed) .113 .000
a. Test distribution is Normal.
b. Calculated from data.
As we can see from the above test result, the significance level of the variables “sex”,”would you buy
nano”,”model preferred”,”Financeplan”,”Design”,”Safety”,”Fuelefficiency”,”View on pollution” <.05,
so we fail to accept Ho which shows that the population of this variable is not normally distributed.
For all other variables as the significance level is greater than .05, so the population of these
variables is normally distributed.
For all the variables which have passed the KS Test, we are going to test it for homogeneity by
performing the Levene’s Test.
3.Levene Test- This test is used for testing the homogeneity of the variable.
Ho: The population of variable is homogeneous (variances are equal)
H1: The population of variable is not homogeneous (variances are not equal)
We take “Value for Money” as andependent variable and “Occupation” as a independent variable.
Performing the Levene Test, we get the following result.
Test of Homogeneity of Variances
Value Value for money
Levene Statistic df1 df2 Sig.
.352 3 31 .788
Levene's test is used to assess Variance homogeneity, which is a precondition for parametric
tests such as the t-test and ANOVA. The test can be used with two or more samples. With two
samples, it provides the test of variance homogeneity for the t-test. With more samples, it provides
the test for ANOVA.
6. If the significance from this test is less than 0.05, then variances are significantly different and
parametric tests cannot be used (and a non-parametric test will probably have to be used).
As significance value is greater than .05, we do accept the null hypothesis. The population of
variable is homogeneous. Since this variable’s variance is not significantly different, we are going
to perform the parametric test on it.
As the number of samples are more than two,we perform ANOVA test,the result of which is as
follows:
ANOVA
Value Value for money
Sum of Squares df Mean Square F Sig.
Between Groups 4.082 3 1.361 1.138 .349
Within Groups 37.061 31 1.196
Total 41.143 34
Here: Ho: Nano’s Value for money perceived is same across all occupations
H1: Nano’s Value for money perceived is different for different occupations
As the Significance value is 0.379>0.05,we need to accept the null hypothesis,i.e. theNano’s value
for money perceived does not significantly differ across the different types of occupations.
We,now, take “Occupation” as an dependent variable and “Vehicle currently owned” as a
independent variable.
Performing the Levene Test, we get the following result.
Test of Homogeneity of Variances
occupation
Levene Statistic df1 df2 Sig.
.211 2 32 .811
Since Significance is 0.811>0.05. As significance value is greater than .05, we do accept the null
hypothesis. The population of variable is homogeneous. Since this variable’s variance is not
significantly different, we are going to perform the parametric test on it.
7. ANOVA
occupation
Sum of Squares df Mean Square F Sig.
Between Groups 8.771 2 4.386 8.066 .001
Within Groups 17.400 32 .544
Total 26.171 34
Here: Ho: There are no significant differences between the groups'(occupation) mean
scores for the type of vehicle owned.
H1:There are significant differences between the groups'(occupation) mean scores for the
type of vehicle owned.
As the Significance value is 0.001<0.05,we need to reject the null hypothesis, i.eThere are
significant differences between the groups'(occupation) mean scores for the type of vehicle
owned.
Thus the type of vehicle owned varies significantly across the different types of populations.
For those variables which fail to pass the required assumptions, non parametric test such as
Kruskal-Wallis Test(Anova) or Mann Whitney Test (2 sample) is performed on it.
Lets consider the variables which have failed the Assumptions of parametric tests .
Independent variable :Sex
Dependent Variable : Perceived safety of the car
Ho: Safety of the car is perceived not differently across the two genders.
H1: : Safety of the car isperceived differently across the two genders.
Since variable “sex” results into a 2 samples and both the variables failed to qualify the assumptions
of the Parametric tests,we apply Mann Whitney test on them.
Results are as follows:
Ranks
sex N Mean Rank Sum of Ranks
Safety Rate the safety of the 1 male 21 18.95 398.00
car? 2 female 14 16.57 232.00
Total 35
b
Test Statistics
Safety Rate the
safety of the
car?
8. Mann-Whitney U 127.000
Wilcoxon W 232.000
Z -.728
Asymp. Sig. (2-tailed) .467
a
Exact Sig. [2*(1-tailed Sig.)] .516
a. Not corrected for ties.
b. Grouping Variable: sex
As we can see,the significance value is 0.467> 0.05 ,thus have to accept the null hypothesis.
Thus,Safety of the car is perceived similarly across the two genders.
Similarly we can consider all the parameters which had failed the parametric test assumptions
against Gender variable.
The results are as follows:
Ranks
sex N Mean Rank Sum of Ranks
View Considering the 1 male 21 17.83 374.50
increase in traffic and 2 female 14 18.25 255.50
pollution is it a boon or curse Total 35
Fuel Fueleffeciency 1 male 21 15.93 334.50
2 female 14 21.11 295.50
Total 35
Safety Rate the safety of the 1 male 21 18.95 398.00
car? 2 female 14 16.57 232.00
Total 35
Design Rate the design of 1 male 21 17.95 377.00
the car? 2 female 14 18.07 253.00
Total 35
Model which model would 1 male 21 18.33 385.00
you prefer? 2 female 14 17.50 245.00
Total 35
Buy would you want to buy a 1 male 21 18.17 381.50
NANO? 2 female 14 17.75 248.50
Total 35
Finance how do you plan to 1 male 21 20.24 425.00
finance the car? 2 female 14 14.64 205.00
Total 35
9. As we can for none of the variables the significance variable is <0.05 ,thus ,for all the variables the
the values do not differ according to gender or no distinction can be made in the variables on the
basis of gender.