Smc data visualisation
•
1 gefällt mir•757 views

The document summarizes different ways that data from Knowsley Council's Future of Kirkby Town Centre survey in 2010 was visualized to tell the story of residents' feedback. Over 1,600 survey responses were collected on issues like new retail, improved public spaces, and transport links. The responses were first shown as official pie charts but were later visualized using additional techniques like word clouds, bubble charts, and word trees to provide different perspectives on the residents' views.
![Knowsley Council’s Future of Kirkby Town Centre survey,March 2010 ,[object Object],[object Object],[object Object],[object Object]](data:image/gif;base64,R0lGODlhAQABAIAAAAAAAP///yH5BAEAAAAALAAAAAABAAEAAAIBRAA7)
Empfohlen
Weitere ähnliche Inhalte
Kürzlich hochgeladen
Kürzlich hochgeladen (20)
Empfohlen
Empfohlen (20)
Smc data visualisation
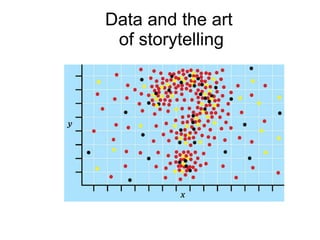
- 1. Data and the art of storytelling
- 3. The official pie chart of those responses
- 4. But residents had much more to say
- 5. A word cloud
- 6. The unofficial pie chart
- 7. The same responses in chart form
- 8. As a bubble chart
- 9. A word tree