Weitere ähnliche Inhalte
Ähnlich wie 2010 SLO tests Activia results
Ähnlich wie 2010 SLO tests Activia results (20)
2010 SLO tests Activia results
- 1. 1064
1416
1916
980
1179
668
486
0
892 877
639
918970
600
780
892 850
370
750
0
760
890
480
350
203,4
218,7
162,0154,1
181,6
0,0
50,0
100,0
150,0
200,0
250,0
Jan Feb Mar Apr Maj Jun Jul Av g Sep Okt Nov Dec
Tons
0
500
1000
1500
2000
2500
3000
3500
4000
4500
5000
GRP 2009 GRP 2010 sales volumes 2009
baseline volumes 2009 sales volumes 2010 baseline volumes 2010
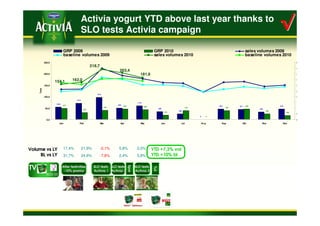
Activia yogurt YTD above last year thanks to
SLO tests Activia campaign
TV AfterAfter festivitiesfestivities
--10%10% promopromo
SLOSLO teststests
ActiviaActivia 11
W25-55
SparSpar
SLOSLO teststests
ActiviaActivia 22
TuTušš
SLOSLO teststests
ActiviaActivia 33
19,5%23,7%27,5%25,7%23,5%25,5%16,0%5,8%2,4%-7,8%24,6%31,7%
28,2%32,0%23,1%22,2%51,0%17,6%20,3%2,0%5,8%-2,1%21,9%17,4%VolumeVolume vsvs LYLY
BLBL vsvs LYLY
YTD +7,3% vol
YTD +10% bl
√√