1. National Franchise Report®
April 2015
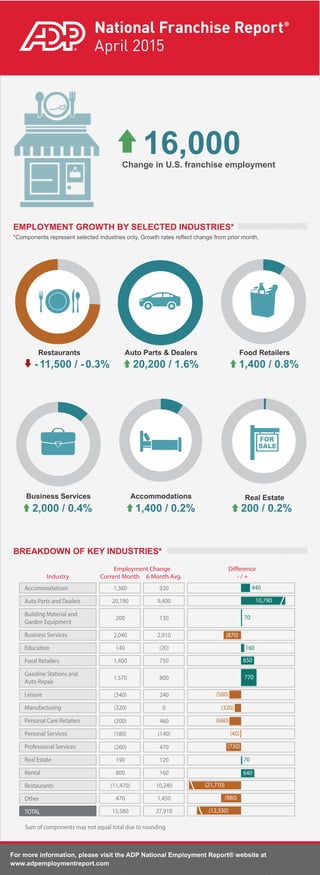
Change in U.S. franchise employment
*Components represent selected industries only. Growth rates reflect change from prior month.
EMPLOYMENT GROWTH BY SELECTED INDUSTRIES*
BREAKDOWN OF KEY INDUSTRIES*
Restaurants Auto Parts & Dealers Food Retailers
Business Services Accommodations Real Estate
-11,500 / -0.3% 20,200 / 1.6% 1,400 / 0.8%
2,000 / 0.4% 1,400 / 0.2% 200 / 0.2%
Industry Current Month
Employment Change
6 Month Avg.
Difference
- / +
Accommodations
Auto Parts and Dealers
Building Material and
Garden Equipment
Business Services
Education
Food Retailers
Gasoline Stations and
Auto Repair
Leisure
Manufacturing
Personal Care Retailers
Personal Services
Professional Services
Real Estate
Rental
Restaurants
Other
TOTAL
920
9,400
130
2,910
(20)
750
800
240
0
460
(140)
470
120
160
10,240
1,450
27,910
1,360
20,190
200
2,040
140
1,400
1,570
(340)
(320)
(200)
(180)
(260)
190
800
(11,470)
470
15,580
440
10,790
70
(870)
160
650
770
(580)
(320)
(660)
(40)
(730)
70
640
(21,710)
(980)
(12,330)
Sum of components may not equal total due to rounding
16,000