SlideShare ist ein Scribd-Unternehmen logo
1 von 35
Initiating Coverage Report
                                       Ready for The Take–off


                                                                                                                                                             Need for Capital
                                            Low CASA


                                                                                               nk
                                                                                         YES Ban


                                                                                                                  - On-a On a restructuring mode
                                                                                                                         restructuring mode
                                                                                                                                     g    g


Macro-economic Headwinds (Dark clouds)
                                                   Above Industry Loan Book Growth


- High persistent domestic inflation
                                                                                          Diversified Fe Income


                                                                                                                                      Strong Asset Quality


- Increasing Interest rates
                                                                                                                              iency
                                                                                                       ee


- Credit demand slowdown
                                                                                                                                                 t
                                                                                                                    Cost Effici


- Asset Quality risk in high
  growth sectors

 - Global economic instability

                                                                                                                        Theme for growth

                                                                                                                        • Branch expansion
                                                                                                                        • Capital Infusion
                                                                                                                        • Restructuring the balance sheet profile


Analyst – Abhisek Sasmal
033-3051-2175
asasmal@microsec.in                                                                  Microsec Research reports are also available on Bloomberg                                        <MCLI>

             20th June’2011                                                                                                                                                     Microsec Research
Contents
Investment & Valuation Brief                                                                2
Company background                                                                         3-4
YES Bank – Launch Pad – Version 2.0 (the take off )                                         5
Investment rationales                                                                     6-20
Peer Analysis                                                                              21
On the footsteps of leaders (Comparative study of Yes Bank with Axis & HDFC bank)          22
Stock Cues                                                                                 23
Sensitivity Analysis                                                                       24
Valuation & Recommendation                                                                 25
Financial Projections                                                                      26
Ratios                                                                                     27
Key concern to our call                                                                    28
Appendix – 1 (Typical YES bank branch)                                                     29
Appendix – 2 (Macro Picture – Light at the end of the tunnel!!)                            30
Note                                                                                       31
Analyst page                                                                               32
Other Banking reports                                                                      33
Disclaimer                                                                                 34


                                                 1

  20th June’2011                                                                    Microsec Research
YES Bank                      (Version 2.0 on course)
                                                               Yes Bank has experienced unprecedented growth in the Indian banking sector since it
                        BUY                                    started operations in late 2004. This is a significant achievement for a bank which had
                       Market Data                             started late when compared to other new age private sector banks. The bank
Current Market Price (INR)                              282    differentiated itself from other players in the industry through its unique 'knowledge
Target Price (INR) (18 months)                          358
                                                               banking approach', emphasis on technology, and human resources. The knowledge
                                                               banking approach was its main pillar of differentiation and using this it provided
Upside Potential (annualized)                           18%
                                                               specialized services to various sunrise industries through domain experts.
52 Week High / Low (INR)                          388/234
Market Capitalization (In INR Mn)                 103263       We re-initiate coverage on Yes Bank with a BUY rating. Our rating underpins the
          Non-
                                                               bank’s strong business momentum, diversified revenue stream, strong assets
                   Share Holding pattern%                      quality, positive asset liability mismatch, strong institutional holding, superior cost
       Institution
            s                          Promoter                efficiency, unique technology proposition, high pedigree of Human Capital, thrust on
          13%                           Group                  improving CASA driven by aggressive branch expansion plans and its superior and
  Foreign                                27%
 Financial                                                     sustainable return ratios. However, heavy dependence on bulk deposits in a rising
Institution                                                    interest rate scenario slightly impedes our optimism.
 s / Banks
     5%                                       Mutual
                                               Funds           At the CMP of INR 282 the bank is trading at 1.82x FY13E BV. The bank delivered RoE
                                                 5%            of over 20% and RoA of 1.5% for FY11. We further expect the bank to deliver RoE of
                       FII
                      45%                   Insurance
                                                               20%+ on the back of increased leverage, however we may see some pressure on RoA
                                                Cos            due to moderation in earnings growth going forward on the back of rising loan loss
                                                5%             provisions and rising cost.
                       STOCK SCAN
                                                               We have valued Yes bank on scenario model with different weightage given to each
                                                   532648
BSE Code                                                       scenario and arrived at a weighted average target price of INR358 which is 2.3x its
NSE Code                                      YESBANK          FY13E BV of INR 155.4. Our recommended target price is 27% above the current price.
                                                  YES IN
                                                               We expect this target price to be met with in 18 months from the date of release of this
Bloomberg Ticker
                                                               report.
Reuters Ticker                                  YESB.BO

Face Value (INR)                                         10    Key Risks - 1) Further rise in wholesale deposit cost. 2) Deferment of capital raising
                                                   3471.5
                                                               plans due to depressed market condition. 3) Lower than expected improvement in
Equity Share Capital (INR. Mn.)
                                                               CASA. 3) Higher than anticipated rise in slippages due to more focus on the SME
Average P/E/PBV (3 yrs)                         15.9/2.76
                                                               segment. 4) TTM P/BV is still at 30% premium to the average valuation in last rate hike
                                                                 g        )        /                p                    g
Beta vs Sensex                                          1.35   cycle. (refer page 28)
Average Daily Volmes (6 M)                        3181850
                                                                       Particulars (INR Mn)                 FY09         FY10        FY11       FY12E       FY13E
Dividend Yield (%)                                      0.84                                               9462.00      13634.85   18702.01    25514.30    33904.26
                                                               Total Income
Stock Return (1 Yr)                                6.25%       Growth%                                     36.89%       44.10%      37.16%      36.43%      32.88%
  140.0                                                        NII                                         5092.99      7879.53    12469.30    16861.89    22086.09
  130.0                                                                                                    54.1%        54.71%      58.25%      35.23%      30.98%
                                                               Growth%
  120.0
  120 0
                                                               Net Profit                                   3,038        4,777       7,271       9,561      12,087
  110.0
  100.0                                                        Growth%                                     51.90%       57.24%      52.22%      31.48%      26.42%
   90.0                                                                                                     10.23        14.06       20.95       26.91       33.55
                                                               EPS
   80.0
   70.0                                                        P/E *                                        27.66        20.12       13.51       10.52       8.44

                                                               NIM%                                        2.70%         2.80%       2.80%      2.53%       2.61%

                                                               ROE (Reported till FY11)                    20.70%        20.3%       21.7%      20.93%      21.59%
                      Yes Bank           SENSEX                NNPA%                                        0.33          0.06       0.03        0.09        0.06

                                                               BV                                           54.69        90.95      109.29      128.54      155.41

                                                               P/BV*                                        5.17          3.11       2.59        2.20        1.82
          Analyst – Abhisek Sasmal
                                                               Adj.BV                                       53.99        90.25      108.59      127.84      154.71
              91-033-3051-2175
             asasmal@microsec.in                               P/Adj. BV *                                  5.24          3.14       2.61        2.21        1.83

                                                                     * All prices as on   17th   June’11                           Source: Company, Microsec Research

                   20th June’2011                                                                                                                 Microsec Research
Company Background

                            Yes Bank limited (YBL), incorporated in 2003 by Rana Kapoor and Late Ashok Kapur, is a new age private
                            sector bank. It is the only bank that has been awarded a greenfield license by the Reserve Bank of India (RBI)
                            in the last 16 years. YBL offers a full range of products and services in areas of corporate and institutional
                            banking, financial markets, investment banking, corporate finance, business and transaction banking, retail
                            and wealth management across India.

                            The bank is part of global thought leadership forums like the Clinton Global Initiative (CGI), Triple Bottom
                            Line Investing (TBLI) and Tallberg Forum. Recently, it became the first Indian Bank to become a signatory
                            with the United Nations Environment Programme (Financial Initiative).

                            Yes Bank has partnered with various companies for delivering quality products and services namely Cash
                            Tech, Cisco Systems, Gartner, Intel, i-flex, Reuters, VSNL, Wipro, De La Rue, Murex, Wincor Nixdorf and
                            Sanovi.

                            This new age private bank has global institutional investors like Rabobank, Franklin Templeton, AIF Capital
                            and Fidelity, amongst others


                Received RBI license for
                commercial banking
                                                                              Maiden public offering of equity            Shares issued at premium of Rs
                                           Launch of financial market business     shares by the bank                     259.5 to QIBs
Incorporation


 NOV’03              MAY’04          AUG’04            SEP’04        OCT’04             JUNE’05                  AUG’07             JAN’10


                    Launch of Corporate and Business               Launch of                       Launch of Yes International Banking
                                banking                           Transaction
                                                                Banking business


                                                                                                                               Source: Company website


                                                                              3

       20th June’2011                                                                                                                     Microsec Research
Key Management Personnel
            Name                       Designation                                       Previous Assignment
                                                                                         Managing Partner / CEO & Managing Director - Rabo India, Bank of
            Rana Kapoor                Founder/ Managing Director & CEO
                                                                                         America (16 years)

            Rajat Monga                Group President – Financial Markets & CFO         Head of Treasury - Rabo India
                                                                                         Executive Director and Country Head - Avigo Capital Partners/ Bank of
            Varun Tuli                 Group President – Branch Banking
                                                                                         America
            Sumit Gupta                President – Commercial Banking                    Associate Director & Head (North) - Rabo India

                                       President & Global Head – International Banking
            Arun Agrawal                                                               General Manager – ICRA
                                       General

            Surendra Jalan             President – Indian Financial Institutions AGM     AGM, Corporate Banking - ICICI Bank

                                       Group President– Corporate Finance and
            Somak Ghosh                                                                  Director – Project Advisory & Infrastructure Mgmt - Rabo India
                                       Development Banking

                                       Group President –Transaction Banking Group,
                                            p                                g     p,    Global Transaction Services Head - Caribbean, Central & Latin America,
                                                                                                                                     ,                        ,
            Suresh Sethi
            S    h S hi
                                       International Banking, Liabilities Product Mgt.   Citibank

                                       President & Sr. Managing Director – Investment
            Aditya Sanghi                                                                Executive Director, Head of Mergers & Acquisitions - Rabo India
                                       Banking
                                       Group President and Chief Risk Officer Executive
            Kavita Venugopal                                                            Investment Banking, Kotak Mahindra Capital Company
                                       Director

            Alok Rastogi               President & Chief Operating Officer               Citibank N.A.


              Equity History
                                                                                                     Total amount raised       Equity Capital Equity Dilution
                         Particulars                                  Issues
                                                                                                          (INR Mn)               (INR Mn)           (%)
                           5-Jul-05           IPO at INR 45 per share                                          3150                  2700                 35%
                                              Private placement of 10 Mn shares at INR 120
                         22-Dec-06                                                                             1200                  2800                  4%
                                              to Swiss Reinsurance

                                              Private placement of 14.7 Mn shares at INR 225
                           7-Dec-07                                                                            3308                  2947                  5%
                                              to Gl b l T
                                                 Global Tamarind F d P Ltd
                                                             i d Fund Pte L d


                           27-Jan-10          Issuance of 38.36mn shares to QIBs at INR269.5                1033.8                  3386.3                13%


              Strong Institutional holding

                                                             Name                                                            % of Shares as on Mar'11

            American Funds Insurance Series Growth Fund                                                                                     4.92

            HSBC Bank Mauritius Ltd A/c HSBC IRIS Investments Mauritius Ltd                                                                 4.84

            RaboBank International Holding BV                                                                                               4.81
            Titiwangsa Investments Mauritius Ltd                                                                                            4.23
            SmallCap World Fund Inc                                                                                                         3.82
            Morgan Stanley Mauritius Company Ltd                                                                                            2.27
            Life I
            Lif Insurance Corporaiton of India
                          C      i     f I di                                                                                               1.92
                                                                                                                                            1 92
            JP Morgan Funds                                                                                                                 1.61
            Deutsche Securities Mauritius Ltd                                                                                               1.35
            Franklin India Prima Fund                                                                                                       1.03

                                                                       4                                        Source: ACE Equity, Company website

20th June’2011                                                                                                                              Microsec Research
YES Bank – Launch Pad – Version 2.0 (the take off )


                                                                    At the end of Mar'15
                                           At the end of Mar'11                                   Implied CAGR%
                                                                          (Target)
           Advances (INR Bn)                     343.64                   1000.00                     30.60%
           Deposits (INR Bn)                     459.39                   1250.00                     28.42%
           Balance sheet Size (INR Bn)           590.07                   1500.00                     26.24%


           Branches                                214                      750                       36.77%
           Employees                              3990                     12000                      33.40%


           NIM%                                   2.8%
                                                  2 8%                     4.0%
                                                                           4 0%
           RoE% (reported)                       21.70%                   22-24%
           RoA%                                   1.52%                  1.6-1.75%


            Relationship / Product Matrix – to support growth


                                                     5                                     Source: Company website

20th June’2011                                                                                      Microsec Research
Investment rationale
                              Business Momentum to continue

                              YBL’s loan book has grown at a CAGR of 52.9% over the last 5 years, which is well above the average
                              industry growth rate during the same time period. Higher than industry growth led to a consistent
                              improvement in market share for the bank. Market share stood at ~0.92% in FY11 as compared to 0.33% in
                              FY07. Going h d
                              FY07 G i ahead we expect the b k to continue growing at a pace hi h than that of the i d
                                                              h bank        i        i            higher h       h     f h industry and
                                                                                                                                      d
                              have factored in a CAGR of 28% for FY11-13. The growth will be well supported by aggressive branch
                              expansions, more penetration in the larger corporate segment & retail segment of the loan book. YES
                              bank’s loan book growth aspiration (Version 2.0) is mainly driven by 1) increasing market share and 2)
                              putting revenue growth ahead of increasing cost. However in the long run, this approach from YBL may
                              change due to the need of faster improvements in some key metrics where its lags its larger peers.

800.00   Strong business growth                                                                                                      749.03          400.0%

700.00                                                                                                                                               350.0%

600.00                                                                                                                                      562.88   300.0%

500.00                                                                                                 459.39                                        250.0%

400.00                                                                                                      343.64                                   200.0%

300.00
300 00                                                                                                                                               150.0%
                                                                                                                                                     150 0%

200.00                                                                                                                                               100.0%

100.00                                                                                                                                               50.0%

  0.00                                                                                                                                               0.0%
            FY05         FY06             FY07            FY08              FY09            FY10           FY11          FY12E           FY13E

                         Deposits (INR B )
                         D    i        Bn)              Advances (INR Bn)
                                                        Ad            B )               YoY D G
                                                                                        Y Y Dep. Growth%
                                                                                                      h%             YoY Ad G
                                                                                                                     Y Y Adv. Growth%
                                                                                                                                   h%


  250     Above industry loan growth from Inception                                      Seasonal weakness in loan growth started to get visible
                                                                               400                                                                    35.0%
             216                                                               350                                                                    30.0%
  200
                                                                               300                                                                    25.0%

                   161                                                                                                                                20.0%
                                                                                                                                                      20 0%
  150                                                                          250
                                                                                                                                                      15.0%
                                                                               200
                                                                                                                                                      10.0%
  100                                                                          150
                                                                                                                                                      5.0%
                                           79                                  100                                                                    0.0%
                                                   60
    50                     50                                                      50                                                                 -5.0%
                                   32                       30     26               0                                                                 -10.0%
     0
         FY06   FY07   FY08     FY09    FY10    FY11 FY12E FY13E

          Industry Loan growth%          YES Bank's Loan Growth%                                       Loan Book (INR Bn)          gr% (RHS)


                                                                                                                       Source: Company, Microsec Research
                                                                               6

           20th June’2011                                                                                                               Microsec Research
Branch Expansion strategy – well fit to the overall business model
                                   Yes Bank currently has a branch count of 214 across 164 cities. It has 91 branch licenses and plans to
                                   expand its reach to 250 branches by Q1’FY12 and to 325 branches by Q4’12. With initial focus in
                                   liability rich regions of North and West India (75% of branches), the bank now plans for a pan-India
                                   presence. The new roll-outs are targeted at improving the SME and retail franchise. The bank plans
                                   to roll out 150 branches in South with in two years time. The metro centers are likely to have over
                                   30 branches each in the next few years. YES bank has separate team looking after the inclusive or
                                   social banking model (a combination of bricks & Mortar and technology-enabled branches) in Tier-3
                                   to Tier-6 segments of agri-rich Maharashtra, Gujarat, Rajasthan, Haryana, UP & MP. “Low cost –
                                   Rapid launch” branches are mapped out for Tier-3 to Tier-6 cities. The branch addition and thrust on
                                   retail deposits will help shore up CASA franchise.

                                   YES bank uses “Hub and Spoke” model for faster maturity and greater efficiency of branches. This
                                   approach has in-turn reduced IT and infrastructure spends. Also, with timely break-even in key
                                   branches, cost-to-income for the bank has declined substantially from 53% in FY07 to 36% in FY11.


        Branch Concentration
                                            Pan India Branch expansion.
                                              Priority anti-clo wise


              East
              10%
                                                              ock


South
 15%

                               North
                               50%
           West
           25%


                                                                                                                            Source: Company, Microsec Research

                                                                                                               % Share of Loan
                                  Advances Segmentation                       Clients       Typical Exposure
                                                                                                                   Book
                                                                                                                                            Comments


                                   Corporate & Institutional                                                                     Very low credit cost, strong asset
                                                                          Above INR 20Bn INR 500 -2000 Mn          65.6%
                                           banking                                                                                           quality


                                       Commercial Banking                 > 2Bn & <= 20Bn   INR 100-500 Mn         22.5%              Medium risk segment


                                         Branch Banking                       <= 2 Bn       INR 20-100 Mn          11.9%          High yield & High risk segment


                                                                                                                           Source: Company, Microsec Research
                                                                                        7

             20th June’2011                                                                                                                  Microsec Research
Break up advances (Q4’11)                              Break up of advances based on knowledge based sectors (Q4’11)


                         Branch                                                                      Others
                      Banking, 11.90                                                                  18%                 Infra & Logistics
                           %                                                                                                    23%
   Commercial
  banking, 22.50
        %
                                                                                 Food & Agri
                                                                                  businesses
                                                  Corporate &
                                                  Institutional                     18%                                                  Engineering
                                                 Banking, 65.60                                                                             22%
                                                        %
                                                                                                        TMT
                                                                                                        14%


                                                                                                                                              Healthcare
                                                                                                                                                 5%


                                                                                                                           Source: Company, Microsec Research
                   Q4'09                                                 Q4'10                                               Q4'11


                     8%                                                     5%                                              12%


                                                                  26%
       29%                                                                                                          22%


                                       63%                                                                                                     66%
                                                                                         69%


                                  Corporate & Institutional Banking     Commercial banking       Branch Banking


35%     Focus on knowledge banking

30%
                                25%
25%                                                                   22%                                                  22.70%
                                                                                                                           22 70%
                                                                                     20.70%                                         21.70%
20%            18%                                                                                                                              18.10%
                                                      17%                                      19.10%      16.90%
         16%
                                                15%
15%

10%

5%

0%
                       Q4'08                                 Q4'09                                 Q4'10                                Q4'11

                    Infra & Logistics          Engineering              Healthcare             TMT            Food & Agri businesses             Others

                                                                                 8                                        Source: Company, Microsec Research

      20th June’2011                                                                                                                            Microsec Research
Knowledge banking – a key differentiator

                            YES bank's competence in terms of using high-end technology, its 'knowledge banking'
                            approach, and emphasis on highly qualified human resources helped it to differentiate itself from
                            other private banks in an increasingly commoditized market. In particular, its knowledge banking
                            initiative drew a lot of interest. In the initial phase, the bank planned to target those sectors where
                            the bank has a deep understanding of the industry. The bank has a team of investment banking
                            professionals that h
                                f i     l h have h d hands-on expertise i advisory, capital raising and M&A b i
                                                                      i in d i            i l ii      d        businesses. Th
                                                                                                                           There are
                            sector specialists that understand a particular sector and know the business intricacies to structure
                            superior solutions from a banking perspective.


                                                                         Skilled
                                                                         p p
                                                                         people


                                                            Superior
                                                           technology


                                                                                Knowledge
                                                                                 banking


Unique Technology Proposition                                        High pedigree Human Capital

                                                                         Edu Background (FY10)         Work exp (Yrs) (FY10)

                                                                                                          11-15 16-20 > 21
                                                                         CA/C                                         0%
                                                                                                           4%    1%
                                                                           S          LLB
                                                                          6%          1%
                                                                                                                      0-1
                                                                                                                     16%
                                                                                                        6-10
                                                                                                        20%
                                                                       MBAs                 Gradu
                                                                                            G d
                                                                       36%                   ates
                                                                                             50%

                                                                                                                      2-5
                                                                                                                     59%
                                                                                 PG
                                                                                 7%


                                                                                              Source: Company, Microsec Research


                                                               9

          20th June’2011                                                                                         Microsec Research
CASA augmentation remains the key
    B2B2C Strategy
    Identifying current
                                     YES bank’s deposit base grew 5.6x within 5 year’s time, registering a CAGR of 53.75% over FY07-
       account rich                  FY11 mainly due to base effect. However, the bank has historically relied more on wholesale
   corporate customers               deposits to ramp up loan growth. In addition, relatively lower branches (most of the branches being
                                     new) impacted the CASA mobilization of the bank. Yes Bank's proportion of low cost deposits
                                     (CASA) is amongst the lowest in the Industry. However, in absolute numbers CASA has grown at
                                     78% CAGR d i FY07 FY11 Y B k i l ki to d i value f
                                                  during FY07‐FY11. Yes Bank is looking derive l from planned b l    d branch expansion
                                                                                                                             h       i
   Offering them salary              and increase penetration to improve its CASA ratio. Management wants to increase the CASA share
   a/c and various other             to 30% by FY15. However, we expect a gradual improvement in the YBL’s CASA ratio from current
   wealth management
         products                    10.3% to 12.5% till FY 2013. FY13 onwards, CASA mobilization may gain higher momentum as
                                     almost 60% of the branches likely to cross breakeven productivity by then. The CASA share may
                                     throw some positive surprises if the overall balance sheet growth lags the CASA growth. We expect
                                     CASA deposits to grow at a CAGR of 48.6% over FY10‐FY13. Of the incremental accretion to
Offering them superior cash          deposits, we expect the CASA contribution at 15.8% between Mar’11 to Mar’13.
 management & liquidity
   management solution
     including a SB a/c
                                    80%   Above industry deposit growth
                                    70%
Tied up with the corporates         60%
   to tap a rich source of
                                    50%
         references
                                    40%
                                    30%
                                                                                                                            27%               28%
                                    20%                                                                                                       19%
                                                                                                                            18%
                                    10%
With larger share of Current        0%
account in YBL’s overall
CASA, economically the value                  FY08             FY09             FY10                 FY11             FY12E               FY13E
of this 10% CASA is comparable
to any bank which has 15-16%
   a y ba        c as 5 6%                                    Industry Deposit g
                                                                     y p       growth%              YES Bank's Dep. Growth%
                                                                                                                 p
CASA with more share from
                                                                                                                  Source: Company, Microsec Research
SA. Thus any event related to
savings bank rate de-regulation
will be structurally positive for
this bank.                          45%
                                               39.50%        Dependence on wholesale deposits – may put NIMs under pressure in an
                                    40%
                                                                                  increasing rate scenario
                                    35%
                                    30%
                                    25%
                                    20%
                                    15%                      13.20%                         12.10%           10.90%                         10.30%
                                    10%                                      7.50%                                            6.40%
                                    5%
                                    0%
                                           FD - C
                                                Corp    FD - b
                                                             branch
                                                                  h       FD -           FD- G
                                                                                             Govt           CDs
                                                                                                            C         Institutioanl
                                                                                                                          i i     l       CASA
                                            banking      banking       Commercial                                       Deposits
                                                                        banking

                                                               Q4'09                        Q4'10                        Q4'11


                                                                        10                                        Source: Company, Microsec Research

              20th June’2011                                                                                                          Microsec Research
400    Strong Branch expansion                                                                           350       80

                                   350                                                                                                                70
                                                                                                                                275
                                   300                                                                                                                60

                                   250                                                                                                                50
                                                                                                                    214
                                   200                                                                                                                40
                                                                                                    150
                                   150                                               117                                                              30

                                   100                                67                                                                              20

YES bank’s newer branches are                              40
                                    50      17                                                                                                        10
reaching the critical inflexion
point where they can attract         0                                                                                                                0
more customers due to their                FY06           FY07      FY08            FY09         FY10               FY11        FY12E      FY13E
reach & faster productivity
                  productivity.
More and more newer branches
                                                                           No of branches             Expansion (RHS)
are coming up in Tier-2 & Tier-
3 cities. These branches will                                                                                             Source: Company, Microsec Research
reach break even faster than
their Urban peers due to lower    300.0                                                                                                              14.00%
                                          CASA mobilization per branch on the rise
cost and less competition. All
these will led to faster CASA     250.0                                                                                                              12.00%
mobilization in branch level
with faster improvement for                                                                                                                          10.00%
                                                                                                                                                     10 00%
CASA/branch.                      200.0
                                                                                                                                                     8.00%
                                  150.0
                                                                                                                                                     6.00%
                                  100.0
                                                                                                                                                     4.00%

                                   50.0                                                                                                              2.00%

                                    0.0                                                                                                              0.00%
                                           FY06           FY07      FY08            FY09         FY10             FY11         FY12E      FY13E

                                                                           CASA per branch (in Mn)                  CASA%

                                                                                                                           Source: Company, Microsec Research


                                                                  FY07           FY08        FY09          FY10       FY11      FY12E      FY13E      CAGR%


                                                 CA              4158.9          9821.3     12197.5       24271.6    39338.3    53750.5   74379.0         61.72


                                                 SA               579.8          1465.3      1920.6       3909.9      8170.4    12375.0   19250.0         79.30


                                          Term Deposits          77465.3      121445.0      147576.1 239804.1 411880.7 519055.7           655402.9        42.74


                                                                                                                           Source: Company, Microsec Research


                                                                            11

            20th June’2011                                                                                                                  Microsec Research
Favorable asset liability mismatch gives support to NIMs

                                   Lower CASA has been well compensated by a positive asset liability mismatch in longer term assets.
                                   Only 10% of the assets have fixed rate, which means it can raise lending rates quickly when faced with
                                   a liquidity squeeze. Longer term assets are mostly financed by borrowings (~76%) mainly term loans.
                                   The bank has ample liquidity in the form of short term deposits to finance its shorter term assets (< 1
                                   y)
                                   yr). The average tenure of deposit base is about 21 months and loans about 18 months which means
                                                  g                 p
                                   faster maturity of asset than liabilities.


                                                                    Longer term advances funded by borrowings
                                       FY10                                                                                  FY10
 80.0%                                    75.80%                                              90%
                                                                                                                                                     78.50%
 70.0%                                                                                        80%
                                                                                              70%
 60.0%
                                                                                              60%
 50.0%
                                                                                              50%
 40.0%
                                                                                              40%
 30.0%                                                                                        30%
                                                                                                                                21.50%
                                                                                                                                21 50%
 20.0%                                                                 13.70%                 20%         13.70%
                     8.90%                                                                    10%
 10.0%
                                                                                              0%
  0.0%
                                                                                                     Advances maturing      Infra Exposure        Term Loans
          3YR+ Dep. as % of 3YR      3YR+ Borr. as % of       3YR+ Adv. as a %of
                                                                                                      3Yrs and above
                 + adv                  3YR+ adv                  total adv


                                                                                  Positive ALM mismatch

100%                                                                 0.60%
                                                                     0.40%
                         5.80%                                                                  100%
90%                      7.90%                                      16.60%
                                                                                                    90%
80%
                                                                                                    80%
70%                      33.50%                                      26%                            70%
60%                                                                                                 60%
                                                                                                                    90%                           89.50%
50%                                                                                                 50%
                                                                    18.30%
                         17.30%
40%                                                                                                 40%
30%                      7.70%                                                                      30%
20%                                                                 38.10%                          20%
                         27.80%
10%                                                                                                 10%
                                                                                                                    10%                           10.50%
 0%                                                                                                 0%
                        Advances                                    Deposits                                       Assets                        Liabilities
         < 3 mnths       3-6 mnths     6-12 mnths         1-3 yrs       3-5 yrs     > 5 yrs                                 Fixed            Floating


                                                                                                                             Source: Company, Microsec Research
                                                                                   12

          20th June’2011                                                                                                                        Microsec Research
Margin scenario – strong pricing power may support NIMs
                         YES bank is mostly a wholesale funded bank (refer page 10). Due to the recent hike in retail deposit
                         rates and with wholesale deposit rates at about 10.02% currently, the bank’s cost of funds has increased.
                         The incremental cost of funds is 50-100bps higher currently, compared with the overall cost of funds in
                         December 2010. However, we believe this cost increase is likely to be mitigated (to an extent) by a 200
                         bps increase in the prime lending rate (PLR) and a 50 bps rise in the base rate (Yes Bank increased its
                         PLR by 50 bps in August 2010 September 2010 December 2010 and May 2010 The PLR is 18 5% and
                                                    2010,            2010,                           2010.               18.5%
                         the base rate at 9.5% currently). The impact of increasing SB rate by 50 bps will be limited to only 1 bps
                         increase in cost of funds, however the increase in base rate and PLR will enable the bank to partially
                         absorb the increased cost on account of rising interest rates. However, further interest rate hike by RBI
                         will put pressure on its NIMs with a lag as more and more deposits will re-priced later.


                                       Short-term interest rate on the rise – making wholesale deposit costly

16                                                                     18
14                                                                     16
12                                                                     14
10                                                                     12
                                                                       10
8
                                                                        8
6
                                                                        6
4
                                                                        4
2
                                                                        2
0
                                                                        0


      CP 3month           CP 6month             CP 12 month                          CD 3month              CD 6month             CD 12month


                      Rise in cost of funds pressurizing NIMs
           15.00%
           14.00%
                                                        13.63%
           13.00%
           12.00%                  11.84%                                                                          11.27%
                                                                                                   10.57%                              11.30%
           11.00%                                                           10.24%
           10.00%
            9.00%
            8.00%
            7.00%
            6.00%
            5.00%
            4.00%
                                                                            2.80%                2.80%
            3.00%              2.60%                    2.70%                                                          2.53%
                                                                                                                                       2.61%
            2.00%
            1.00%
                            FY08                 FY09                  FY10                 FY11               FY12E               FY13E


                          % yield on advances           % yield on investments         Cost of deposits%       Borrowing cost%        NIM%


                                                                      13                                     Source: Company, Microsec Research

     20th June’2011                                                                                                            Microsec Research
Strong core operating income growth & diversified fee revenue

                     YBL’s total income grew strong at a CAGR of 58.8% over FY06-FY11. This is well supported by
                     69.88% CAGR growth in Net Interest Income (NII) & 45.1% CAGR growth in Other Income over the
                     same period. The dependence on other income (OI/TI) has come down from over 50% in FY05 to
                     33.3% in FY11. Fee income constitute almost 95% of the other income. Fee income is mainly driven
                     by transaction banking & financial advisory (investment banking and project advisory). We may see
                     some growth moderation i fi
                                  h     d    i    in financial market ( i l treasury i
                                                           i l    k (mainly           income) i coming quarters d to
                                                                                             ) in    i             due
                     subdued market and rising bond yields. With increasing branch expansion, increasing focus on retail
                     assets and stabilization of new branches, we may see contribution of branch banking in fee income to
                     increase. Overall, we expect the core income for YES bank to outpace the other income during FY10-
                     FY13. We are expecting Total income, NII & Other income to register a CAGR of 35.5%, 41.1% and
                     27.1% respectively over FY10-FY13.


   In Mn
 40000.0          Core operating Income outpacing non-core income                                                                        500.0%

 35000.0                                                                                                                                 450.0%
                                                                                                                                         400.0%
 30000.0
                                                                                                                                         350.0%
 25000.0                                                                                                                                 300.0%
 20000.0                                                                                                                                 250.0%

 15000.0
 1 000 0                                                                                                                                 200.0%
                                                                                                                                         200 0%
                                                                                                                                         150.0%
 10000.0
                                                                                                                                         100.0%
  5000.0                                                                                                                                 50.0%
     0.0                                                                                                                                 0.0%
            FY05           FY06          FY07         FY08           FY09           FY10        FY11          FY12E       FY13E

            NII           Other Income          Total Income           NII Gr%             Other Income Gr%           Total Income Gr%


    In Mn
    900.0            Break up of Fee Income

    800.0

    700.0

    600.0
    600 0

    500.0

    400.0

    300.0

    200.0

    100.0

      0.0
                  Q2'10            Q3'10              Q4'10                 Q1'11             Q2'11             Q3'11             Q4'11

                      Transaction Banking       Financial Markets      Financial Advisory        Branch Banking fees and others


                                                                14                                       Source: Company, Microsec Research

20th June’2011                                                                                                              Microsec Research
FY15
                  Fee Income composition
                                                 FY11 Share    Target                                    Drivers


                      Financial Advisory           45.3%        30%              Primarily IB and debt syndication. Will moderate, going forward


                      Financials markets           14.5%        30%              Fx/derivatives/rates. Driven by strong corporate relationships.

                                                                                 A key driver of growth, going forward, given the branch scale
                     Transaction banking           31.4%        30%
                                                                                 building up

                                                                                 Insurance and MF – growth because of low base and expanding
                          Branch banking            8.8%        10%
                                                                                 reach, despite challenging environment


                 Unique cross selling opportunities give multiple & diversified revenue streams

                   Knowledge Sectors       Clients segment     Credit products    Financial Markets    Transaction Banking      Advisory Services

                      Food & Agri          Agro Chemicals               √                 √                        √                      √

                     Life Sciences               Drugs                  √                 √                        √                      √

                      Engineering          Electric comp.               √                 √                        √

                           TMT              IT/Telecom                  √                 √                        √                      √

                     Infrastructure         Wind Energy                 √                 √                        √                      √


                                                                                                         Source: Company, Microsec Research


                                                         % Share of Fee income to Total Income (FY11)
                 50.00%

                                                                                                                               44.13%
                 45.00%

                 40.00%

                 35.00%                                              33.90%
                                      31.38%
                 30.00%

                                                                                                24.02%
                 25.00%

                 20.00%
                                      YES Bank                    Axis Bank                   HDFC Bank                      ICICI Bank


                                                                                                         Source: Company, Microsec Research
                                                                15

20th June’2011                                                                                                               Microsec Research
Cost efficiency one of the best in the industry

                   In comparison with its peer group, YES bank enjoys one of the leanest cost structure which is on
                   account of better business productivity per employee, unique technology proposition. Over the past
                   five years, bank has successfully reduced its cost ratio from 52.88% to 36.35% in FY11. Going
                   forward, we expect this ratio to stabilize at 38‐40% levels with its aggressive hiring and branch
                   expansion plans. Yes bank has also improved its cost/assets by 86 bps over FY08-11, mainly due to
                      p       p                            p                      y    p                     y
                   better utilization of its infrastructure. These offset its low CASA and somewhat laggard NIM.
                   Productivity ratios of the bank remain as one of the best, regardless of having large number of
                   branch and employee additions every year. Most of the bank's branches are comparatively new and
                   yet to pick up in terms of productivity. Management indicates that increase in productivity (newer
                   branches to matured branches) will limit the upside in cost in coming years.


                             Cost to Income ratio
                 55.0%


                 45.0%


                                                                                                                                  39.75%
                                                                                                                    38.00%
                 35.0%                                                                                36.35%


                 25.0%
                             FY06          FY07           FY08          FY09         FY10          FY11        FY12E          FY13E


                                Staff cost rationalization helped overall cost efficiency

                  100%
                   90%
                   80%
                                                                                         52.09%           51.36%              53.30%
                   70%         58.20%             60.71%               59.33%

                   60%
                   50%
                   40%                                                                   18.24%           18.38%
                               13.30%                                                                                         19.80%
                                                  13.95%               14.79%
                   30%
                   20%
                   10%         19.87%             18.23%               19.76%            22.12%           22.05%              18.74%

                    0%
                                FY06               FY07                 FY08              FY09             FY10               FY11

                         Other exp%     Depreciation cost%       Ad sales& Promotional expenses%   Administative expenses %     Staff cost%


                                                                                                   Source: Company, Microsec Research
                                                             16

20th June’2011                                                                                                         Microsec Research
Assets/Employee (INR Mn)                                                            Cost/Assets (%)
                                                                               2.50%
200
180
                                                                               2.00%
160
140
120                                                                            1.50%

100
 80                                                                            1.00%

 60
 40                                                                            0.50%

 20
  0                                                                            0.00%
       FY06     FY07    FY08      FY09       FY10     FY11    FY12E FY13E                  FY06        FY07     FY08       FY09     FY10        FY11     FY12E     FY13E


           Employee productivity on the rise
18.0                                                                           2.5    70                                                                                  90
16.0                                                                                                                                                                      80
                                                                                      60
                                                                               2.0                                                                                        70
14.0
                                                                                      50                                                                                  60
12.0                                                                                                                                                                      50
                                                                               1.5    40
10.0                                                                                                                                                                      40
 8.0                                                                                  30                                                                                  30
                                                                               1.0
 6.0                                                                                                                                                                      20
                                                                                      20                                                                                  10
 4.0                                                                           0.5                                                                                        0
 2.0                                                                                  10
                                                                                                                                                                          -10
 0.0
 00                                                                            0.0
                                                                               00      0                                                                                  -20
                                                                                                                                                                           20
       FY06     FY07      FY08     FY09      FY10      FY11      FY12E FY13E                  FY06     FY07     FY08    FY09       FY10     FY11      FY12E FY13E

              Business per Employee                 Profit per Employee(RHS)                              Employee/Branch                 Incr Empl/Bran (RHS)


               Cost/Assets% (FY11)                                                                   Cost/Income% (FY11)
                                                                                     50.00%                                                                      47.90%
   3.00%
                                                                                     45.00%
                                                                                     45 00%                             42.70%               42.24%
                                                                                                                                             42 24%
                                                                      2.40%
                                                                      2 40%
   2.50%
                                                                                     40.00%           36.35%
                                  1.96%
   2.00%
                                                      1.63%                          35.00%

   1.50%                                                                             30.00%
                1.15%
                                                                                     25.00%
   1.00%
                                                                                     20.00%
   0.50%
                                                                                     15.00%
   0.00%
                                                                                     10.00%
               YES bank          Axis Bank          ICICI Bank     HDFC Bank
                                                                                                     YES bank          Axis Bank           ICICI Bank       HDFC Bank

                                                                                                                             Source: Company, Microsec Research
                                                                                     17

              20th June’2011                                                                                                                           Microsec Research
Asset quality one of the strongest in the industry

                                            Due to higher credit exposure to the corporate segment, YES bank enjoys one of the best asset
                                            quality in the industry. During FY05‐07, YBL hasn’t reported any slippages, however in FY08, it
                                            reported its first GNPAs of 0.1% and currently it stood at 0.21%. Restructured assets as a % of gross
                                            advances improves from 0.36% in Q4’10 to 0.24% in Q4’11. Exposure to troublesome MFI sector
                                            stood at INR 4500 Mn which is less than 1.5% of the total loan book. Also, YBL does not have any
                                            exposure to the new 2G players. F h we d ’ see any i
                                                          h           l      Further,     don’t          impact of RBI’ recently revised norms
                                                                                                                 f RBI’s       l      i d
                                            for provisioning. However, higher provisioning for restructured assets may dent FY12 expected PBT
                                            by 0.08% to 0.11% (Microsec Internal calculation).

                                            However with increasing focus on SME & retail segment we may see a spurt in slippages going
                                            forward. Secondly, it will be hard for the bank to improve upon its GNPA % NNPA% further in this
                                            increasing rate scenario. Nevertheless it is noteworthy to mention, that even after factoring in an
                                            increase in NPAs it still remains low as compared to its peer group. YBL’s provision coverage ratio
                                            stood at health 88 6% as on March’11
                                                     healthy 88.6%        March 11.


0.9            Credit Cost%                                              2500           Strong asset quality                                                    80%
0.8                                                                                                                                                             70%
0.7                                                                      2000
                                                                                                                                                                60%
0.6
                                                                         1500                                                                                   50%
0.5
                                                                                                                                                                40%
0.4
                                                                         1000                                                                                   30%
0.3
0.2                                                                                                                                                             20%
                                                                          500
0.1                                                                                                                                                             10%
 0                                                                          0                                                                                   0%
              FY09       FY10        FY11       FY12E      FY13E                      FY09          FY10            FY11          FY12E          FY13E

                                                                                GNPA (Rs m)         NNPA (Rs m)            GNPA Ratio (RHS)           NNPA Ratio (RHS)


                 Provision Coverage Ratio                                                     Restructured assets
      100.0                                                                      1700                                                                             1.2
       90.0
                                                                                 1500                                                                             1
       80.0
       70.0                                                                      1300                                                                             0.8
       60.0
       50.0                                                                      1100                                                                             0.6
       40.0
                                                                                  900                                                                             0.4
       30.0
       20.0                                                                       700                                                                             0.2
       10.0
       10 0
        0.0                                                                       500                                                                             0

                 FY09        FY10       FY11      FY12E     FY13E                         Q2'10     Q3'10      Q4'10   Q1'11       Q2'11      Q3'11     Q4'11
                                                                                           Total Restructured Assets (INR Mn)           % Gross Advances (RHS)


                                                                                18                                     Source: Company, Microsec Research

                 20th June’2011                                                                                                                 Microsec Research
Capital issuance critical for growth

                                   YES bank has adopted a capital raising in every 1.5-2 years of operation from FY08. Currently YES bank
                                   is adequately capitalized with Capital Adequacy Ratio (CAR) stood at 16.7% at the end of March’11.
                                   Bank has raised capital of INR 3386 Mn by issuing shares to QIBs at INR 269.5 per share in Jan’10
                                   diluting 13% stake. Further management is expected to raise funds to the tune of USD500 Mn (INR
                                   22500 Mn) through an American Depository receipt by the end of FY12. However due to the subdued
                                              )       g                  p      y       p y
                                   domestic & overseas capital market, the bank may defer its plan till H1’FY13. This gives the bank
                                   enough issuance window to raise capital at a reasonable price. However, We have not factored in the
                                   capital raising plan by the bank in our estimates for FY12 & FY13.


          Capital raising once in every two years from FY08
  In Mn                                                                           Adequate capital for sustainable growth
40000                                                                     25

35000
                                                                          20
30000

25000
                                                                          15
20000

15000                                                                     10

10000
                                                                            5
 5000

    0
                                                                            0
          FY06       FY07      FY08        FY09        FY10   FY11
                                                                                 FY09        FY10          FY11         FY12E         FY13E

                        Networth      Capital Raised
                                                                                                 CAR (%)          Tier 1 (%)


                                                                                                       Source: Company, Microsec Research


                                                                       19

            20th June’2011                                                                                                     Microsec Research
Strong RoE(Cal) despite regular capital raising. RoAs may come down under
                                    pressure due to increase in cost/assets & Loan loss provisions (LLPs)
                 25.00%                                                                                         1.70%


                 20.00%
                                                                                                                1.60%

                 15.00%
                                                                                                                1.50%
                 10.00%

                                                                                                                1.40%
                 5.00%


                 0.00%                                                                                          1.30%
                                    FY09          FY10             FY11           FY12E           FY13E

                                                            RoE%          RoA% (RHS)


                          RoA Decomposition              FY09         FY10             FY11      FY12E          FY13E

                 Yield on Assets                      10.04%          7.99%            8.47%      8.97%         9.00%

                 Less: Cost of Assets                    7.48%        5.34%            5.86%      6.43%         6.39%

                 Net Interest Income                     2.55%        2.66%            2.61%      2.53%         2.61%

                 Other Income                            2.19%        1.94%            1.31%      1.30%         1.39%

                 Less: Operating Exp                     2.10%
                                                         2 10%        1.69%
                                                                      1 69%            1.43%
                                                                                       1 43%      1.46%
                                                                                                  1 46%         1.59%
                                                                                                                1 59%

                 Less: Provisions                        0.31%        0.46%            0.21%      0.20%         0.25%

                 Less: Tax                               0.81%        0.84%            0.77%      0.74%         0.73%

                 RoA                                     1.52%        1.61%            1.52%      1.44%         1.43%

                                                                                 Source: Company, Microsec Research


                                                    20

20th June’2011                                                                                            Microsec Research
Peer Analysis
     Particulars (In Mn)           Yes Bank           ICICI Bank         HDFC Bank     Axis Bank         ING Vysya Bank       Indusind Bank


     Net Interest Income*          12469.20            90169.00          105431.30     65629.90             10065.20            13764.90
  CAGR Growth (5 yrs) (%)            64.25               7.97                29.84       43.15                16.73               50.07
            PAT*                    7271.30            51513.80            39263.90    33884.90              3186.50             5773.20
  CAGR Growth (5 yrs) (%)            66.61
                                     66 61              13.44
                                                        13 44                36.18
                                                                             36 18       50.58
                                                                                         50 58                37.59
                                                                                                              37 59               70.56
                                                                                                                                  70 56
            EPS*                     20.95              44.72                84.40       82.54                26.34               12.39
            BVS**                   109.30               451                 541        441.00                208.3               80.08
      Deposits (in bn)**            459.39             2256.02              2085.86     1892.38              301.94              343.65
      Advances (in bn)**            343.64             2163.66              1599.83     1424.08              236.02              261.66
       No of Branches**               214               2529                 1825        1390                  500                245
       Mkt Cap (in bn)               104.5             1251.09              1112.62     526.40                41.10              123.01


         Key Ratios
          CASA%*                     10.34               45                  52.7        41.1                 34.6                27.2
            SA%*                      1.8                29.6                30.4        21.6                 17.7                 8.9
          NIM (%)*                    2.8                2.6                  4.2         3.7                 2.85                 3.5
         GNPA (%)**                  0.23                4.47                1.05        1.01                 2.30                1.01
         NNPA (%)**                  0.03                1.11                0.20        0.26                 0.39                0.28
    Restructured Assets %             0.2                1.2                  0.3         1.4                  0.3                 0.3
             ( )
          PCR(%)*                    88.6                76                     83          81                83.4                72.6
          CAR (%)*                   16.5               19.54                16.2        12.65                12.94               15.89
   Mkt Cap / Branch (in bn)          0.49                0.49                0.61        0.38                 0.08                0.50
       Div Yield (%) *               0.84                1.29                0.69        1.10                 0.87                0.76
          ROA (%)*                    1.5                1.3                  1.6         1.6                  1.0                 1.3
          ROE (%)*                   21.0                11.0                17.0        19.0                 12.0                14.6


         Valuations
           Price                      298               1085                 2389        1275                 345.3
                                                                                                              345 3               264
             P/E                     14.23              24.26                28.31       15.45                13.11               21.31
            P/BV                     2.73                2.41                4.42        2.89                 1.66                3.30
       P/E (5 YR Avg)                22.90              23.90                29.48       21.34                15.98               23.72
      P/BV (5 YR Avg)                3.55                2.48                4.93        3.33                 1.81                2.36
     Prem/(Disc) on P/E              (8.67)              0.36               (1.17)       (5.89)               (2.87)             (2.41)
    Prem/(Disc) on P/BV              (0.82)             (0.07)              (0.51)       (0.44)               (0.15)              0.94


                                Return summary                      1M                 3M                    6M                 12M

                                Axis Bank Ltd.                     -0.58%             4.47%                 -6.53%              2.87%

                                HDFC Bank Ltd.                     4.18%              16.52%                4.33%              24.74%

                                ICICI Bank Ltd.                    -2.54%             11.84%                -5.04%             25.99%

                                IndusInd Bank Ltd.                 1.52%              20.25%                -9.36%             28.78%

                                ING Vysya Bank Ltd.
                                               Ltd                 -2.01%
                                                                   -2 01%             11.98%
                                                                                      11 98%               -17.13%
                                                                                                           -17 13%             -6.06%
                                                                                                                               -6 06%

                                Yes Bank Ltd.                      -1.56%             17.12%                -1.86%             11.59%


* As on Mar’11, ** TTM, Prices as on 1st June’11                                               Source: Company, ACE Equity Microsec Research

                                                                           21

         20th June’2011                                                                                                     Microsec Research
Yes Bank Icr(20th June2011)

Weitere ähnliche Inhalte

Was ist angesagt?

Keynote capitals india morning note jun 19-'12
Keynote capitals india morning note jun 19-'12Keynote capitals india morning note jun 19-'12
Keynote capitals india morning note jun 19-'12Keynote Capitals Ltd.
 
Keynote capitals india morning note jun 11-'12
Keynote capitals india morning note jun 11-'12Keynote capitals india morning note jun 11-'12
Keynote capitals india morning note jun 11-'12Keynote Capitals Ltd.
 
City Report - Delhi Office Market Q2 2010
City Report - Delhi Office Market   Q2 2010City Report - Delhi Office Market   Q2 2010
City Report - Delhi Office Market Q2 2010BNP Paribas Real Estate
 
Corporate financial management
Corporate financial managementCorporate financial management
Corporate financial managementTarun Sharma
 
Keynote capitals india morning note jun 22-'12
Keynote capitals india morning note jun 22-'12Keynote capitals india morning note jun 22-'12
Keynote capitals india morning note jun 22-'12Keynote Capitals Ltd.
 
Keynote capitals india morning note may 24-'12
Keynote capitals india morning note may 24-'12Keynote capitals india morning note may 24-'12
Keynote capitals india morning note may 24-'12Keynote Capitals Ltd.
 
Ratio Analysis of ACI Limited (Bangladesh)
Ratio Analysis of ACI Limited (Bangladesh)Ratio Analysis of ACI Limited (Bangladesh)
Ratio Analysis of ACI Limited (Bangladesh)Sunanda Sarker
 
Keynote capitals india morning note september 14-'12
Keynote capitals india morning note september 14-'12Keynote capitals india morning note september 14-'12
Keynote capitals india morning note september 14-'12Keynote Capitals Ltd.
 
Corporate presentation december
Corporate presentation   decemberCorporate presentation   december
Corporate presentation decemberLLX
 
Keynote capitals india morning note july 31-'12
Keynote capitals india morning note july 31-'12Keynote capitals india morning note july 31-'12
Keynote capitals india morning note july 31-'12Keynote Capitals Ltd.
 
Tim 4 q09 webcast eng_atualizado
Tim 4 q09 webcast eng_atualizadoTim 4 q09 webcast eng_atualizado
Tim 4 q09 webcast eng_atualizadoTIM RI
 
Iron Gate Presentation Halftime 2011
Iron Gate Presentation Halftime 2011Iron Gate Presentation Halftime 2011
Iron Gate Presentation Halftime 2011stevcogg
 
090203 Ubs Raffles Edu Beneficiary Of Aspirational Consumption
090203 Ubs Raffles Edu   Beneficiary Of Aspirational Consumption090203 Ubs Raffles Edu   Beneficiary Of Aspirational Consumption
090203 Ubs Raffles Edu Beneficiary Of Aspirational ConsumptionGan Chuan
 
Infosys Q311 Result Update
Infosys Q311 Result UpdateInfosys Q311 Result Update
Infosys Q311 Result Updateabhiseksasmal
 
Reliance communications ltd
Reliance communications ltdReliance communications ltd
Reliance communications ltdTanay Roy, CFA
 

Was ist angesagt? (20)

Yes Bank
Yes BankYes Bank
Yes Bank
 
Keynote capitals india morning note jun 19-'12
Keynote capitals india morning note jun 19-'12Keynote capitals india morning note jun 19-'12
Keynote capitals india morning note jun 19-'12
 
Keynote capitals india morning note jun 11-'12
Keynote capitals india morning note jun 11-'12Keynote capitals india morning note jun 11-'12
Keynote capitals india morning note jun 11-'12
 
City Report - Delhi Office Market Q2 2010
City Report - Delhi Office Market   Q2 2010City Report - Delhi Office Market   Q2 2010
City Report - Delhi Office Market Q2 2010
 
Corporate financial management
Corporate financial managementCorporate financial management
Corporate financial management
 
Keynote capitals india morning note jun 22-'12
Keynote capitals india morning note jun 22-'12Keynote capitals india morning note jun 22-'12
Keynote capitals india morning note jun 22-'12
 
Keynote capitals india morning note may 24-'12
Keynote capitals india morning note may 24-'12Keynote capitals india morning note may 24-'12
Keynote capitals india morning note may 24-'12
 
RMPG Learning Series CRM Workshop Day 4
RMPG Learning Series CRM Workshop Day 4RMPG Learning Series CRM Workshop Day 4
RMPG Learning Series CRM Workshop Day 4
 
Ratio Analysis of ACI Limited (Bangladesh)
Ratio Analysis of ACI Limited (Bangladesh)Ratio Analysis of ACI Limited (Bangladesh)
Ratio Analysis of ACI Limited (Bangladesh)
 
Keynote capitals india morning note september 14-'12
Keynote capitals india morning note september 14-'12Keynote capitals india morning note september 14-'12
Keynote capitals india morning note september 14-'12
 
Corporate presentation december
Corporate presentation   decemberCorporate presentation   december
Corporate presentation december
 
Keynote capitals india morning note july 31-'12
Keynote capitals india morning note july 31-'12Keynote capitals india morning note july 31-'12
Keynote capitals india morning note july 31-'12
 
Tim 4 q09 webcast eng_atualizado
Tim 4 q09 webcast eng_atualizadoTim 4 q09 webcast eng_atualizado
Tim 4 q09 webcast eng_atualizado
 
Iron Gate Presentation Halftime 2011
Iron Gate Presentation Halftime 2011Iron Gate Presentation Halftime 2011
Iron Gate Presentation Halftime 2011
 
Semiconductor
SemiconductorSemiconductor
Semiconductor
 
Ambuja cements ltd
Ambuja cements ltdAmbuja cements ltd
Ambuja cements ltd
 
090203 Ubs Raffles Edu Beneficiary Of Aspirational Consumption
090203 Ubs Raffles Edu   Beneficiary Of Aspirational Consumption090203 Ubs Raffles Edu   Beneficiary Of Aspirational Consumption
090203 Ubs Raffles Edu Beneficiary Of Aspirational Consumption
 
Infosys Q311 Result Update
Infosys Q311 Result UpdateInfosys Q311 Result Update
Infosys Q311 Result Update
 
2005:Q2
2005:Q22005:Q2
2005:Q2
 
Reliance communications ltd
Reliance communications ltdReliance communications ltd
Reliance communications ltd
 

Andere mochten auch

New Banking License Catalyst For Consolidation
New Banking License Catalyst For ConsolidationNew Banking License Catalyst For Consolidation
New Banking License Catalyst For Consolidationabhiseksasmal
 
Bfsi Q411 Preview (04 04 2011)
Bfsi Q411 Preview (04 04 2011)Bfsi Q411 Preview (04 04 2011)
Bfsi Q411 Preview (04 04 2011)abhiseksasmal
 
Event Note Sebi Clears Ipo Norms For Insurers
Event Note  Sebi Clears Ipo Norms For InsurersEvent Note  Sebi Clears Ipo Norms For Insurers
Event Note Sebi Clears Ipo Norms For Insurersabhiseksasmal
 
Banks Credit Growth Time For Moderation.
Banks Credit Growth   Time For Moderation.Banks Credit Growth   Time For Moderation.
Banks Credit Growth Time For Moderation.abhiseksasmal
 
BFSI Outlook &amp; Top Picks 2011
BFSI Outlook &amp;  Top Picks 2011BFSI Outlook &amp;  Top Picks 2011
BFSI Outlook &amp; Top Picks 2011abhiseksasmal
 
Banking &amp; Nbfc Q411 Earnings &amp; Policy Impacts (23rd May11)
Banking &amp; Nbfc Q411 Earnings &amp; Policy Impacts (23rd May11)Banking &amp; Nbfc Q411 Earnings &amp; Policy Impacts (23rd May11)
Banking &amp; Nbfc Q411 Earnings &amp; Policy Impacts (23rd May11)abhiseksasmal
 

Andere mochten auch (6)

New Banking License Catalyst For Consolidation
New Banking License Catalyst For ConsolidationNew Banking License Catalyst For Consolidation
New Banking License Catalyst For Consolidation
 
Bfsi Q411 Preview (04 04 2011)
Bfsi Q411 Preview (04 04 2011)Bfsi Q411 Preview (04 04 2011)
Bfsi Q411 Preview (04 04 2011)
 
Event Note Sebi Clears Ipo Norms For Insurers
Event Note  Sebi Clears Ipo Norms For InsurersEvent Note  Sebi Clears Ipo Norms For Insurers
Event Note Sebi Clears Ipo Norms For Insurers
 
Banks Credit Growth Time For Moderation.
Banks Credit Growth   Time For Moderation.Banks Credit Growth   Time For Moderation.
Banks Credit Growth Time For Moderation.
 
BFSI Outlook &amp; Top Picks 2011
BFSI Outlook &amp;  Top Picks 2011BFSI Outlook &amp;  Top Picks 2011
BFSI Outlook &amp; Top Picks 2011
 
Banking &amp; Nbfc Q411 Earnings &amp; Policy Impacts (23rd May11)
Banking &amp; Nbfc Q411 Earnings &amp; Policy Impacts (23rd May11)Banking &amp; Nbfc Q411 Earnings &amp; Policy Impacts (23rd May11)
Banking &amp; Nbfc Q411 Earnings &amp; Policy Impacts (23rd May11)
 

Ähnlich wie Yes Bank Icr(20th June2011)

Sept 2009 introduction to incubator-fund model
Sept 2009   introduction to incubator-fund modelSept 2009   introduction to incubator-fund model
Sept 2009 introduction to incubator-fund modelDFickett
 
Making BancAssurance Agile - 4th Annual BancAssurance Conference
Making BancAssurance Agile - 4th Annual BancAssurance ConferenceMaking BancAssurance Agile - 4th Annual BancAssurance Conference
Making BancAssurance Agile - 4th Annual BancAssurance ConferenceAgile Financial Technologies
 
valero energy Credit Suisse Energy Summit - February 5, 2009
valero energy Credit Suisse Energy Summit - February 5, 2009valero energy Credit Suisse Energy Summit - February 5, 2009
valero energy Credit Suisse Energy Summit - February 5, 2009finance2
 
Cpm Introduction
Cpm IntroductionCpm Introduction
Cpm IntroductionEric Kuo
 
Presentation taoufiq-lahrach-caisse-centrale-de-garantie-morocco
Presentation taoufiq-lahrach-caisse-centrale-de-garantie-moroccoPresentation taoufiq-lahrach-caisse-centrale-de-garantie-morocco
Presentation taoufiq-lahrach-caisse-centrale-de-garantie-moroccoBilal Chrigui
 
Enterprise Risk Management: Balancing Threats and Profitability (Credit Union...
Enterprise Risk Management: Balancing Threats and Profitability (Credit Union...Enterprise Risk Management: Balancing Threats and Profitability (Credit Union...
Enterprise Risk Management: Balancing Threats and Profitability (Credit Union...NAFCU Services Corporation
 
Pinc excel mf pms
Pinc excel mf pmsPinc excel mf pms
Pinc excel mf pmsPINCMONEY
 
The Future of OTC Markets - ISDA/PRMIA talk
The Future of OTC Markets - ISDA/PRMIA talkThe Future of OTC Markets - ISDA/PRMIA talk
The Future of OTC Markets - ISDA/PRMIA talkJohn Wilson
 
Capital Management & Impacts to Financial Analysis - Technology Media
Capital Management & Impacts to Financial Analysis - Technology MediaCapital Management & Impacts to Financial Analysis - Technology Media
Capital Management & Impacts to Financial Analysis - Technology MediaRichard Chan, MBA
 
Tim 4 Q09 Webcast Eng 1
Tim 4 Q09 Webcast Eng 1Tim 4 Q09 Webcast Eng 1
Tim 4 Q09 Webcast Eng 1TIM RI
 
AIG Conference Call Credit Presentation - February 29, 2008
AIG Conference Call Credit Presentation - February 29, 2008AIG Conference Call Credit Presentation - February 29, 2008
AIG Conference Call Credit Presentation - February 29, 2008finance2
 
Q3 2009 Earning Report of First Horizon National Corporation
Q3 2009 Earning Report of First Horizon National CorporationQ3 2009 Earning Report of First Horizon National Corporation
Q3 2009 Earning Report of First Horizon National Corporationearningreport earningreport
 
Swedbank CMD Catrin Fransson
Swedbank CMD Catrin FranssonSwedbank CMD Catrin Fransson
Swedbank CMD Catrin FranssonSwedbank
 
FIS Road Show Presentation June 2008
FIS Road Show Presentation June 2008FIS Road Show Presentation June 2008
FIS Road Show Presentation June 2008finance48
 
Financial analysis - MBIA Inc. provides financial guarantee insurance and …
Financial analysis - MBIA Inc. provides financial guarantee insurance and …Financial analysis - MBIA Inc. provides financial guarantee insurance and …
Financial analysis - MBIA Inc. provides financial guarantee insurance and …BCV
 
Key Banc Conference Final[1]
Key Banc Conference Final[1]Key Banc Conference Final[1]
Key Banc Conference Final[1]BSTRINGE
 
SAS Risk Management for Insurance
SAS Risk Management for InsuranceSAS Risk Management for Insurance
SAS Risk Management for Insurancestuartdrose
 
Boscheck wp 2006_6_level_1
Boscheck wp 2006_6_level_1Boscheck wp 2006_6_level_1
Boscheck wp 2006_6_level_1Devesh Pant
 
Access Bank Seminar Session 3b - Ebenezer Olufowose
Access Bank Seminar Session 3b - Ebenezer OlufowoseAccess Bank Seminar Session 3b - Ebenezer Olufowose
Access Bank Seminar Session 3b - Ebenezer Olufowoseproshare
 

Ähnlich wie Yes Bank Icr(20th June2011) (20)

Sept 2009 introduction to incubator-fund model
Sept 2009   introduction to incubator-fund modelSept 2009   introduction to incubator-fund model
Sept 2009 introduction to incubator-fund model
 
Making BancAssurance Agile - 4th Annual BancAssurance Conference
Making BancAssurance Agile - 4th Annual BancAssurance ConferenceMaking BancAssurance Agile - 4th Annual BancAssurance Conference
Making BancAssurance Agile - 4th Annual BancAssurance Conference
 
valero energy Credit Suisse Energy Summit - February 5, 2009
valero energy Credit Suisse Energy Summit - February 5, 2009valero energy Credit Suisse Energy Summit - February 5, 2009
valero energy Credit Suisse Energy Summit - February 5, 2009
 
Cpm Introduction
Cpm IntroductionCpm Introduction
Cpm Introduction
 
Presentation taoufiq-lahrach-caisse-centrale-de-garantie-morocco
Presentation taoufiq-lahrach-caisse-centrale-de-garantie-moroccoPresentation taoufiq-lahrach-caisse-centrale-de-garantie-morocco
Presentation taoufiq-lahrach-caisse-centrale-de-garantie-morocco
 
Enterprise Risk Management: Balancing Threats and Profitability (Credit Union...
Enterprise Risk Management: Balancing Threats and Profitability (Credit Union...Enterprise Risk Management: Balancing Threats and Profitability (Credit Union...
Enterprise Risk Management: Balancing Threats and Profitability (Credit Union...
 
Pinc excel mf pms
Pinc excel mf pmsPinc excel mf pms
Pinc excel mf pms
 
The Future of OTC Markets - ISDA/PRMIA talk
The Future of OTC Markets - ISDA/PRMIA talkThe Future of OTC Markets - ISDA/PRMIA talk
The Future of OTC Markets - ISDA/PRMIA talk
 
Capital Management & Impacts to Financial Analysis - Technology Media
Capital Management & Impacts to Financial Analysis - Technology MediaCapital Management & Impacts to Financial Analysis - Technology Media
Capital Management & Impacts to Financial Analysis - Technology Media
 
Tim 4 Q09 Webcast Eng 1
Tim 4 Q09 Webcast Eng 1Tim 4 Q09 Webcast Eng 1
Tim 4 Q09 Webcast Eng 1
 
AIG Conference Call Credit Presentation - February 29, 2008
AIG Conference Call Credit Presentation - February 29, 2008AIG Conference Call Credit Presentation - February 29, 2008
AIG Conference Call Credit Presentation - February 29, 2008
 
Market Risk
Market RiskMarket Risk
Market Risk
 
Q3 2009 Earning Report of First Horizon National Corporation
Q3 2009 Earning Report of First Horizon National CorporationQ3 2009 Earning Report of First Horizon National Corporation
Q3 2009 Earning Report of First Horizon National Corporation
 
Swedbank CMD Catrin Fransson
Swedbank CMD Catrin FranssonSwedbank CMD Catrin Fransson
Swedbank CMD Catrin Fransson
 
FIS Road Show Presentation June 2008
FIS Road Show Presentation June 2008FIS Road Show Presentation June 2008
FIS Road Show Presentation June 2008
 
Financial analysis - MBIA Inc. provides financial guarantee insurance and …
Financial analysis - MBIA Inc. provides financial guarantee insurance and …Financial analysis - MBIA Inc. provides financial guarantee insurance and …
Financial analysis - MBIA Inc. provides financial guarantee insurance and …
 
Key Banc Conference Final[1]
Key Banc Conference Final[1]Key Banc Conference Final[1]
Key Banc Conference Final[1]
 
SAS Risk Management for Insurance
SAS Risk Management for InsuranceSAS Risk Management for Insurance
SAS Risk Management for Insurance
 
Boscheck wp 2006_6_level_1
Boscheck wp 2006_6_level_1Boscheck wp 2006_6_level_1
Boscheck wp 2006_6_level_1
 
Access Bank Seminar Session 3b - Ebenezer Olufowose
Access Bank Seminar Session 3b - Ebenezer OlufowoseAccess Bank Seminar Session 3b - Ebenezer Olufowose
Access Bank Seminar Session 3b - Ebenezer Olufowose
 

Kürzlich hochgeladen

PMFBY , Pradhan Mantri Fasal bima yojna
PMFBY , Pradhan Mantri  Fasal bima yojnaPMFBY , Pradhan Mantri  Fasal bima yojna
PMFBY , Pradhan Mantri Fasal bima yojnaDharmendra Kumar
 
Unit 4.1 financial markets operations .pdf
Unit 4.1 financial markets operations .pdfUnit 4.1 financial markets operations .pdf
Unit 4.1 financial markets operations .pdfSatyamSinghParihar2
 
Stock Market Brief Deck FOR 4/17 video.pdf
Stock Market Brief Deck FOR 4/17 video.pdfStock Market Brief Deck FOR 4/17 video.pdf
Stock Market Brief Deck FOR 4/17 video.pdfMichael Silva
 
Amil Baba In Pakistan amil baba in Lahore amil baba in Islamabad amil baba in...
Amil Baba In Pakistan amil baba in Lahore amil baba in Islamabad amil baba in...Amil Baba In Pakistan amil baba in Lahore amil baba in Islamabad amil baba in...
Amil Baba In Pakistan amil baba in Lahore amil baba in Islamabad amil baba in...amilabibi1
 
AnyConv.com__FSS Advance Retail & Distribution - 15.06.17.ppt
AnyConv.com__FSS Advance Retail & Distribution - 15.06.17.pptAnyConv.com__FSS Advance Retail & Distribution - 15.06.17.ppt
AnyConv.com__FSS Advance Retail & Distribution - 15.06.17.pptPriyankaSharma89719
 
Unveiling Poonawalla Fincorp’s Phenomenal Performance Under Abhay Bhutada’s L...
Unveiling Poonawalla Fincorp’s Phenomenal Performance Under Abhay Bhutada’s L...Unveiling Poonawalla Fincorp’s Phenomenal Performance Under Abhay Bhutada’s L...
Unveiling Poonawalla Fincorp’s Phenomenal Performance Under Abhay Bhutada’s L...beulahfernandes8
 
Financial Preparation for Millennia.pptx
Financial Preparation for Millennia.pptxFinancial Preparation for Millennia.pptx
Financial Preparation for Millennia.pptxsimon978302
 
Overview of Inkel Unlisted Shares Price.
Overview of Inkel Unlisted Shares Price.Overview of Inkel Unlisted Shares Price.
Overview of Inkel Unlisted Shares Price.Precize Formely Leadoff
 
NO1 Certified kala jadu karne wale ka contact number kala jadu karne wale bab...
NO1 Certified kala jadu karne wale ka contact number kala jadu karne wale bab...NO1 Certified kala jadu karne wale ka contact number kala jadu karne wale bab...
NO1 Certified kala jadu karne wale ka contact number kala jadu karne wale bab...Amil baba
 
Kempen ' UK DB Endgame Paper Apr 24 final3.pdf
Kempen ' UK DB Endgame Paper Apr 24 final3.pdfKempen ' UK DB Endgame Paper Apr 24 final3.pdf
Kempen ' UK DB Endgame Paper Apr 24 final3.pdfHenry Tapper
 
NO1 Certified Amil Baba In Lahore Kala Jadu In Lahore Best Amil In Lahore Ami...
NO1 Certified Amil Baba In Lahore Kala Jadu In Lahore Best Amil In Lahore Ami...NO1 Certified Amil Baba In Lahore Kala Jadu In Lahore Best Amil In Lahore Ami...
NO1 Certified Amil Baba In Lahore Kala Jadu In Lahore Best Amil In Lahore Ami...Amil baba
 
NO1 Certified Black Magic Specialist Expert In Bahawalpur, Sargodha, Sialkot,...
NO1 Certified Black Magic Specialist Expert In Bahawalpur, Sargodha, Sialkot,...NO1 Certified Black Magic Specialist Expert In Bahawalpur, Sargodha, Sialkot,...
NO1 Certified Black Magic Specialist Expert In Bahawalpur, Sargodha, Sialkot,...Amil baba
 
Guard Your Investments- Corporate Defaults Alarm.pdf
Guard Your Investments- Corporate Defaults Alarm.pdfGuard Your Investments- Corporate Defaults Alarm.pdf
Guard Your Investments- Corporate Defaults Alarm.pdfJasper Colin
 
NO1 Certified Black Magic Removal in Uk kala jadu Specialist kala jadu for Lo...
NO1 Certified Black Magic Removal in Uk kala jadu Specialist kala jadu for Lo...NO1 Certified Black Magic Removal in Uk kala jadu Specialist kala jadu for Lo...
NO1 Certified Black Magic Removal in Uk kala jadu Specialist kala jadu for Lo...Amil baba
 
Financial analysis on Risk and Return.ppt
Financial analysis on Risk and Return.pptFinancial analysis on Risk and Return.ppt
Financial analysis on Risk and Return.ppttadegebreyesus
 
2024-04-09 - Pension Playpen roundtable - slides.pptx
2024-04-09 - Pension Playpen roundtable - slides.pptx2024-04-09 - Pension Playpen roundtable - slides.pptx
2024-04-09 - Pension Playpen roundtable - slides.pptxHenry Tapper
 
Money Forward Integrated Report “Forward Map” 2024
Money Forward Integrated Report “Forward Map” 2024Money Forward Integrated Report “Forward Map” 2024
Money Forward Integrated Report “Forward Map” 2024Money Forward
 
INTERNATIONAL TRADE INSTITUTIONS[6].pptx
INTERNATIONAL TRADE INSTITUTIONS[6].pptxINTERNATIONAL TRADE INSTITUTIONS[6].pptx
INTERNATIONAL TRADE INSTITUTIONS[6].pptxaymenkhalfallah23
 
『澳洲文凭』买科廷大学毕业证书成绩单办理澳洲Curtin文凭学位证书
『澳洲文凭』买科廷大学毕业证书成绩单办理澳洲Curtin文凭学位证书『澳洲文凭』买科廷大学毕业证书成绩单办理澳洲Curtin文凭学位证书
『澳洲文凭』买科廷大学毕业证书成绩单办理澳洲Curtin文凭学位证书rnrncn29
 
Liquidity Decisions in Financial management
Liquidity Decisions in Financial managementLiquidity Decisions in Financial management
Liquidity Decisions in Financial managementshrutisingh143670
 

Kürzlich hochgeladen (20)

PMFBY , Pradhan Mantri Fasal bima yojna
PMFBY , Pradhan Mantri  Fasal bima yojnaPMFBY , Pradhan Mantri  Fasal bima yojna
PMFBY , Pradhan Mantri Fasal bima yojna
 
Unit 4.1 financial markets operations .pdf
Unit 4.1 financial markets operations .pdfUnit 4.1 financial markets operations .pdf
Unit 4.1 financial markets operations .pdf
 
Stock Market Brief Deck FOR 4/17 video.pdf
Stock Market Brief Deck FOR 4/17 video.pdfStock Market Brief Deck FOR 4/17 video.pdf
Stock Market Brief Deck FOR 4/17 video.pdf
 
Amil Baba In Pakistan amil baba in Lahore amil baba in Islamabad amil baba in...
Amil Baba In Pakistan amil baba in Lahore amil baba in Islamabad amil baba in...Amil Baba In Pakistan amil baba in Lahore amil baba in Islamabad amil baba in...
Amil Baba In Pakistan amil baba in Lahore amil baba in Islamabad amil baba in...
 
AnyConv.com__FSS Advance Retail & Distribution - 15.06.17.ppt
AnyConv.com__FSS Advance Retail & Distribution - 15.06.17.pptAnyConv.com__FSS Advance Retail & Distribution - 15.06.17.ppt
AnyConv.com__FSS Advance Retail & Distribution - 15.06.17.ppt
 
Unveiling Poonawalla Fincorp’s Phenomenal Performance Under Abhay Bhutada’s L...
Unveiling Poonawalla Fincorp’s Phenomenal Performance Under Abhay Bhutada’s L...Unveiling Poonawalla Fincorp’s Phenomenal Performance Under Abhay Bhutada’s L...
Unveiling Poonawalla Fincorp’s Phenomenal Performance Under Abhay Bhutada’s L...
 
Financial Preparation for Millennia.pptx
Financial Preparation for Millennia.pptxFinancial Preparation for Millennia.pptx
Financial Preparation for Millennia.pptx
 
Overview of Inkel Unlisted Shares Price.
Overview of Inkel Unlisted Shares Price.Overview of Inkel Unlisted Shares Price.
Overview of Inkel Unlisted Shares Price.
 
NO1 Certified kala jadu karne wale ka contact number kala jadu karne wale bab...
NO1 Certified kala jadu karne wale ka contact number kala jadu karne wale bab...NO1 Certified kala jadu karne wale ka contact number kala jadu karne wale bab...
NO1 Certified kala jadu karne wale ka contact number kala jadu karne wale bab...
 
Kempen ' UK DB Endgame Paper Apr 24 final3.pdf
Kempen ' UK DB Endgame Paper Apr 24 final3.pdfKempen ' UK DB Endgame Paper Apr 24 final3.pdf
Kempen ' UK DB Endgame Paper Apr 24 final3.pdf
 
NO1 Certified Amil Baba In Lahore Kala Jadu In Lahore Best Amil In Lahore Ami...
NO1 Certified Amil Baba In Lahore Kala Jadu In Lahore Best Amil In Lahore Ami...NO1 Certified Amil Baba In Lahore Kala Jadu In Lahore Best Amil In Lahore Ami...
NO1 Certified Amil Baba In Lahore Kala Jadu In Lahore Best Amil In Lahore Ami...
 
NO1 Certified Black Magic Specialist Expert In Bahawalpur, Sargodha, Sialkot,...
NO1 Certified Black Magic Specialist Expert In Bahawalpur, Sargodha, Sialkot,...NO1 Certified Black Magic Specialist Expert In Bahawalpur, Sargodha, Sialkot,...
NO1 Certified Black Magic Specialist Expert In Bahawalpur, Sargodha, Sialkot,...
 
Guard Your Investments- Corporate Defaults Alarm.pdf
Guard Your Investments- Corporate Defaults Alarm.pdfGuard Your Investments- Corporate Defaults Alarm.pdf
Guard Your Investments- Corporate Defaults Alarm.pdf
 
NO1 Certified Black Magic Removal in Uk kala jadu Specialist kala jadu for Lo...
NO1 Certified Black Magic Removal in Uk kala jadu Specialist kala jadu for Lo...NO1 Certified Black Magic Removal in Uk kala jadu Specialist kala jadu for Lo...
NO1 Certified Black Magic Removal in Uk kala jadu Specialist kala jadu for Lo...
 
Financial analysis on Risk and Return.ppt
Financial analysis on Risk and Return.pptFinancial analysis on Risk and Return.ppt
Financial analysis on Risk and Return.ppt
 
2024-04-09 - Pension Playpen roundtable - slides.pptx
2024-04-09 - Pension Playpen roundtable - slides.pptx2024-04-09 - Pension Playpen roundtable - slides.pptx
2024-04-09 - Pension Playpen roundtable - slides.pptx
 
Money Forward Integrated Report “Forward Map” 2024
Money Forward Integrated Report “Forward Map” 2024Money Forward Integrated Report “Forward Map” 2024
Money Forward Integrated Report “Forward Map” 2024
 
INTERNATIONAL TRADE INSTITUTIONS[6].pptx
INTERNATIONAL TRADE INSTITUTIONS[6].pptxINTERNATIONAL TRADE INSTITUTIONS[6].pptx
INTERNATIONAL TRADE INSTITUTIONS[6].pptx
 
『澳洲文凭』买科廷大学毕业证书成绩单办理澳洲Curtin文凭学位证书
『澳洲文凭』买科廷大学毕业证书成绩单办理澳洲Curtin文凭学位证书『澳洲文凭』买科廷大学毕业证书成绩单办理澳洲Curtin文凭学位证书
『澳洲文凭』买科廷大学毕业证书成绩单办理澳洲Curtin文凭学位证书
 
Liquidity Decisions in Financial management
Liquidity Decisions in Financial managementLiquidity Decisions in Financial management
Liquidity Decisions in Financial management
 

Yes Bank Icr(20th June2011)

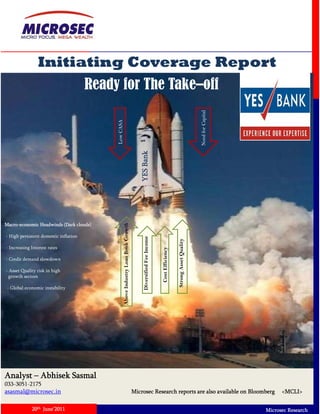
  • 1. Initiating Coverage Report Ready for The Take–off Need for Capital Low CASA nk YES Ban - On-a On a restructuring mode restructuring mode g g Macro-economic Headwinds (Dark clouds) Above Industry Loan Book Growth - High persistent domestic inflation Diversified Fe Income Strong Asset Quality - Increasing Interest rates iency ee - Credit demand slowdown t Cost Effici - Asset Quality risk in high growth sectors - Global economic instability Theme for growth • Branch expansion • Capital Infusion • Restructuring the balance sheet profile Analyst – Abhisek Sasmal 033-3051-2175 asasmal@microsec.in Microsec Research reports are also available on Bloomberg <MCLI> 20th June’2011 Microsec Research
  • 2. Contents Investment & Valuation Brief 2 Company background 3-4 YES Bank – Launch Pad – Version 2.0 (the take off ) 5 Investment rationales 6-20 Peer Analysis 21 On the footsteps of leaders (Comparative study of Yes Bank with Axis & HDFC bank) 22 Stock Cues 23 Sensitivity Analysis 24 Valuation & Recommendation 25 Financial Projections 26 Ratios 27 Key concern to our call 28 Appendix – 1 (Typical YES bank branch) 29 Appendix – 2 (Macro Picture – Light at the end of the tunnel!!) 30 Note 31 Analyst page 32 Other Banking reports 33 Disclaimer 34 1 20th June’2011 Microsec Research
  • 3. YES Bank (Version 2.0 on course) Yes Bank has experienced unprecedented growth in the Indian banking sector since it BUY started operations in late 2004. This is a significant achievement for a bank which had Market Data started late when compared to other new age private sector banks. The bank Current Market Price (INR) 282 differentiated itself from other players in the industry through its unique 'knowledge Target Price (INR) (18 months) 358 banking approach', emphasis on technology, and human resources. The knowledge banking approach was its main pillar of differentiation and using this it provided Upside Potential (annualized) 18% specialized services to various sunrise industries through domain experts. 52 Week High / Low (INR) 388/234 Market Capitalization (In INR Mn) 103263 We re-initiate coverage on Yes Bank with a BUY rating. Our rating underpins the Non- bank’s strong business momentum, diversified revenue stream, strong assets Share Holding pattern% quality, positive asset liability mismatch, strong institutional holding, superior cost Institution s Promoter efficiency, unique technology proposition, high pedigree of Human Capital, thrust on 13% Group improving CASA driven by aggressive branch expansion plans and its superior and Foreign 27% Financial sustainable return ratios. However, heavy dependence on bulk deposits in a rising Institution interest rate scenario slightly impedes our optimism. s / Banks 5% Mutual Funds At the CMP of INR 282 the bank is trading at 1.82x FY13E BV. The bank delivered RoE 5% of over 20% and RoA of 1.5% for FY11. We further expect the bank to deliver RoE of FII 45% Insurance 20%+ on the back of increased leverage, however we may see some pressure on RoA Cos due to moderation in earnings growth going forward on the back of rising loan loss 5% provisions and rising cost. STOCK SCAN We have valued Yes bank on scenario model with different weightage given to each 532648 BSE Code scenario and arrived at a weighted average target price of INR358 which is 2.3x its NSE Code YESBANK FY13E BV of INR 155.4. Our recommended target price is 27% above the current price. YES IN We expect this target price to be met with in 18 months from the date of release of this Bloomberg Ticker report. Reuters Ticker YESB.BO Face Value (INR) 10 Key Risks - 1) Further rise in wholesale deposit cost. 2) Deferment of capital raising 3471.5 plans due to depressed market condition. 3) Lower than expected improvement in Equity Share Capital (INR. Mn.) CASA. 3) Higher than anticipated rise in slippages due to more focus on the SME Average P/E/PBV (3 yrs) 15.9/2.76 segment. 4) TTM P/BV is still at 30% premium to the average valuation in last rate hike g ) / p g Beta vs Sensex 1.35 cycle. (refer page 28) Average Daily Volmes (6 M) 3181850 Particulars (INR Mn) FY09 FY10 FY11 FY12E FY13E Dividend Yield (%) 0.84 9462.00 13634.85 18702.01 25514.30 33904.26 Total Income Stock Return (1 Yr) 6.25% Growth% 36.89% 44.10% 37.16% 36.43% 32.88% 140.0 NII 5092.99 7879.53 12469.30 16861.89 22086.09 130.0 54.1% 54.71% 58.25% 35.23% 30.98% Growth% 120.0 120 0 Net Profit 3,038 4,777 7,271 9,561 12,087 110.0 100.0 Growth% 51.90% 57.24% 52.22% 31.48% 26.42% 90.0 10.23 14.06 20.95 26.91 33.55 EPS 80.0 70.0 P/E * 27.66 20.12 13.51 10.52 8.44 NIM% 2.70% 2.80% 2.80% 2.53% 2.61% ROE (Reported till FY11) 20.70% 20.3% 21.7% 20.93% 21.59% Yes Bank SENSEX NNPA% 0.33 0.06 0.03 0.09 0.06 BV 54.69 90.95 109.29 128.54 155.41 P/BV* 5.17 3.11 2.59 2.20 1.82 Analyst – Abhisek Sasmal Adj.BV 53.99 90.25 108.59 127.84 154.71 91-033-3051-2175 asasmal@microsec.in P/Adj. BV * 5.24 3.14 2.61 2.21 1.83 * All prices as on 17th June’11 Source: Company, Microsec Research 20th June’2011 Microsec Research
  • 4. Company Background Yes Bank limited (YBL), incorporated in 2003 by Rana Kapoor and Late Ashok Kapur, is a new age private sector bank. It is the only bank that has been awarded a greenfield license by the Reserve Bank of India (RBI) in the last 16 years. YBL offers a full range of products and services in areas of corporate and institutional banking, financial markets, investment banking, corporate finance, business and transaction banking, retail and wealth management across India. The bank is part of global thought leadership forums like the Clinton Global Initiative (CGI), Triple Bottom Line Investing (TBLI) and Tallberg Forum. Recently, it became the first Indian Bank to become a signatory with the United Nations Environment Programme (Financial Initiative). Yes Bank has partnered with various companies for delivering quality products and services namely Cash Tech, Cisco Systems, Gartner, Intel, i-flex, Reuters, VSNL, Wipro, De La Rue, Murex, Wincor Nixdorf and Sanovi. This new age private bank has global institutional investors like Rabobank, Franklin Templeton, AIF Capital and Fidelity, amongst others Received RBI license for commercial banking Maiden public offering of equity Shares issued at premium of Rs Launch of financial market business shares by the bank 259.5 to QIBs Incorporation NOV’03 MAY’04 AUG’04 SEP’04 OCT’04 JUNE’05 AUG’07 JAN’10 Launch of Corporate and Business Launch of Launch of Yes International Banking banking Transaction Banking business Source: Company website 3 20th June’2011 Microsec Research
  • 5. Key Management Personnel Name Designation Previous Assignment Managing Partner / CEO & Managing Director - Rabo India, Bank of Rana Kapoor Founder/ Managing Director & CEO America (16 years) Rajat Monga Group President – Financial Markets & CFO Head of Treasury - Rabo India Executive Director and Country Head - Avigo Capital Partners/ Bank of Varun Tuli Group President – Branch Banking America Sumit Gupta President – Commercial Banking Associate Director & Head (North) - Rabo India President & Global Head – International Banking Arun Agrawal General Manager – ICRA General Surendra Jalan President – Indian Financial Institutions AGM AGM, Corporate Banking - ICICI Bank Group President– Corporate Finance and Somak Ghosh Director – Project Advisory & Infrastructure Mgmt - Rabo India Development Banking Group President –Transaction Banking Group, p g p, Global Transaction Services Head - Caribbean, Central & Latin America, , , Suresh Sethi S h S hi International Banking, Liabilities Product Mgt. Citibank President & Sr. Managing Director – Investment Aditya Sanghi Executive Director, Head of Mergers & Acquisitions - Rabo India Banking Group President and Chief Risk Officer Executive Kavita Venugopal Investment Banking, Kotak Mahindra Capital Company Director Alok Rastogi President & Chief Operating Officer Citibank N.A. Equity History Total amount raised Equity Capital Equity Dilution Particulars Issues (INR Mn) (INR Mn) (%) 5-Jul-05 IPO at INR 45 per share 3150 2700 35% Private placement of 10 Mn shares at INR 120 22-Dec-06 1200 2800 4% to Swiss Reinsurance Private placement of 14.7 Mn shares at INR 225 7-Dec-07 3308 2947 5% to Gl b l T Global Tamarind F d P Ltd i d Fund Pte L d 27-Jan-10 Issuance of 38.36mn shares to QIBs at INR269.5 1033.8 3386.3 13% Strong Institutional holding Name % of Shares as on Mar'11 American Funds Insurance Series Growth Fund 4.92 HSBC Bank Mauritius Ltd A/c HSBC IRIS Investments Mauritius Ltd 4.84 RaboBank International Holding BV 4.81 Titiwangsa Investments Mauritius Ltd 4.23 SmallCap World Fund Inc 3.82 Morgan Stanley Mauritius Company Ltd 2.27 Life I Lif Insurance Corporaiton of India C i f I di 1.92 1 92 JP Morgan Funds 1.61 Deutsche Securities Mauritius Ltd 1.35 Franklin India Prima Fund 1.03 4 Source: ACE Equity, Company website 20th June’2011 Microsec Research
  • 6. YES Bank – Launch Pad – Version 2.0 (the take off ) At the end of Mar'15 At the end of Mar'11 Implied CAGR% (Target) Advances (INR Bn) 343.64 1000.00 30.60% Deposits (INR Bn) 459.39 1250.00 28.42% Balance sheet Size (INR Bn) 590.07 1500.00 26.24% Branches 214 750 36.77% Employees 3990 12000 33.40% NIM% 2.8% 2 8% 4.0% 4 0% RoE% (reported) 21.70% 22-24% RoA% 1.52% 1.6-1.75% Relationship / Product Matrix – to support growth 5 Source: Company website 20th June’2011 Microsec Research
  • 7. Investment rationale Business Momentum to continue YBL’s loan book has grown at a CAGR of 52.9% over the last 5 years, which is well above the average industry growth rate during the same time period. Higher than industry growth led to a consistent improvement in market share for the bank. Market share stood at ~0.92% in FY11 as compared to 0.33% in FY07. Going h d FY07 G i ahead we expect the b k to continue growing at a pace hi h than that of the i d h bank i i higher h h f h industry and d have factored in a CAGR of 28% for FY11-13. The growth will be well supported by aggressive branch expansions, more penetration in the larger corporate segment & retail segment of the loan book. YES bank’s loan book growth aspiration (Version 2.0) is mainly driven by 1) increasing market share and 2) putting revenue growth ahead of increasing cost. However in the long run, this approach from YBL may change due to the need of faster improvements in some key metrics where its lags its larger peers. 800.00 Strong business growth 749.03 400.0% 700.00 350.0% 600.00 562.88 300.0% 500.00 459.39 250.0% 400.00 343.64 200.0% 300.00 300 00 150.0% 150 0% 200.00 100.0% 100.00 50.0% 0.00 0.0% FY05 FY06 FY07 FY08 FY09 FY10 FY11 FY12E FY13E Deposits (INR B ) D i Bn) Advances (INR Bn) Ad B ) YoY D G Y Y Dep. Growth% h% YoY Ad G Y Y Adv. Growth% h% 250 Above industry loan growth from Inception Seasonal weakness in loan growth started to get visible 400 35.0% 216 350 30.0% 200 300 25.0% 161 20.0% 20 0% 150 250 15.0% 200 10.0% 100 150 5.0% 79 100 0.0% 60 50 50 50 -5.0% 32 30 26 0 -10.0% 0 FY06 FY07 FY08 FY09 FY10 FY11 FY12E FY13E Industry Loan growth% YES Bank's Loan Growth% Loan Book (INR Bn) gr% (RHS) Source: Company, Microsec Research 6 20th June’2011 Microsec Research
  • 8. Branch Expansion strategy – well fit to the overall business model Yes Bank currently has a branch count of 214 across 164 cities. It has 91 branch licenses and plans to expand its reach to 250 branches by Q1’FY12 and to 325 branches by Q4’12. With initial focus in liability rich regions of North and West India (75% of branches), the bank now plans for a pan-India presence. The new roll-outs are targeted at improving the SME and retail franchise. The bank plans to roll out 150 branches in South with in two years time. The metro centers are likely to have over 30 branches each in the next few years. YES bank has separate team looking after the inclusive or social banking model (a combination of bricks & Mortar and technology-enabled branches) in Tier-3 to Tier-6 segments of agri-rich Maharashtra, Gujarat, Rajasthan, Haryana, UP & MP. “Low cost – Rapid launch” branches are mapped out for Tier-3 to Tier-6 cities. The branch addition and thrust on retail deposits will help shore up CASA franchise. YES bank uses “Hub and Spoke” model for faster maturity and greater efficiency of branches. This approach has in-turn reduced IT and infrastructure spends. Also, with timely break-even in key branches, cost-to-income for the bank has declined substantially from 53% in FY07 to 36% in FY11. Branch Concentration Pan India Branch expansion. Priority anti-clo wise East 10% ock South 15% North 50% West 25% Source: Company, Microsec Research % Share of Loan Advances Segmentation Clients Typical Exposure Book Comments Corporate & Institutional Very low credit cost, strong asset Above INR 20Bn INR 500 -2000 Mn 65.6% banking quality Commercial Banking > 2Bn & <= 20Bn INR 100-500 Mn 22.5% Medium risk segment Branch Banking <= 2 Bn INR 20-100 Mn 11.9% High yield & High risk segment Source: Company, Microsec Research 7 20th June’2011 Microsec Research
  • 9. Break up advances (Q4’11) Break up of advances based on knowledge based sectors (Q4’11) Branch Others Banking, 11.90 18% Infra & Logistics % 23% Commercial banking, 22.50 % Food & Agri businesses Corporate & Institutional 18% Engineering Banking, 65.60 22% % TMT 14% Healthcare 5% Source: Company, Microsec Research Q4'09 Q4'10 Q4'11 8% 5% 12% 26% 29% 22% 63% 66% 69% Corporate & Institutional Banking Commercial banking Branch Banking 35% Focus on knowledge banking 30% 25% 25% 22% 22.70% 22 70% 20.70% 21.70% 20% 18% 18.10% 17% 19.10% 16.90% 16% 15% 15% 10% 5% 0% Q4'08 Q4'09 Q4'10 Q4'11 Infra & Logistics Engineering Healthcare TMT Food & Agri businesses Others 8 Source: Company, Microsec Research 20th June’2011 Microsec Research
  • 10. Knowledge banking – a key differentiator YES bank's competence in terms of using high-end technology, its 'knowledge banking' approach, and emphasis on highly qualified human resources helped it to differentiate itself from other private banks in an increasingly commoditized market. In particular, its knowledge banking initiative drew a lot of interest. In the initial phase, the bank planned to target those sectors where the bank has a deep understanding of the industry. The bank has a team of investment banking professionals that h f i l h have h d hands-on expertise i advisory, capital raising and M&A b i i in d i i l ii d businesses. Th There are sector specialists that understand a particular sector and know the business intricacies to structure superior solutions from a banking perspective. Skilled p p people Superior technology Knowledge banking Unique Technology Proposition High pedigree Human Capital Edu Background (FY10) Work exp (Yrs) (FY10) 11-15 16-20 > 21 CA/C 0% 4% 1% S LLB 6% 1% 0-1 16% 6-10 20% MBAs Gradu G d 36% ates 50% 2-5 59% PG 7% Source: Company, Microsec Research 9 20th June’2011 Microsec Research
  • 11. CASA augmentation remains the key B2B2C Strategy Identifying current YES bank’s deposit base grew 5.6x within 5 year’s time, registering a CAGR of 53.75% over FY07- account rich FY11 mainly due to base effect. However, the bank has historically relied more on wholesale corporate customers deposits to ramp up loan growth. In addition, relatively lower branches (most of the branches being new) impacted the CASA mobilization of the bank. Yes Bank's proportion of low cost deposits (CASA) is amongst the lowest in the Industry. However, in absolute numbers CASA has grown at 78% CAGR d i FY07 FY11 Y B k i l ki to d i value f during FY07‐FY11. Yes Bank is looking derive l from planned b l d branch expansion h i Offering them salary and increase penetration to improve its CASA ratio. Management wants to increase the CASA share a/c and various other to 30% by FY15. However, we expect a gradual improvement in the YBL’s CASA ratio from current wealth management products 10.3% to 12.5% till FY 2013. FY13 onwards, CASA mobilization may gain higher momentum as almost 60% of the branches likely to cross breakeven productivity by then. The CASA share may throw some positive surprises if the overall balance sheet growth lags the CASA growth. We expect CASA deposits to grow at a CAGR of 48.6% over FY10‐FY13. Of the incremental accretion to Offering them superior cash deposits, we expect the CASA contribution at 15.8% between Mar’11 to Mar’13. management & liquidity management solution including a SB a/c 80% Above industry deposit growth 70% Tied up with the corporates 60% to tap a rich source of 50% references 40% 30% 27% 28% 20% 19% 18% 10% With larger share of Current 0% account in YBL’s overall CASA, economically the value FY08 FY09 FY10 FY11 FY12E FY13E of this 10% CASA is comparable to any bank which has 15-16% a y ba c as 5 6% Industry Deposit g y p growth% YES Bank's Dep. Growth% p CASA with more share from Source: Company, Microsec Research SA. Thus any event related to savings bank rate de-regulation will be structurally positive for this bank. 45% 39.50% Dependence on wholesale deposits – may put NIMs under pressure in an 40% increasing rate scenario 35% 30% 25% 20% 15% 13.20% 12.10% 10.90% 10.30% 10% 7.50% 6.40% 5% 0% FD - C Corp FD - b branch h FD - FD- G Govt CDs C Institutioanl i i l CASA banking banking Commercial Deposits banking Q4'09 Q4'10 Q4'11 10 Source: Company, Microsec Research 20th June’2011 Microsec Research
  • 12. 400 Strong Branch expansion 350 80 350 70 275 300 60 250 50 214 200 40 150 150 117 30 100 67 20 YES bank’s newer branches are 40 50 17 10 reaching the critical inflexion point where they can attract 0 0 more customers due to their FY06 FY07 FY08 FY09 FY10 FY11 FY12E FY13E reach & faster productivity productivity. More and more newer branches No of branches Expansion (RHS) are coming up in Tier-2 & Tier- 3 cities. These branches will Source: Company, Microsec Research reach break even faster than their Urban peers due to lower 300.0 14.00% CASA mobilization per branch on the rise cost and less competition. All these will led to faster CASA 250.0 12.00% mobilization in branch level with faster improvement for 10.00% 10 00% CASA/branch. 200.0 8.00% 150.0 6.00% 100.0 4.00% 50.0 2.00% 0.0 0.00% FY06 FY07 FY08 FY09 FY10 FY11 FY12E FY13E CASA per branch (in Mn) CASA% Source: Company, Microsec Research FY07 FY08 FY09 FY10 FY11 FY12E FY13E CAGR% CA 4158.9 9821.3 12197.5 24271.6 39338.3 53750.5 74379.0 61.72 SA 579.8 1465.3 1920.6 3909.9 8170.4 12375.0 19250.0 79.30 Term Deposits 77465.3 121445.0 147576.1 239804.1 411880.7 519055.7 655402.9 42.74 Source: Company, Microsec Research 11 20th June’2011 Microsec Research
  • 13. Favorable asset liability mismatch gives support to NIMs Lower CASA has been well compensated by a positive asset liability mismatch in longer term assets. Only 10% of the assets have fixed rate, which means it can raise lending rates quickly when faced with a liquidity squeeze. Longer term assets are mostly financed by borrowings (~76%) mainly term loans. The bank has ample liquidity in the form of short term deposits to finance its shorter term assets (< 1 y) yr). The average tenure of deposit base is about 21 months and loans about 18 months which means g p faster maturity of asset than liabilities. Longer term advances funded by borrowings FY10 FY10 80.0% 75.80% 90% 78.50% 70.0% 80% 70% 60.0% 60% 50.0% 50% 40.0% 40% 30.0% 30% 21.50% 21 50% 20.0% 13.70% 20% 13.70% 8.90% 10% 10.0% 0% 0.0% Advances maturing Infra Exposure Term Loans 3YR+ Dep. as % of 3YR 3YR+ Borr. as % of 3YR+ Adv. as a %of 3Yrs and above + adv 3YR+ adv total adv Positive ALM mismatch 100% 0.60% 0.40% 5.80% 100% 90% 7.90% 16.60% 90% 80% 80% 70% 33.50% 26% 70% 60% 60% 90% 89.50% 50% 50% 18.30% 17.30% 40% 40% 30% 7.70% 30% 20% 38.10% 20% 27.80% 10% 10% 10% 10.50% 0% 0% Advances Deposits Assets Liabilities < 3 mnths 3-6 mnths 6-12 mnths 1-3 yrs 3-5 yrs > 5 yrs Fixed Floating Source: Company, Microsec Research 12 20th June’2011 Microsec Research
  • 14. Margin scenario – strong pricing power may support NIMs YES bank is mostly a wholesale funded bank (refer page 10). Due to the recent hike in retail deposit rates and with wholesale deposit rates at about 10.02% currently, the bank’s cost of funds has increased. The incremental cost of funds is 50-100bps higher currently, compared with the overall cost of funds in December 2010. However, we believe this cost increase is likely to be mitigated (to an extent) by a 200 bps increase in the prime lending rate (PLR) and a 50 bps rise in the base rate (Yes Bank increased its PLR by 50 bps in August 2010 September 2010 December 2010 and May 2010 The PLR is 18 5% and 2010, 2010, 2010. 18.5% the base rate at 9.5% currently). The impact of increasing SB rate by 50 bps will be limited to only 1 bps increase in cost of funds, however the increase in base rate and PLR will enable the bank to partially absorb the increased cost on account of rising interest rates. However, further interest rate hike by RBI will put pressure on its NIMs with a lag as more and more deposits will re-priced later. Short-term interest rate on the rise – making wholesale deposit costly 16 18 14 16 12 14 10 12 10 8 8 6 6 4 4 2 2 0 0 CP 3month CP 6month CP 12 month CD 3month CD 6month CD 12month Rise in cost of funds pressurizing NIMs 15.00% 14.00% 13.63% 13.00% 12.00% 11.84% 11.27% 10.57% 11.30% 11.00% 10.24% 10.00% 9.00% 8.00% 7.00% 6.00% 5.00% 4.00% 2.80% 2.80% 3.00% 2.60% 2.70% 2.53% 2.61% 2.00% 1.00% FY08 FY09 FY10 FY11 FY12E FY13E % yield on advances % yield on investments Cost of deposits% Borrowing cost% NIM% 13 Source: Company, Microsec Research 20th June’2011 Microsec Research
  • 15. Strong core operating income growth & diversified fee revenue YBL’s total income grew strong at a CAGR of 58.8% over FY06-FY11. This is well supported by 69.88% CAGR growth in Net Interest Income (NII) & 45.1% CAGR growth in Other Income over the same period. The dependence on other income (OI/TI) has come down from over 50% in FY05 to 33.3% in FY11. Fee income constitute almost 95% of the other income. Fee income is mainly driven by transaction banking & financial advisory (investment banking and project advisory). We may see some growth moderation i fi h d i in financial market ( i l treasury i i l k (mainly income) i coming quarters d to ) in i due subdued market and rising bond yields. With increasing branch expansion, increasing focus on retail assets and stabilization of new branches, we may see contribution of branch banking in fee income to increase. Overall, we expect the core income for YES bank to outpace the other income during FY10- FY13. We are expecting Total income, NII & Other income to register a CAGR of 35.5%, 41.1% and 27.1% respectively over FY10-FY13. In Mn 40000.0 Core operating Income outpacing non-core income 500.0% 35000.0 450.0% 400.0% 30000.0 350.0% 25000.0 300.0% 20000.0 250.0% 15000.0 1 000 0 200.0% 200 0% 150.0% 10000.0 100.0% 5000.0 50.0% 0.0 0.0% FY05 FY06 FY07 FY08 FY09 FY10 FY11 FY12E FY13E NII Other Income Total Income NII Gr% Other Income Gr% Total Income Gr% In Mn 900.0 Break up of Fee Income 800.0 700.0 600.0 600 0 500.0 400.0 300.0 200.0 100.0 0.0 Q2'10 Q3'10 Q4'10 Q1'11 Q2'11 Q3'11 Q4'11 Transaction Banking Financial Markets Financial Advisory Branch Banking fees and others 14 Source: Company, Microsec Research 20th June’2011 Microsec Research
  • 16. FY15 Fee Income composition FY11 Share Target Drivers Financial Advisory 45.3% 30% Primarily IB and debt syndication. Will moderate, going forward Financials markets 14.5% 30% Fx/derivatives/rates. Driven by strong corporate relationships. A key driver of growth, going forward, given the branch scale Transaction banking 31.4% 30% building up Insurance and MF – growth because of low base and expanding Branch banking 8.8% 10% reach, despite challenging environment Unique cross selling opportunities give multiple & diversified revenue streams Knowledge Sectors Clients segment Credit products Financial Markets Transaction Banking Advisory Services Food & Agri Agro Chemicals √ √ √ √ Life Sciences Drugs √ √ √ √ Engineering Electric comp. √ √ √ TMT IT/Telecom √ √ √ √ Infrastructure Wind Energy √ √ √ √ Source: Company, Microsec Research % Share of Fee income to Total Income (FY11) 50.00% 44.13% 45.00% 40.00% 35.00% 33.90% 31.38% 30.00% 24.02% 25.00% 20.00% YES Bank Axis Bank HDFC Bank ICICI Bank Source: Company, Microsec Research 15 20th June’2011 Microsec Research
  • 17. Cost efficiency one of the best in the industry In comparison with its peer group, YES bank enjoys one of the leanest cost structure which is on account of better business productivity per employee, unique technology proposition. Over the past five years, bank has successfully reduced its cost ratio from 52.88% to 36.35% in FY11. Going forward, we expect this ratio to stabilize at 38‐40% levels with its aggressive hiring and branch expansion plans. Yes bank has also improved its cost/assets by 86 bps over FY08-11, mainly due to p p p y p y better utilization of its infrastructure. These offset its low CASA and somewhat laggard NIM. Productivity ratios of the bank remain as one of the best, regardless of having large number of branch and employee additions every year. Most of the bank's branches are comparatively new and yet to pick up in terms of productivity. Management indicates that increase in productivity (newer branches to matured branches) will limit the upside in cost in coming years. Cost to Income ratio 55.0% 45.0% 39.75% 38.00% 35.0% 36.35% 25.0% FY06 FY07 FY08 FY09 FY10 FY11 FY12E FY13E Staff cost rationalization helped overall cost efficiency 100% 90% 80% 52.09% 51.36% 53.30% 70% 58.20% 60.71% 59.33% 60% 50% 40% 18.24% 18.38% 13.30% 19.80% 13.95% 14.79% 30% 20% 10% 19.87% 18.23% 19.76% 22.12% 22.05% 18.74% 0% FY06 FY07 FY08 FY09 FY10 FY11 Other exp% Depreciation cost% Ad sales& Promotional expenses% Administative expenses % Staff cost% Source: Company, Microsec Research 16 20th June’2011 Microsec Research
  • 18. Assets/Employee (INR Mn) Cost/Assets (%) 2.50% 200 180 2.00% 160 140 120 1.50% 100 80 1.00% 60 40 0.50% 20 0 0.00% FY06 FY07 FY08 FY09 FY10 FY11 FY12E FY13E FY06 FY07 FY08 FY09 FY10 FY11 FY12E FY13E Employee productivity on the rise 18.0 2.5 70 90 16.0 80 60 2.0 70 14.0 50 60 12.0 50 1.5 40 10.0 40 8.0 30 30 1.0 6.0 20 20 10 4.0 0.5 0 2.0 10 -10 0.0 00 0.0 00 0 -20 20 FY06 FY07 FY08 FY09 FY10 FY11 FY12E FY13E FY06 FY07 FY08 FY09 FY10 FY11 FY12E FY13E Business per Employee Profit per Employee(RHS) Employee/Branch Incr Empl/Bran (RHS) Cost/Assets% (FY11) Cost/Income% (FY11) 50.00% 47.90% 3.00% 45.00% 45 00% 42.70% 42.24% 42 24% 2.40% 2 40% 2.50% 40.00% 36.35% 1.96% 2.00% 1.63% 35.00% 1.50% 30.00% 1.15% 25.00% 1.00% 20.00% 0.50% 15.00% 0.00% 10.00% YES bank Axis Bank ICICI Bank HDFC Bank YES bank Axis Bank ICICI Bank HDFC Bank Source: Company, Microsec Research 17 20th June’2011 Microsec Research
  • 19. Asset quality one of the strongest in the industry Due to higher credit exposure to the corporate segment, YES bank enjoys one of the best asset quality in the industry. During FY05‐07, YBL hasn’t reported any slippages, however in FY08, it reported its first GNPAs of 0.1% and currently it stood at 0.21%. Restructured assets as a % of gross advances improves from 0.36% in Q4’10 to 0.24% in Q4’11. Exposure to troublesome MFI sector stood at INR 4500 Mn which is less than 1.5% of the total loan book. Also, YBL does not have any exposure to the new 2G players. F h we d ’ see any i h l Further, don’t impact of RBI’ recently revised norms f RBI’s l i d for provisioning. However, higher provisioning for restructured assets may dent FY12 expected PBT by 0.08% to 0.11% (Microsec Internal calculation). However with increasing focus on SME & retail segment we may see a spurt in slippages going forward. Secondly, it will be hard for the bank to improve upon its GNPA % NNPA% further in this increasing rate scenario. Nevertheless it is noteworthy to mention, that even after factoring in an increase in NPAs it still remains low as compared to its peer group. YBL’s provision coverage ratio stood at health 88 6% as on March’11 healthy 88.6% March 11. 0.9 Credit Cost% 2500 Strong asset quality 80% 0.8 70% 0.7 2000 60% 0.6 1500 50% 0.5 40% 0.4 1000 30% 0.3 0.2 20% 500 0.1 10% 0 0 0% FY09 FY10 FY11 FY12E FY13E FY09 FY10 FY11 FY12E FY13E GNPA (Rs m) NNPA (Rs m) GNPA Ratio (RHS) NNPA Ratio (RHS) Provision Coverage Ratio Restructured assets 100.0 1700 1.2 90.0 1500 1 80.0 70.0 1300 0.8 60.0 50.0 1100 0.6 40.0 900 0.4 30.0 20.0 700 0.2 10.0 10 0 0.0 500 0 FY09 FY10 FY11 FY12E FY13E Q2'10 Q3'10 Q4'10 Q1'11 Q2'11 Q3'11 Q4'11 Total Restructured Assets (INR Mn) % Gross Advances (RHS) 18 Source: Company, Microsec Research 20th June’2011 Microsec Research
  • 20. Capital issuance critical for growth YES bank has adopted a capital raising in every 1.5-2 years of operation from FY08. Currently YES bank is adequately capitalized with Capital Adequacy Ratio (CAR) stood at 16.7% at the end of March’11. Bank has raised capital of INR 3386 Mn by issuing shares to QIBs at INR 269.5 per share in Jan’10 diluting 13% stake. Further management is expected to raise funds to the tune of USD500 Mn (INR 22500 Mn) through an American Depository receipt by the end of FY12. However due to the subdued ) g p y p y domestic & overseas capital market, the bank may defer its plan till H1’FY13. This gives the bank enough issuance window to raise capital at a reasonable price. However, We have not factored in the capital raising plan by the bank in our estimates for FY12 & FY13. Capital raising once in every two years from FY08 In Mn Adequate capital for sustainable growth 40000 25 35000 20 30000 25000 15 20000 15000 10 10000 5 5000 0 0 FY06 FY07 FY08 FY09 FY10 FY11 FY09 FY10 FY11 FY12E FY13E Networth Capital Raised CAR (%) Tier 1 (%) Source: Company, Microsec Research 19 20th June’2011 Microsec Research
  • 21. Strong RoE(Cal) despite regular capital raising. RoAs may come down under pressure due to increase in cost/assets & Loan loss provisions (LLPs) 25.00% 1.70% 20.00% 1.60% 15.00% 1.50% 10.00% 1.40% 5.00% 0.00% 1.30% FY09 FY10 FY11 FY12E FY13E RoE% RoA% (RHS) RoA Decomposition FY09 FY10 FY11 FY12E FY13E Yield on Assets 10.04% 7.99% 8.47% 8.97% 9.00% Less: Cost of Assets 7.48% 5.34% 5.86% 6.43% 6.39% Net Interest Income 2.55% 2.66% 2.61% 2.53% 2.61% Other Income 2.19% 1.94% 1.31% 1.30% 1.39% Less: Operating Exp 2.10% 2 10% 1.69% 1 69% 1.43% 1 43% 1.46% 1 46% 1.59% 1 59% Less: Provisions 0.31% 0.46% 0.21% 0.20% 0.25% Less: Tax 0.81% 0.84% 0.77% 0.74% 0.73% RoA 1.52% 1.61% 1.52% 1.44% 1.43% Source: Company, Microsec Research 20 20th June’2011 Microsec Research
  • 22. Peer Analysis Particulars (In Mn) Yes Bank ICICI Bank HDFC Bank Axis Bank ING Vysya Bank Indusind Bank Net Interest Income* 12469.20 90169.00 105431.30 65629.90 10065.20 13764.90 CAGR Growth (5 yrs) (%) 64.25 7.97 29.84 43.15 16.73 50.07 PAT* 7271.30 51513.80 39263.90 33884.90 3186.50 5773.20 CAGR Growth (5 yrs) (%) 66.61 66 61 13.44 13 44 36.18 36 18 50.58 50 58 37.59 37 59 70.56 70 56 EPS* 20.95 44.72 84.40 82.54 26.34 12.39 BVS** 109.30 451 541 441.00 208.3 80.08 Deposits (in bn)** 459.39 2256.02 2085.86 1892.38 301.94 343.65 Advances (in bn)** 343.64 2163.66 1599.83 1424.08 236.02 261.66 No of Branches** 214 2529 1825 1390 500 245 Mkt Cap (in bn) 104.5 1251.09 1112.62 526.40 41.10 123.01 Key Ratios CASA%* 10.34 45 52.7 41.1 34.6 27.2 SA%* 1.8 29.6 30.4 21.6 17.7 8.9 NIM (%)* 2.8 2.6 4.2 3.7 2.85 3.5 GNPA (%)** 0.23 4.47 1.05 1.01 2.30 1.01 NNPA (%)** 0.03 1.11 0.20 0.26 0.39 0.28 Restructured Assets % 0.2 1.2 0.3 1.4 0.3 0.3 ( ) PCR(%)* 88.6 76 83 81 83.4 72.6 CAR (%)* 16.5 19.54 16.2 12.65 12.94 15.89 Mkt Cap / Branch (in bn) 0.49 0.49 0.61 0.38 0.08 0.50 Div Yield (%) * 0.84 1.29 0.69 1.10 0.87 0.76 ROA (%)* 1.5 1.3 1.6 1.6 1.0 1.3 ROE (%)* 21.0 11.0 17.0 19.0 12.0 14.6 Valuations Price 298 1085 2389 1275 345.3 345 3 264 P/E 14.23 24.26 28.31 15.45 13.11 21.31 P/BV 2.73 2.41 4.42 2.89 1.66 3.30 P/E (5 YR Avg) 22.90 23.90 29.48 21.34 15.98 23.72 P/BV (5 YR Avg) 3.55 2.48 4.93 3.33 1.81 2.36 Prem/(Disc) on P/E (8.67) 0.36 (1.17) (5.89) (2.87) (2.41) Prem/(Disc) on P/BV (0.82) (0.07) (0.51) (0.44) (0.15) 0.94 Return summary 1M 3M 6M 12M Axis Bank Ltd. -0.58% 4.47% -6.53% 2.87% HDFC Bank Ltd. 4.18% 16.52% 4.33% 24.74% ICICI Bank Ltd. -2.54% 11.84% -5.04% 25.99% IndusInd Bank Ltd. 1.52% 20.25% -9.36% 28.78% ING Vysya Bank Ltd. Ltd -2.01% -2 01% 11.98% 11 98% -17.13% -17 13% -6.06% -6 06% Yes Bank Ltd. -1.56% 17.12% -1.86% 11.59% * As on Mar’11, ** TTM, Prices as on 1st June’11 Source: Company, ACE Equity Microsec Research 21 20th June’2011 Microsec Research