Report - Luxury Fashion: 3 Social Media Campaigns in September
•
3 gefällt mir•1,293 views

Industry and campaign analysis of content trends and strategic practices across Facebook, Twitter and Instagram for 9 luxury fashion brands. The brands analyzed are Burberry, Louis Vuitton, Chanel, Dior, Versace, Gucci, Armani, Dolce & Gabbana and Calvin Klein.

Empfohlen
Empfohlen
Weitere ähnliche Inhalte
Ähnlich wie Report - Luxury Fashion: 3 Social Media Campaigns in September
Ähnlich wie Report - Luxury Fashion: 3 Social Media Campaigns in September (20)
Mehr von Zuum
Mehr von Zuum (20)
Kürzlich hochgeladen
Kürzlich hochgeladen (20)
Report - Luxury Fashion: 3 Social Media Campaigns in September
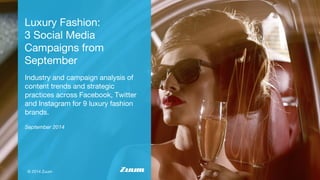
- 1. Luxury Fashion: 3 Social Media Campaigns from September Industry and campaign analysis of content trends and strategic practices across Facebook, Twitter and Instagram for 9 luxury fashion brands. © 2014 Zuum September 2014
- 2. About This Report Luxury fashion brands play well with social media. With social media becoming more and more visually-driven, it’s put this category in an even better position to maximize impact with highly graphic content. This report takes a look at 3 of the more prominent campaigns that ran during the month of September, 2014. The brands analyzed are Burberry, Louis Vuitton, Chanel, Dior, Versace, Gucci, Armani, Dolce & Gabbana and Calvin Klein. Key Takeaways: ❖ Numerous campaign themes evident within a single month ❖ Industry is trying a range of messaging tactics: branded content, product launches, event coverage, publicity ❖ Network performance varies greatly, with Facebook offering reach, and Instagram high engagement levels Reporting Dates: Sep 1 - Sep 30 2014, unless stated otherwise. Engagement Rate Formula: Sum of all engagements generated from a post divided by the fan count on the day of the post. If multiple posts are involved, then divide by the number of posts.
- 3. Numerous campaigns, many with strong engagement rates Chart: Global Subject Explorer Terms appearing in the text of all brand posts on Facebook, Twitter and Instagram for entire industry. Set for a minimum of 5 posts. 1: Product line campaigns 2: Brand content promotion 3: Event coverage 4: New product launches 5: Press and publicity themes
- 4. Industry content overview: General posting behaviors Chart: Global Content Analyzer Content overview for entire industry. 1: The average engagement rate per post for all brands (engagements / fan count) was of .51% 2: While Twitter leads in posting volume, it generates very low engagement levels. 3: There’s an interesting surge in posting volume around mid- month - 4: - but not a synchronous rise in engagement levels.
- 6. #versacecelebrities campaign analysis Chart: Global Campaign Analysis Content overview for Versace’s #versacecelebrities campaign. 1: High engagement rate overall. More than double the industry average. Instagram is generating very high engagement levels. 2: The high posting volume on Instagram leverages the network’s high engagement rates, generating large engagement levels. 3: This appears to be an ongoing campaign, with a strong posting volume throughout the month.
- 7. #versacecelebrities campaign top posts Chart: Top Posts A ranking of the most engaging posts for the campaign theme selected. A post from each network, Facebook, Twitter and Instagram, made the top 3. 1: Celebrities, a proven quantity in terms of engagement, make an excellent campaign theme.
- 9. Chart: Global Campaign Analysis Content overview for Dior’s #diorjadore campaign. Expanded view to Aug 15 - Sep 30 to capture entire campaign. 1: The engagement rate average is high, both overall and for Instagram. 2: Facebook demonstrates the power of a large community by driving high engagement counts despite low engagement rates relative to Instagram. 3: The campaign ran for a short period, building towards the end in both posting and engagement. Report Dates: Jul 16 - Sep 30, 2014 #diorjadore campaign analysis
- 10. Chart: Top Posts A ranking of the most engaging posts for the campaign theme selected. A post from each network, Facebook, Twitter and Instagram, made the top 3. The top 3 campaign posts ranked by engagement rate, starting with Instagram, Twitter and Facebook. #diorjadore campaign top posts
- 12. #CelebratingMonogram campaign analysis Chart: Global Campaign Analysis Content overview for Louis Vuitton’s #CelebratingMonogram campaign. 1: This campaign has elow average engagement. 2: A heavy reliance on Twitter posting likely brought down overall engagements. The brand has a high percentage of fans on Instagram, and thus should leverage the high engagement rates by posting more to that platform than Twitter. 3: The campaign posting volume fades over the course of the campaign, which likely caused a parallel drop in engagement levels.
- 13. Chart: Top Posts A ranking of the most engaging posts for the campaign theme selected. A post from each network, Facebook, Twitter and Instagram, made the top 3. 1: The top post on Twitter and Facebook were product announcement videos. After the initial launch and peak in posting volume, engagement generated by the product or campaign fades. #CelebratingMonogram campaign top posts
- 14. Chart: Global Fan Leaderboard Fan counts for each brand’s social media accounts on the last day of the reporting period, Sep 30. 1: Facebook has 69% of the overall community size. Where the social media fans are
- 15. Chart: Global Engagement Leaderboard Total of engagements generated by each brand’s content, per network. 1: Instagram shows its engagement power, despite the low average fan counts. Where engagement happens
- 16. © 2014 Zuum Be notified when reports like this are available from Zuum: get.zuumsocial.com/socialintelligence/ Subscribe For more information about Zuum’s capabilities and pricing, please contact sales@zuumsocial.com ZuumSocial.com