Not All Loyal Consumers Are Profitable
•
0 gefällt mir•355 views

Not all loyal consumers are equally profitable. While loyal consumers purchase more frequently and spread positive word of mouth, light consumers who are highly loyal to a single brand may not be as profitable as heavier spending consumers with less brand loyalty. Loyalty, defined as percentage of category spending on a brand, is best measured using household panel data that tracks consumer purchasing patterns over time. Such data from Pakistan is available from Foresight Research and can help brands identify truly profitable loyal consumers and determine if competition is gaining among their customer base. Maintaining high levels of loyal, heavy spending consumers appears to be key for brands to achieve strong, sustainable growth.

Empfohlen
Empfohlen
Weitere ähnliche Inhalte
Ähnlich wie Not All Loyal Consumers Are Profitable
Ähnlich wie Not All Loyal Consumers Are Profitable (20)
Kürzlich hochgeladen
Kürzlich hochgeladen (20)
Not All Loyal Consumers Are Profitable
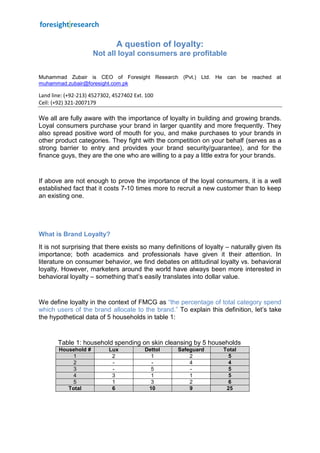
- 1. A question of loyalty: Not all loyal consumers are profitable Muhammad Zubair is CEO of Foresight Research (Pvt.) Ltd. He can be reached at muhammad.zubair@foresight.com.pk Land line: (+92-213) 4527302, 4527402 Ext. 100 Cell: (+92) 321-2007179 We all are fully aware with the importance of loyalty in building and growing brands. Loyal consumers purchase your brand in larger quantity and more frequently. They also spread positive word of mouth for you, and make purchases to your brands in other product categories. They fight with the competition on your behalf (serves as a strong barrier to entry and provides your brand security/guarantee), and for the finance guys, they are the one who are willing to a pay a little extra for your brands. If above are not enough to prove the importance of the loyal consumers, it is a well established fact that it costs 7-10 times more to recruit a new customer than to keep an existing one. What is Brand Loyalty? It is not surprising that there exists so many definitions of loyalty – naturally given its importance; both academics and professionals have given it their attention. In literature on consumer behavior, we find debates on attitudinal loyalty vs. behavioral loyalty. However, marketers around the world have always been more interested in behavioral loyalty – something that’s easily translates into dollar value. We define loyalty in the context of FMCG as “the percentage of total category spend which users of the brand allocate to the brand.” To explain this definition, let’s take the hypothetical data of 5 households in table 1: Table 1: household spending on skin cleansing by 5 households Household # Lux Dettol Safeguard Total 1 2 1 2 5 2 - - 4 4 3 - 5 - 5 4 3 1 1 5 5 1 3 2 6 Total 6 10 9 25
- 2. So, household 1 spends total of 5 rupees on the category and she distributes them between 3 brands (Lux: 2 rupees, Dettol: 1 rupee and Safeguard: 2 rupees). While household 3 also spends 5 rupees on the category but spend it all on Dettol – this difference is the basis of loyalty, i.e. how consumers allocate their spending on different brands. So, loyalty for Lux is: total spending on Lux * 100 total category spending by Lux users = 6 * 100 = 37.5%, 16 (To arrive at total category spending by Lux users, add the total category consumption by Lux users, i.e. total consumption of households’ number 1,4 & 5: 5+5+6 = 16). Similarly loyalty for Dettol is: 47.6% and for Safeguard it remained 45%. So, Dettol users were more loyal to it than both of Lux and Safeguard. Globally this is called SOR (share of requirement). This looks into the household purchase pattern to analyze if the household is using a single brand or multiple brands at a time. Typically, consumers start with a trial purchase of the brand and, after satisfaction, tend to form habits and continue purchasing the same brand because the product is safe and familiar. Loyalty is not repeat purchase Quite often marketers take repeat purchase as a synonym of loyalty. While all loyal consumers are repeat purchasers, reverse is not true. Let’s take an example from detergents category. A consumer could be buying a sachet of Ariel every month – so she is a repeat purchaser of the brand. However, she uses it only for washing her expensive clothes, while for her regular laundry she uses Bonus. So, every month she spends about 10 rupees on Ariel while about 60 rupees on Bonus. Which brand is she loyal to? Definitely not to Ariel!
- 3. Is loyalty (SOR) data for FMCG products available in Pakistan? Foresight Research (Pvt.) Ltd. runs the only household panel in Pakistan. The panel currently covers about 25 FMCG categories on the National Pakistan basis, i.e. both urban and rural Pakistan are covered. It provides facts on household behavior like penetration, loyalty, source of gain/loss, retained/lapsed users, etc. Loyalty for all brands/ skus/ variants is available with Foresight for the 25 product categories. How loyalty (SOR) explains brand strength? We looked at household panel data and compared the loyalty distribution of 3 detergents brand: Surf Excel, Ariel and Brite. The splits were 0-50, 51+%, where 0- 50 shows the percentage of buyers who allocate 0-50% of their category spending on the analyzed product. These groups were labeled as; non-loyal and loyal buyers, respectively. Volume share of these brands as per Foresight household panel, are shown in chart A below. Chart A: Volume share trend: Foresight Household Panel 40.0 35.0 33.8 30.0 25.0 Surf Excel 20.0 Ariel 17.5 15.0 Brite 10.0 9.1 8.2 5.6 5.0 5.7 6.1 5.0 4.8 1.9 2.9 2.7 0.0 Oct 03 Oct 05 Oct 07 Oct 09 Over the period of 6 years, Surf Excel has increased its volume share 4 times (33.8% up from 8.2% in October 2003), Brite has also increased its volume share while Ariel had declined. (Market definition also includes loose/ unbranded and home-kit powders). In below we analyze how loyalty has contributed in brand growth/ decline.
- 4. Table 2 below shows the distribution of brand users into loyal and non-loyal users. For example, 56% of Ariel users were loyal to it in October 2003, while only 43% remained loyal to the brand in the October 2009. Table 2: Distribution of users into Loyal/ Non-loyal consumers Ariel Brite SXL Penetration % Oct 03 Oct 09 Oct 03 Oct 09 Oct 03 Oct 09 Monthly penetration - % 14 7 13 17 19 52 % of: Loyal 56 43 39 31 63 60 Non-Loyal 44 57 61 69 37 40 Table 3 shows the volume contribution to the brand from loyal and non-loyal consumers. In October 2003, loyal consumers account for 75% of Ariel volume, which shrunk to 65% in October 2009. Table 3: Volume contribution from Loyal/ Non-loyal consumers Ariel Brite SXL Penetration % Oct 03 Oct 09 Oct 03 Oct 09 Oct 03 Oct 09 % of brand volume from: Loyal 75 65 26 61 81 80 Non-Loyal 25 35 74 39 19 20 Comparing tables 2 and 3, we can very easily comprehend the factors behind Surf Excel phenomenal growth: while it increased its user base (from 19% to 52%: table 2), it maintained the proportion of loyal users in its repertoire and 4/5th of its volume continues to come from such consumers. Brite’s volume share had also increased - brand is increasingly dependent on its loyal consumers (contribution of loyal users gas increased to 61% from 26%). In case of Ariel, both the proportion of loyal users and their contribution in Arial volume have declined – resulting in the share loss for the brand.
- 5. Is there a competition brand becoming a potential threat – SOR Matrix? Few consumers use a single brand – even loyal consumers do flirt with other brands occasionally. So, it is important to monitor what other products fill your consumer shopping basket. This is also important, as loyalty for your brand may remain the same over the period of time, a competition brand may become stronger in your households. For instance, we produce Foresight Household Panel data for skin cleansing category for the period of Q2’ 04 till Q2’ 05 in table 4 below. Reading table 4: in quarter II ‘04, share of various brands in Lifebuoy households were: Lifebuoy 45%, Lux 18%, Safeguard 6% share, etc. Table 4: SOR matrix Lifebuoy (share of other brands in Lifebuoy-user households) Qtr II 04 Qtr III 04 Qtr IV 04 Qtr I 05 Qtr II 05 Lifebuoy SOR - % 45 44 45 44 45 Share of other brands in Lifebuoy users households - % Lux 18 17 18 18 15 Safeguard 6 8 10 11 15 Capri 3 3 3 3 3 Palmolive 2 3 2 2 2 Tibet 5 5 4 5 7 Dettol 1 2 2 3 4 SOR matrix above rings the early alarm for Lifebuoy: while its loyalty remained un- changed, Safeguard is becoming very active among its users, at the moment it is eating up other brands from the Lifebuoy repertoire – however, if the trend continues it will start challenging Lifebuoy in its own households. This is what exactly happened in later years. So, this kind of analysis actually warns you if you are heading to a disaster.
- 6. Does all loyal consumers equally important? Not necessarily all loyal consumers are important. There is a direct relationship between heaviness of spend and number of brands purchased, i.e. heavy users of the category will buy more number of brands than light users of the category. So, a light category buyer is more likely to be the loyal user of the brand, but not necessarily as profitable to the company as a heavy category buyer with relatively lower loyalty towards brand. So, while designing strategies to reward your loyal users – think to reward only profitable loyal consumers. Conclusion Loyalty is how much you spend on the brand vis-à-vis total category; it is definitely not the repeat purchase only. For FMCG categories, it is usually measured via SOR which is derived from household panel data – this data is available in Pakistan from Foresight Research (Pvt.) Ltd.