Introduction to Neural networks (under graduate course) Lecture 9 of 9
OpenCV Q-Learning Rover State Reduction
1. Utilizing OpenCV for Q-Learning State Space Reduction in
Re-Purposed Off-The-Shelf FPV Rovers
Dr. Elan Barenholtz, William Hahn, Shawn Martin, Paul Morris,
Nick Tutuianu, Marcus McGuire, Washington Garcia
Machine Perception and Cognitive Robotics Laboratory
Center for Complex Systems and Brain Sciences
Introduction
• In our lab, we have been using Brookstone’s
Rover 2.0 Spy Tank to conduct our experiments,
which can be purchased off the shelf for $99.
Five years ago, a rover of similar grade wouldn’t
cost anything under $500, going to show that
technology like this is only now becoming more
and more relevant. With this rover and our
software, we are able to tap into all of its
functionality, but most importantly its movement
mechanics, IR sensors, and controllable
camera.
• We are using libraries such as OpenCV and Q-
Learning. Like teaching anything, Q-Learning in
its simplest form, is a process in which the rover
learns in an action-reward based system (see
Figure 3). This functionality along with the help
of OpenCV, allows the rover to look for certain
shapes or colors, and ultimately learn to look for
those shapes or colors without explicitly being
told to do so.
Method
• The rover was surrounded with a box
environment with four differently colored sides,
designed to provide a simple environment with
limited choices. A reward was given to the rover
when pink was detected in the center of the
image. The rover would make random
movements on its primary trials. Eventually, the
program would guide the rover to the color pink
having taken the least amount of steps/most
efficient route.
• The program uses functions from the library
OpenCV to mask image frames and search for
specific color ranges. From there, the Q-
Learning algorithm (see Figure 3) is
implemented that allows the program to weigh
each decision to move the rover left or right
from its current position. In a simple
explanation, it starts to work by factoring in the
decision it made the time before it received a
reward. As the simulation is run more and more
times, the program will begin to have weighted
values for more and more decisions taken from
more and more locations. This is called a Q-
table.
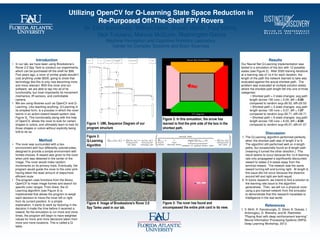
Results
Our Neural Net Q-Learning implementation was
tested in a simulation of the box with 12 possible
states (see Figure 2). After 2000 training iterations
at a learning rate of 1e-4 for each iteration, the
length of the path the network learned to take was
evaluated against the actual shortest path. The
problem was evaluated at multiple solution states
where the shortest path length fell into one of three
categories:
• Shortest path = 2 state changes: avg path
length across 100 runs = 2.00, diff = 0.00
compared to random avg=26.52, diff=22.52
• Shortest path = 4 state changes: avg path
length across 100 runs = 5.07, diff = 1.07
compared to random avg=39.71, diff=35.71
• Shortest path = 6 state changes: avg path
length across 100 runs = 6.00, diff = 0.00
compared to random avg=45.07, diff=41.07
Discussion
1. The Q-Learning algorithm performed perfectly
when the shortest path was of length 2 or 6.
The algorithm still performed well on 4-length
paths, but occasionally found an 8 length path
(meaning it turned the other direction.) This
result seems to occur because the 1e-4 learning
rate only propagated a significantly discounted
reward to states 2-4 states away from the
terminal reward. The network saw the same
reward turning left and turning right. At length 6,
this issue did not occur because the distance
around left and right are both equal.
2. In future research, we intend to find a solution to
the learning rate issue to the algorithm
generalizes. Then, we will run a physical rover
using a pre-trained network from the simulator
to demonstrate that this research translates to
intelligence in the real world.
References
1. V. Mnih, K. Kavukcuoglu, D. Silver, A. Graves, I.
Antonoglou, D. Wierstra, and M. Riedmiller.
“Playing Arari with deep reinforcement learning”.
Neural Information Processing Systems (NIPS)
Deep Learning Workshop, 2013.
Undergraduate Research Symposium, April 6, 2012
Figure 5: The rover has found and
encompassed the entire pink card in its view.
Figure 2: In this simulation, the arrow has
learned to find the pink side of the box in the
shortest path.
Figure 1: UML Sequence Diagram of our
program structure
Figure 4: Image of Brookestone’s Rover 2.0
Spy Tanks used in our lab.
Figure 3:
Q-Learning
Algorithm