SlideShare ist ein Scribd-Unternehmen logo
1 von 25
googleVisExamples
Prepared: VOLKAN OBAN
Reference:https://cran.r-project.org/web/packages/googleVis/vignettes/googleVis_examples.html
GoogleVis:
The googleVis package provides an interface between R and the Google Chart Tools. The functions
of the package allow the user to visualize data stored in R
Installation:
install.packages('googleVis')
library(googleVis)
Bring Your Data to Life with googleVis and R.
First Example
df=data.frame(country=c("US", "GB", "BR"), + val1=c(10,13,14), + val2=c(23,12,32))
Line <- gvisLineChart(df)
plot(Line)
2.Example:
Bar <- gvisBarChart(df)
plot(Bar)
3.Example:
Area <- gvisAreaChart(df)
plot(Area)
4.Example:
SteppedArea <- gvisSteppedAreaChart(df, xvar="country", yvar=c("val1",
"val2"), options=list(isStacked=TRUE))
plot(SteppedArea)
5.Example:
Bubble <- gvisBubbleChart(Fruits, idvar="Fruit", xvar="Sales",
yvar="Expenses", colorvar="Year", sizevar="Profit", options=list(
hAxis='{minValue:75, maxValue:125}'))
plot(Bubble)
6.Example:
M <- matrix(nrow=6,ncol=6) M[col(M)==row(M)] <- 1:6 dat <- data.frame(X=1:6, M)
SC <- gvisScatterChart(dat, options=list( title="Customizing points", legend="right",
pointSize=30, series="{ 0: { pointShape: 'circle' }, 1: { pointShape: 'triangle' }, 2: {
pointShape: 'square' }, 3: { pointShape: 'diamond' }, 4: { pointShape: 'star' }, 5: {
pointShape: 'polygon' } }"))
plot(SC)
7.Example:
Candle <- gvisCandlestickChart(OpenClose, options=list(legend='none'))
plot(Candle)
8.Example:
Gauge <- gvisGauge(CityPopularity, options=list(min=0, max=800, greenFrom=500,
greenTo=800, yellowFrom=300, yellowTo=500, redFrom=0, redTo=300, width=400,
height=300))
plot(Gauge)
9.Example:
Intensity <- gvisIntensityMap(df)
plot(Intensity)
10.Example:
Geo=gvisGeoChart(Exports, locationvar="Country", colorvar="Profit",
options=list(projection="kavrayskiy-vii"))
plot(Geo)
11.Example:
require(datasets)
states <- data.frame(state.name, state.x77)
GeoStates <- gvisGeoChart(states, "state.name", "Illiteracy", options=list(region="US", displayMode="regions", resolution="provinces",
width=600, height=400))
plot(GeoStates)
12.Example:
GeoMarker <- gvisGeoChart(Andrew, "LatLong", sizevar='Speed_kt',
colorvar="Pressure_mb", options=list(region="US"))
plot(GeoMarker)
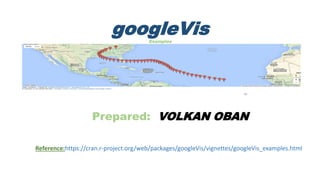
13.Example:
AndrewMap <- gvisMap(Andrew, "LatLong" , "Tip",
options=list(showTip=TRUE, showLine=TRUE, enableScrollWheel=TRUE,
mapType='terrain', useMapTypeControl=TRUE)
plot(AndrewMap)
14.Example:
PopTable <- gvisTable(Population, formats=list(Population="#,###", '% of World
Population'='#.#%'), options=list(page='enable'))
plot(PopTable)
15.Example:
Org <- gvisOrgChart(Regions, options=list(width=600, height=250, size='large',
allowCollapse=TRUE))
plot(Org)
16.Example:
Anno <- gvisAnnotationChart(Stock, datevar="Date", numvar="Value",
idvar="Device", titlevar="Title", annotationvar="Annotation", options=list(
width=600, height=350, fill=10, displayExactValues=TRUE,
colors="['#0000ff','#00ff00']")
plot(Anno)
17.Example:
datSK <- data.frame(From=c(rep("A",3), rep("B", 3)), To=c(rep(c("X", "Y", "Z"),2)),
Weight=c(5,7,6,2,9,4))
Sankey <- gvisSankey(datSK, from="From", to="To", weight="Weight", options=list( sankey="{link:
{color: { fill: '#d799ae' } }, node: { color: { fill: '#a61d4c' }, label: { color: '#871b47' } }}"))
plot(Sankey)
18.Example:
Cal <- gvisCalendar(Cairo, datevar="Date", numvar="Temp", options=list( title="Daily temperature in
Cairo", height=320, calendar="{yearLabel: { fontName: 'Times-Roman', fontSize: 32, color:
'#1A8763', bold: true}, cellSize: 10, cellColor: { stroke: 'red', strokeOpacity: 0.2 }, focusedCellColor:
{stroke:'red'}}") )
plot(Cal)
19.Example:
datTL <- data.frame(Position=c(rep("President", 3), rep("Vice", 3)), Name=c("Washington", "Adams",
"Jefferson", "Adams", "Jefferson", "Burr"), start=as.Date(x=rep(c("1789-03-29", "1797-02-03", "1801-02-
03"),2)), end=as.Date(x=rep(c("1797-02-03", "1801-02-03", "1809-02-03"),2)))
Timeline <- gvisTimeline(data=datTL, rowlabel="Name", barlabel="Position", start="start", end="end",
options=list(timeline="{groupByRowLabel:false}", backgroundColor='#ffd', height=350, colors="['#cbb69d',
'#603913', '#c69c6e']"))
plot(Timeline)
20.Example:
G <- gvisGeoChart(Exports, "Country", "Profit", options=list(width=300, height=300))
T <- gvisTable(Exports, options=list(width=220, height=300))
GT <- gvisMerge(G,T, horizontal=TRUE)
plot(GT)
21.Example:
Motion=gvisMotionChart(Fruits, idvar="Fruit", timevar="Year")
plot(Motion)
22.Example:
AndrewGeo <- gvisGeoMap(Andrew, locationvar="LatLong", numvar="Speed_kt",
hovervar="Category", options=list(height=350, region="US", dataMode="markers"))
plot(AndrewGeo)
23.Example:
AnnoTimeLine <- gvisAnnotatedTimeLine(Stock, datevar="Date", numvar="Value", idvar="Device",
titlevar="Title", annotationvar="Annotation", options=list(displayAnnotations=TRUE,
width="600px", height="350px"))
plot(AnnoTimeLine)

Weitere ähnliche Inhalte

Was ist angesagt?

Cryptocurrency ecosystem(together society)
Cryptocurrency ecosystem(together society)Cryptocurrency ecosystem(together society)
Cryptocurrency ecosystem(together society)jihong yang
 
〇〇の常識は■■の非常識
〇〇の常識は■■の非常識〇〇の常識は■■の非常識
〇〇の常識は■■の非常識Yoichi Hirai
 
Having fun with graphs, a short introduction to D3.js
Having fun with graphs, a short introduction to D3.jsHaving fun with graphs, a short introduction to D3.js
Having fun with graphs, a short introduction to D3.jsMichael Hackstein
 
GeoTuple a Framework for Web Based Geo-Analytics with R and PostGIS
GeoTuple a Framework for Web Based Geo-Analytics with R and PostGISGeoTuple a Framework for Web Based Geo-Analytics with R and PostGIS
GeoTuple a Framework for Web Based Geo-Analytics with R and PostGISRoland Hansson
 
Data mining
Data miningData mining
Data miningScilab
 
Linux/Rails学習用テキスト
Linux/Rails学習用テキストLinux/Rails学習用テキスト
Linux/Rails学習用テキストpiyeosaka
 
DBDoc Database Documentor using Mind Mapping automation
DBDoc Database Documentor using Mind Mapping automationDBDoc Database Documentor using Mind Mapping automation
DBDoc Database Documentor using Mind Mapping automationJosé M. Guerrero
 
Monads in javascript
Monads in javascriptMonads in javascript
Monads in javascriptJana Karceska
 
Python built in functions
Python built in functionsPython built in functions
Python built in functionsRakshitha S
 
(ADV403) Dynamic Ad Perf. Reporting w/ Redshift: Data Science, Queries at Sca...
(ADV403) Dynamic Ad Perf. Reporting w/ Redshift: Data Science, Queries at Sca...(ADV403) Dynamic Ad Perf. Reporting w/ Redshift: Data Science, Queries at Sca...
(ADV403) Dynamic Ad Perf. Reporting w/ Redshift: Data Science, Queries at Sca...Amazon Web Services
 
Bar plots.ipynb colaboratory
Bar plots.ipynb   colaboratoryBar plots.ipynb   colaboratory
Bar plots.ipynb colaboratoryGokuldhev mony
 
Machine Learning with Python
Machine Learning with PythonMachine Learning with Python
Machine Learning with PythonAnkit Rathi
 

Was ist angesagt? (20)

Cryptocurrency ecosystem(together society)
Cryptocurrency ecosystem(together society)Cryptocurrency ecosystem(together society)
Cryptocurrency ecosystem(together society)
 
〇〇の常識は■■の非常識
〇〇の常識は■■の非常識〇〇の常識は■■の非常識
〇〇の常識は■■の非常識
 
Ssrs expressions
Ssrs expressionsSsrs expressions
Ssrs expressions
 
Having fun with graphs, a short introduction to D3.js
Having fun with graphs, a short introduction to D3.jsHaving fun with graphs, a short introduction to D3.js
Having fun with graphs, a short introduction to D3.js
 
GeoTuple a Framework for Web Based Geo-Analytics with R and PostGIS
GeoTuple a Framework for Web Based Geo-Analytics with R and PostGISGeoTuple a Framework for Web Based Geo-Analytics with R and PostGIS
GeoTuple a Framework for Web Based Geo-Analytics with R and PostGIS
 
Joclad 2010 d
Joclad 2010 dJoclad 2010 d
Joclad 2010 d
 
Data mining
Data miningData mining
Data mining
 
Linux/Rails学習用テキスト
Linux/Rails学習用テキストLinux/Rails学習用テキスト
Linux/Rails学習用テキスト
 
DBDoc Database Documentor using Mind Mapping automation
DBDoc Database Documentor using Mind Mapping automationDBDoc Database Documentor using Mind Mapping automation
DBDoc Database Documentor using Mind Mapping automation
 
D3
D3D3
D3
 
Monads in javascript
Monads in javascriptMonads in javascript
Monads in javascript
 
Python built in functions
Python built in functionsPython built in functions
Python built in functions
 
(ADV403) Dynamic Ad Perf. Reporting w/ Redshift: Data Science, Queries at Sca...
(ADV403) Dynamic Ad Perf. Reporting w/ Redshift: Data Science, Queries at Sca...(ADV403) Dynamic Ad Perf. Reporting w/ Redshift: Data Science, Queries at Sca...
(ADV403) Dynamic Ad Perf. Reporting w/ Redshift: Data Science, Queries at Sca...
 
Ggplot
GgplotGgplot
Ggplot
 
Bar plots.ipynb colaboratory
Bar plots.ipynb   colaboratoryBar plots.ipynb   colaboratory
Bar plots.ipynb colaboratory
 
Canvas & Charts
Canvas & ChartsCanvas & Charts
Canvas & Charts
 
GPREC DBMS Notes 1
GPREC DBMS Notes 1GPREC DBMS Notes 1
GPREC DBMS Notes 1
 
Machine Learning with Python
Machine Learning with PythonMachine Learning with Python
Machine Learning with Python
 
Funções 5
Funções  5Funções  5
Funções 5
 
d3 is cool
d3 is coold3 is cool
d3 is cool
 

Ähnlich wie Googlevis examples

Move your data (Hans Rosling style) with googleVis + 1 line of R code
Move your data (Hans Rosling style) with googleVis + 1 line of R codeMove your data (Hans Rosling style) with googleVis + 1 line of R code
Move your data (Hans Rosling style) with googleVis + 1 line of R codeJeffrey Breen
 
ggtimeseries-->ggplot2 extensions
ggtimeseries-->ggplot2 extensions ggtimeseries-->ggplot2 extensions
ggtimeseries-->ggplot2 extensions Dr. Volkan OBAN
 
mobl - model-driven engineering lecture
mobl - model-driven engineering lecturemobl - model-driven engineering lecture
mobl - model-driven engineering lecturezefhemel
 
mobl presentation @ IHomer
mobl presentation @ IHomermobl presentation @ IHomer
mobl presentation @ IHomerzefhemel
 
Extending Gremlin with Foundational Steps
Extending Gremlin with Foundational StepsExtending Gremlin with Foundational Steps
Extending Gremlin with Foundational StepsStephen Mallette
 
The Web map stack on Django
The Web map stack on DjangoThe Web map stack on Django
The Web map stack on DjangoPaul Smith
 
Introduction to d3js (and SVG)
Introduction to d3js (and SVG)Introduction to d3js (and SVG)
Introduction to d3js (and SVG)zahid-mian
 
Big Data Analytics with Scala at SCALA.IO 2013
Big Data Analytics with Scala at SCALA.IO 2013Big Data Analytics with Scala at SCALA.IO 2013
Big Data Analytics with Scala at SCALA.IO 2013Samir Bessalah
 
5 R Tutorial Data Visualization
5 R Tutorial Data Visualization5 R Tutorial Data Visualization
5 R Tutorial Data VisualizationSakthi Dasans
 
Some R Examples[R table and Graphics] -Advanced Data Visualization in R (Some...
Some R Examples[R table and Graphics] -Advanced Data Visualization in R (Some...Some R Examples[R table and Graphics] -Advanced Data Visualization in R (Some...
Some R Examples[R table and Graphics] -Advanced Data Visualization in R (Some...Dr. Volkan OBAN
 
Google Chart Tools Kanika Garg (10BM60035) Lavanya R. (10BM60042)
Google Chart Tools Kanika Garg (10BM60035) Lavanya R. (10BM60042)Google Chart Tools Kanika Garg (10BM60035) Lavanya R. (10BM60042)
Google Chart Tools Kanika Garg (10BM60035) Lavanya R. (10BM60042)Kanika Garg
 
Hadoop本 輪読会 1章〜2章
Hadoop本 輪読会 1章〜2章Hadoop本 輪読会 1章〜2章
Hadoop本 輪読会 1章〜2章moai kids
 
Data Science Academy Student Demo day--Peggy sobolewski,analyzing transporati...
Data Science Academy Student Demo day--Peggy sobolewski,analyzing transporati...Data Science Academy Student Demo day--Peggy sobolewski,analyzing transporati...
Data Science Academy Student Demo day--Peggy sobolewski,analyzing transporati...Vivian S. Zhang
 
Wprowadzenie do technologi Big Data i Apache Hadoop
Wprowadzenie do technologi Big Data i Apache HadoopWprowadzenie do technologi Big Data i Apache Hadoop
Wprowadzenie do technologi Big Data i Apache HadoopSages
 
Responsive Maps in WordPress
Responsive Maps in WordPressResponsive Maps in WordPress
Responsive Maps in WordPressAlicia Duffy
 

Ähnlich wie Googlevis examples (20)

Move your data (Hans Rosling style) with googleVis + 1 line of R code
Move your data (Hans Rosling style) with googleVis + 1 line of R codeMove your data (Hans Rosling style) with googleVis + 1 line of R code
Move your data (Hans Rosling style) with googleVis + 1 line of R code
 
ggtimeseries-->ggplot2 extensions
ggtimeseries-->ggplot2 extensions ggtimeseries-->ggplot2 extensions
ggtimeseries-->ggplot2 extensions
 
JQuery Flot
JQuery FlotJQuery Flot
JQuery Flot
 
mobl - model-driven engineering lecture
mobl - model-driven engineering lecturemobl - model-driven engineering lecture
mobl - model-driven engineering lecture
 
mobl presentation @ IHomer
mobl presentation @ IHomermobl presentation @ IHomer
mobl presentation @ IHomer
 
Extending Gremlin with Foundational Steps
Extending Gremlin with Foundational StepsExtending Gremlin with Foundational Steps
Extending Gremlin with Foundational Steps
 
The Web map stack on Django
The Web map stack on DjangoThe Web map stack on Django
The Web map stack on Django
 
Introduction to d3js (and SVG)
Introduction to d3js (and SVG)Introduction to d3js (and SVG)
Introduction to d3js (and SVG)
 
Big Data Analytics with Scala at SCALA.IO 2013
Big Data Analytics with Scala at SCALA.IO 2013Big Data Analytics with Scala at SCALA.IO 2013
Big Data Analytics with Scala at SCALA.IO 2013
 
Supstat nyc subway
Supstat nyc subwaySupstat nyc subway
Supstat nyc subway
 
Introduction to R
Introduction to RIntroduction to R
Introduction to R
 
5 R Tutorial Data Visualization
5 R Tutorial Data Visualization5 R Tutorial Data Visualization
5 R Tutorial Data Visualization
 
mobl
moblmobl
mobl
 
Some R Examples[R table and Graphics] -Advanced Data Visualization in R (Some...
Some R Examples[R table and Graphics] -Advanced Data Visualization in R (Some...Some R Examples[R table and Graphics] -Advanced Data Visualization in R (Some...
Some R Examples[R table and Graphics] -Advanced Data Visualization in R (Some...
 
Foliumcheatsheet
FoliumcheatsheetFoliumcheatsheet
Foliumcheatsheet
 
Google Chart Tools Kanika Garg (10BM60035) Lavanya R. (10BM60042)
Google Chart Tools Kanika Garg (10BM60035) Lavanya R. (10BM60042)Google Chart Tools Kanika Garg (10BM60035) Lavanya R. (10BM60042)
Google Chart Tools Kanika Garg (10BM60035) Lavanya R. (10BM60042)
 
Hadoop本 輪読会 1章〜2章
Hadoop本 輪読会 1章〜2章Hadoop本 輪読会 1章〜2章
Hadoop本 輪読会 1章〜2章
 
Data Science Academy Student Demo day--Peggy sobolewski,analyzing transporati...
Data Science Academy Student Demo day--Peggy sobolewski,analyzing transporati...Data Science Academy Student Demo day--Peggy sobolewski,analyzing transporati...
Data Science Academy Student Demo day--Peggy sobolewski,analyzing transporati...
 
Wprowadzenie do technologi Big Data i Apache Hadoop
Wprowadzenie do technologi Big Data i Apache HadoopWprowadzenie do technologi Big Data i Apache Hadoop
Wprowadzenie do technologi Big Data i Apache Hadoop
 
Responsive Maps in WordPress
Responsive Maps in WordPressResponsive Maps in WordPress
Responsive Maps in WordPress
 

Mehr von Dr. Volkan OBAN

Conference Paper:IMAGE PROCESSING AND OBJECT DETECTION APPLICATION: INSURANCE...
Conference Paper:IMAGE PROCESSING AND OBJECT DETECTION APPLICATION: INSURANCE...Conference Paper:IMAGE PROCESSING AND OBJECT DETECTION APPLICATION: INSURANCE...
Conference Paper:IMAGE PROCESSING AND OBJECT DETECTION APPLICATION: INSURANCE...Dr. Volkan OBAN
 
Covid19py Python Package - Example
Covid19py  Python Package - ExampleCovid19py  Python Package - Example
Covid19py Python Package - ExampleDr. Volkan OBAN
 
Object detection with Python
Object detection with Python Object detection with Python
Object detection with Python Dr. Volkan OBAN
 
Python - Rastgele Orman(Random Forest) Parametreleri
Python - Rastgele Orman(Random Forest) ParametreleriPython - Rastgele Orman(Random Forest) Parametreleri
Python - Rastgele Orman(Random Forest) ParametreleriDr. Volkan OBAN
 
Linear Programming wi̇th R - Examples
Linear Programming wi̇th R - ExamplesLinear Programming wi̇th R - Examples
Linear Programming wi̇th R - ExamplesDr. Volkan OBAN
 
"optrees" package in R and examples.(optrees:finds optimal trees in weighted ...
"optrees" package in R and examples.(optrees:finds optimal trees in weighted ..."optrees" package in R and examples.(optrees:finds optimal trees in weighted ...
"optrees" package in R and examples.(optrees:finds optimal trees in weighted ...Dr. Volkan OBAN
 
k-means Clustering in Python
k-means Clustering in Pythonk-means Clustering in Python
k-means Clustering in PythonDr. Volkan OBAN
 
Naive Bayes Example using R
Naive Bayes Example using  R Naive Bayes Example using  R
Naive Bayes Example using R Dr. Volkan OBAN
 
k-means Clustering and Custergram with R
k-means Clustering and Custergram with Rk-means Clustering and Custergram with R
k-means Clustering and Custergram with RDr. Volkan OBAN
 
Data Science and its Relationship to Big Data and Data-Driven Decision Making
Data Science and its Relationship to Big Data and Data-Driven Decision MakingData Science and its Relationship to Big Data and Data-Driven Decision Making
Data Science and its Relationship to Big Data and Data-Driven Decision MakingDr. Volkan OBAN
 
Data Visualization with R.ggplot2 and its extensions examples.
Data Visualization with R.ggplot2 and its extensions examples.Data Visualization with R.ggplot2 and its extensions examples.
Data Visualization with R.ggplot2 and its extensions examples.Dr. Volkan OBAN
 
Scikit-learn Cheatsheet-Python
Scikit-learn Cheatsheet-PythonScikit-learn Cheatsheet-Python
Scikit-learn Cheatsheet-PythonDr. Volkan OBAN
 
Python Pandas for Data Science cheatsheet
Python Pandas for Data Science cheatsheet Python Pandas for Data Science cheatsheet
Python Pandas for Data Science cheatsheet Dr. Volkan OBAN
 
Pandas,scipy,numpy cheatsheet
Pandas,scipy,numpy cheatsheetPandas,scipy,numpy cheatsheet
Pandas,scipy,numpy cheatsheetDr. Volkan OBAN
 
ReporteRs package in R. forming powerpoint documents-an example
ReporteRs package in R. forming powerpoint documents-an exampleReporteRs package in R. forming powerpoint documents-an example
ReporteRs package in R. forming powerpoint documents-an exampleDr. Volkan OBAN
 
ReporteRs package in R. forming powerpoint documents-an example
ReporteRs package in R. forming powerpoint documents-an exampleReporteRs package in R. forming powerpoint documents-an example
ReporteRs package in R. forming powerpoint documents-an exampleDr. Volkan OBAN
 
R-ggplot2 package Examples
R-ggplot2 package ExamplesR-ggplot2 package Examples
R-ggplot2 package ExamplesDr. Volkan OBAN
 
R Machine Learning packages( generally used)
R Machine Learning packages( generally used)R Machine Learning packages( generally used)
R Machine Learning packages( generally used)Dr. Volkan OBAN
 

Mehr von Dr. Volkan OBAN (20)

Conference Paper:IMAGE PROCESSING AND OBJECT DETECTION APPLICATION: INSURANCE...
Conference Paper:IMAGE PROCESSING AND OBJECT DETECTION APPLICATION: INSURANCE...Conference Paper:IMAGE PROCESSING AND OBJECT DETECTION APPLICATION: INSURANCE...
Conference Paper:IMAGE PROCESSING AND OBJECT DETECTION APPLICATION: INSURANCE...
 
Covid19py Python Package - Example
Covid19py  Python Package - ExampleCovid19py  Python Package - Example
Covid19py Python Package - Example
 
Object detection with Python
Object detection with Python Object detection with Python
Object detection with Python
 
Python - Rastgele Orman(Random Forest) Parametreleri
Python - Rastgele Orman(Random Forest) ParametreleriPython - Rastgele Orman(Random Forest) Parametreleri
Python - Rastgele Orman(Random Forest) Parametreleri
 
Linear Programming wi̇th R - Examples
Linear Programming wi̇th R - ExamplesLinear Programming wi̇th R - Examples
Linear Programming wi̇th R - Examples
 
"optrees" package in R and examples.(optrees:finds optimal trees in weighted ...
"optrees" package in R and examples.(optrees:finds optimal trees in weighted ..."optrees" package in R and examples.(optrees:finds optimal trees in weighted ...
"optrees" package in R and examples.(optrees:finds optimal trees in weighted ...
 
k-means Clustering in Python
k-means Clustering in Pythonk-means Clustering in Python
k-means Clustering in Python
 
Naive Bayes Example using R
Naive Bayes Example using  R Naive Bayes Example using  R
Naive Bayes Example using R
 
R forecasting Example
R forecasting ExampleR forecasting Example
R forecasting Example
 
k-means Clustering and Custergram with R
k-means Clustering and Custergram with Rk-means Clustering and Custergram with R
k-means Clustering and Custergram with R
 
Data Science and its Relationship to Big Data and Data-Driven Decision Making
Data Science and its Relationship to Big Data and Data-Driven Decision MakingData Science and its Relationship to Big Data and Data-Driven Decision Making
Data Science and its Relationship to Big Data and Data-Driven Decision Making
 
Data Visualization with R.ggplot2 and its extensions examples.
Data Visualization with R.ggplot2 and its extensions examples.Data Visualization with R.ggplot2 and its extensions examples.
Data Visualization with R.ggplot2 and its extensions examples.
 
Scikit-learn Cheatsheet-Python
Scikit-learn Cheatsheet-PythonScikit-learn Cheatsheet-Python
Scikit-learn Cheatsheet-Python
 
Python Pandas for Data Science cheatsheet
Python Pandas for Data Science cheatsheet Python Pandas for Data Science cheatsheet
Python Pandas for Data Science cheatsheet
 
Pandas,scipy,numpy cheatsheet
Pandas,scipy,numpy cheatsheetPandas,scipy,numpy cheatsheet
Pandas,scipy,numpy cheatsheet
 
ReporteRs package in R. forming powerpoint documents-an example
ReporteRs package in R. forming powerpoint documents-an exampleReporteRs package in R. forming powerpoint documents-an example
ReporteRs package in R. forming powerpoint documents-an example
 
ReporteRs package in R. forming powerpoint documents-an example
ReporteRs package in R. forming powerpoint documents-an exampleReporteRs package in R. forming powerpoint documents-an example
ReporteRs package in R. forming powerpoint documents-an example
 
R-ggplot2 package Examples
R-ggplot2 package ExamplesR-ggplot2 package Examples
R-ggplot2 package Examples
 
R Machine Learning packages( generally used)
R Machine Learning packages( generally used)R Machine Learning packages( generally used)
R Machine Learning packages( generally used)
 
Mosaic plot in R.
Mosaic plot in R.Mosaic plot in R.
Mosaic plot in R.
 

Kürzlich hochgeladen

办理学位证纽约大学毕业证(NYU毕业证书)原版一比一
办理学位证纽约大学毕业证(NYU毕业证书)原版一比一办理学位证纽约大学毕业证(NYU毕业证书)原版一比一
办理学位证纽约大学毕业证(NYU毕业证书)原版一比一fhwihughh
 
RS 9000 Call In girls Dwarka Mor (DELHI)⇛9711147426🔝Delhi
RS 9000 Call In girls Dwarka Mor (DELHI)⇛9711147426🔝DelhiRS 9000 Call In girls Dwarka Mor (DELHI)⇛9711147426🔝Delhi
RS 9000 Call In girls Dwarka Mor (DELHI)⇛9711147426🔝Delhijennyeacort
 
Building on a FAIRly Strong Foundation to Connect Academic Research to Transl...
Building on a FAIRly Strong Foundation to Connect Academic Research to Transl...Building on a FAIRly Strong Foundation to Connect Academic Research to Transl...
Building on a FAIRly Strong Foundation to Connect Academic Research to Transl...Jack DiGiovanna
 
毕业文凭制作#回国入职#diploma#degree澳洲中央昆士兰大学毕业证成绩单pdf电子版制作修改#毕业文凭制作#回国入职#diploma#degree
毕业文凭制作#回国入职#diploma#degree澳洲中央昆士兰大学毕业证成绩单pdf电子版制作修改#毕业文凭制作#回国入职#diploma#degree毕业文凭制作#回国入职#diploma#degree澳洲中央昆士兰大学毕业证成绩单pdf电子版制作修改#毕业文凭制作#回国入职#diploma#degree
毕业文凭制作#回国入职#diploma#degree澳洲中央昆士兰大学毕业证成绩单pdf电子版制作修改#毕业文凭制作#回国入职#diploma#degreeyuu sss
 
ASML's Taxonomy Adventure by Daniel Canter
ASML's Taxonomy Adventure by Daniel CanterASML's Taxonomy Adventure by Daniel Canter
ASML's Taxonomy Adventure by Daniel Cantervoginip
 
Biometric Authentication: The Evolution, Applications, Benefits and Challenge...
Biometric Authentication: The Evolution, Applications, Benefits and Challenge...Biometric Authentication: The Evolution, Applications, Benefits and Challenge...
Biometric Authentication: The Evolution, Applications, Benefits and Challenge...GQ Research
 
原版1:1定制南十字星大学毕业证(SCU毕业证)#文凭成绩单#真实留信学历认证永久存档
原版1:1定制南十字星大学毕业证(SCU毕业证)#文凭成绩单#真实留信学历认证永久存档原版1:1定制南十字星大学毕业证(SCU毕业证)#文凭成绩单#真实留信学历认证永久存档
原版1:1定制南十字星大学毕业证(SCU毕业证)#文凭成绩单#真实留信学历认证永久存档208367051
 
Heart Disease Classification Report: A Data Analysis Project
Heart Disease Classification Report: A Data Analysis ProjectHeart Disease Classification Report: A Data Analysis Project
Heart Disease Classification Report: A Data Analysis ProjectBoston Institute of Analytics
 
Predicting Salary Using Data Science: A Comprehensive Analysis.pdf
Predicting Salary Using Data Science: A Comprehensive Analysis.pdfPredicting Salary Using Data Science: A Comprehensive Analysis.pdf
Predicting Salary Using Data Science: A Comprehensive Analysis.pdfBoston Institute of Analytics
 
DBA Basics: Getting Started with Performance Tuning.pdf
DBA Basics: Getting Started with Performance Tuning.pdfDBA Basics: Getting Started with Performance Tuning.pdf
DBA Basics: Getting Started with Performance Tuning.pdfJohn Sterrett
 
Statistics, Data Analysis, and Decision Modeling, 5th edition by James R. Eva...
Statistics, Data Analysis, and Decision Modeling, 5th edition by James R. Eva...Statistics, Data Analysis, and Decision Modeling, 5th edition by James R. Eva...
Statistics, Data Analysis, and Decision Modeling, 5th edition by James R. Eva...ssuserf63bd7
 
INTERNSHIP ON PURBASHA COMPOSITE TEX LTD
INTERNSHIP ON PURBASHA COMPOSITE TEX LTDINTERNSHIP ON PURBASHA COMPOSITE TEX LTD
INTERNSHIP ON PURBASHA COMPOSITE TEX LTDRafezzaman
 
Effects of Smartphone Addiction on the Academic Performances of Grades 9 to 1...
Effects of Smartphone Addiction on the Academic Performances of Grades 9 to 1...Effects of Smartphone Addiction on the Academic Performances of Grades 9 to 1...
Effects of Smartphone Addiction on the Academic Performances of Grades 9 to 1...limedy534
 
Learn How Data Science Changes Our World
Learn How Data Science Changes Our WorldLearn How Data Science Changes Our World
Learn How Data Science Changes Our WorldEduminds Learning
 
Machine learning classification ppt.ppt
Machine learning classification  ppt.pptMachine learning classification  ppt.ppt
Machine learning classification ppt.pptamreenkhanum0307
 
Data Factory in Microsoft Fabric (MsBIP #82)
Data Factory in Microsoft Fabric (MsBIP #82)Data Factory in Microsoft Fabric (MsBIP #82)
Data Factory in Microsoft Fabric (MsBIP #82)Cathrine Wilhelmsen
 
科罗拉多大学波尔得分校毕业证学位证成绩单-可办理
科罗拉多大学波尔得分校毕业证学位证成绩单-可办理科罗拉多大学波尔得分校毕业证学位证成绩单-可办理
科罗拉多大学波尔得分校毕业证学位证成绩单-可办理e4aez8ss
 
PKS-TGC-1084-630 - Stage 1 Proposal.pptx
PKS-TGC-1084-630 - Stage 1 Proposal.pptxPKS-TGC-1084-630 - Stage 1 Proposal.pptx
PKS-TGC-1084-630 - Stage 1 Proposal.pptxPramod Kumar Srivastava
 
NO1 Certified Black Magic Specialist Expert Amil baba in Lahore Islamabad Raw...
NO1 Certified Black Magic Specialist Expert Amil baba in Lahore Islamabad Raw...NO1 Certified Black Magic Specialist Expert Amil baba in Lahore Islamabad Raw...
NO1 Certified Black Magic Specialist Expert Amil baba in Lahore Islamabad Raw...Amil Baba Dawood bangali
 

Kürzlich hochgeladen (20)

办理学位证纽约大学毕业证(NYU毕业证书)原版一比一
办理学位证纽约大学毕业证(NYU毕业证书)原版一比一办理学位证纽约大学毕业证(NYU毕业证书)原版一比一
办理学位证纽约大学毕业证(NYU毕业证书)原版一比一
 
RS 9000 Call In girls Dwarka Mor (DELHI)⇛9711147426🔝Delhi
RS 9000 Call In girls Dwarka Mor (DELHI)⇛9711147426🔝DelhiRS 9000 Call In girls Dwarka Mor (DELHI)⇛9711147426🔝Delhi
RS 9000 Call In girls Dwarka Mor (DELHI)⇛9711147426🔝Delhi
 
Building on a FAIRly Strong Foundation to Connect Academic Research to Transl...
Building on a FAIRly Strong Foundation to Connect Academic Research to Transl...Building on a FAIRly Strong Foundation to Connect Academic Research to Transl...
Building on a FAIRly Strong Foundation to Connect Academic Research to Transl...
 
毕业文凭制作#回国入职#diploma#degree澳洲中央昆士兰大学毕业证成绩单pdf电子版制作修改#毕业文凭制作#回国入职#diploma#degree
毕业文凭制作#回国入职#diploma#degree澳洲中央昆士兰大学毕业证成绩单pdf电子版制作修改#毕业文凭制作#回国入职#diploma#degree毕业文凭制作#回国入职#diploma#degree澳洲中央昆士兰大学毕业证成绩单pdf电子版制作修改#毕业文凭制作#回国入职#diploma#degree
毕业文凭制作#回国入职#diploma#degree澳洲中央昆士兰大学毕业证成绩单pdf电子版制作修改#毕业文凭制作#回国入职#diploma#degree
 
ASML's Taxonomy Adventure by Daniel Canter
ASML's Taxonomy Adventure by Daniel CanterASML's Taxonomy Adventure by Daniel Canter
ASML's Taxonomy Adventure by Daniel Canter
 
Biometric Authentication: The Evolution, Applications, Benefits and Challenge...
Biometric Authentication: The Evolution, Applications, Benefits and Challenge...Biometric Authentication: The Evolution, Applications, Benefits and Challenge...
Biometric Authentication: The Evolution, Applications, Benefits and Challenge...
 
原版1:1定制南十字星大学毕业证(SCU毕业证)#文凭成绩单#真实留信学历认证永久存档
原版1:1定制南十字星大学毕业证(SCU毕业证)#文凭成绩单#真实留信学历认证永久存档原版1:1定制南十字星大学毕业证(SCU毕业证)#文凭成绩单#真实留信学历认证永久存档
原版1:1定制南十字星大学毕业证(SCU毕业证)#文凭成绩单#真实留信学历认证永久存档
 
Heart Disease Classification Report: A Data Analysis Project
Heart Disease Classification Report: A Data Analysis ProjectHeart Disease Classification Report: A Data Analysis Project
Heart Disease Classification Report: A Data Analysis Project
 
Predicting Salary Using Data Science: A Comprehensive Analysis.pdf
Predicting Salary Using Data Science: A Comprehensive Analysis.pdfPredicting Salary Using Data Science: A Comprehensive Analysis.pdf
Predicting Salary Using Data Science: A Comprehensive Analysis.pdf
 
DBA Basics: Getting Started with Performance Tuning.pdf
DBA Basics: Getting Started with Performance Tuning.pdfDBA Basics: Getting Started with Performance Tuning.pdf
DBA Basics: Getting Started with Performance Tuning.pdf
 
Statistics, Data Analysis, and Decision Modeling, 5th edition by James R. Eva...
Statistics, Data Analysis, and Decision Modeling, 5th edition by James R. Eva...Statistics, Data Analysis, and Decision Modeling, 5th edition by James R. Eva...
Statistics, Data Analysis, and Decision Modeling, 5th edition by James R. Eva...
 
INTERNSHIP ON PURBASHA COMPOSITE TEX LTD
INTERNSHIP ON PURBASHA COMPOSITE TEX LTDINTERNSHIP ON PURBASHA COMPOSITE TEX LTD
INTERNSHIP ON PURBASHA COMPOSITE TEX LTD
 
Effects of Smartphone Addiction on the Academic Performances of Grades 9 to 1...
Effects of Smartphone Addiction on the Academic Performances of Grades 9 to 1...Effects of Smartphone Addiction on the Academic Performances of Grades 9 to 1...
Effects of Smartphone Addiction on the Academic Performances of Grades 9 to 1...
 
Learn How Data Science Changes Our World
Learn How Data Science Changes Our WorldLearn How Data Science Changes Our World
Learn How Data Science Changes Our World
 
Machine learning classification ppt.ppt
Machine learning classification  ppt.pptMachine learning classification  ppt.ppt
Machine learning classification ppt.ppt
 
Data Factory in Microsoft Fabric (MsBIP #82)
Data Factory in Microsoft Fabric (MsBIP #82)Data Factory in Microsoft Fabric (MsBIP #82)
Data Factory in Microsoft Fabric (MsBIP #82)
 
科罗拉多大学波尔得分校毕业证学位证成绩单-可办理
科罗拉多大学波尔得分校毕业证学位证成绩单-可办理科罗拉多大学波尔得分校毕业证学位证成绩单-可办理
科罗拉多大学波尔得分校毕业证学位证成绩单-可办理
 
PKS-TGC-1084-630 - Stage 1 Proposal.pptx
PKS-TGC-1084-630 - Stage 1 Proposal.pptxPKS-TGC-1084-630 - Stage 1 Proposal.pptx
PKS-TGC-1084-630 - Stage 1 Proposal.pptx
 
NO1 Certified Black Magic Specialist Expert Amil baba in Lahore Islamabad Raw...
NO1 Certified Black Magic Specialist Expert Amil baba in Lahore Islamabad Raw...NO1 Certified Black Magic Specialist Expert Amil baba in Lahore Islamabad Raw...
NO1 Certified Black Magic Specialist Expert Amil baba in Lahore Islamabad Raw...
 
Call Girls in Saket 99530🔝 56974 Escort Service
Call Girls in Saket 99530🔝 56974 Escort ServiceCall Girls in Saket 99530🔝 56974 Escort Service
Call Girls in Saket 99530🔝 56974 Escort Service
 

Googlevis examples