Experian hitwise seizing the moment in social media
Brics decade-doc
1. BRICs Monthly
Issue No: 10/03
May 20, 2010
Goldman Sachs Global Economics, Commodities and Strategy Research at https://360.gs.com
Is this the ‘BRICs Decade’?
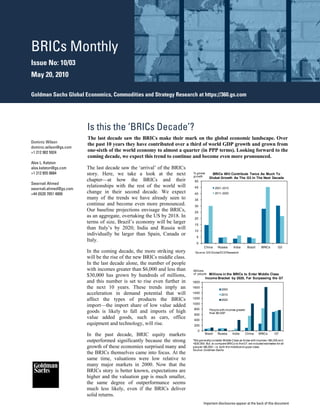
The last decade saw the BRICs make their mark on the global economic landscape. Over
Dominic Wilson
the past 10 years they have contributed over a third of world GDP growth and grown from
dominic.wilson@gs.com
+1 212 902 5924 one-sixth of the world economy to almost a quarter (in PPP terms). Looking forward to the
coming decade, we expect this trend to continue and become even more pronounced.
Alex L. Kelston
alex.kelston@gs.com The last decade saw the ‘arrival’ of the BRICs
+1 212 855 0684 story. Here, we take a look at the next % global BRICs Will Contribute Twice As Much To
growth
Global Growth As The G3 In The Next Decade
chapter—at how the BRICs and their 50
Swarnali Ahmed
relationships with the rest of the world will 45 2001-2010
swarnali.ahmed@gs.com
+44 (0)20 7051 4009 change in their second decade. We expect 40 2011-2020
many of the trends we have already seen to 35
continue and become even more pronounced. 30
Our baseline projections envisage the BRICs, 25
as an aggregate, overtaking the US by 2018. In 20
terms of size, Brazil’s economy will be larger 15
than Italy’s by 2020; India and Russia will 10
individually be larger than Spain, Canada or
5
Italy.
0
China Russia India Brazil BRICs G3
In the coming decade, the more striking story Source: GS Global ECS Research
will be the rise of the new BRICs middle class.
In the last decade alone, the number of people
with incomes greater than $6,000 and less than Millions
of people Millions in the BRICs to Enter Middle Class
$30,000 has grown by hundreds of millions, Income Bracket by 2020, Far Surpassing the G7
and this number is set to rise even further in 1800
the next 10 years. These trends imply an 1600
2000
acceleration in demand potential that will 1400
2010
affect the types of products the BRICs 1200 2020
1000
import—the import share of low value added
800 People with incomes greater
goods is likely to fall and imports of high than $6,000*
600
value added goods, such as cars, office 400
equipment and technology, will rise. 200
0
In the past decade, BRIC equity markets Brazil Russia India China BRICs G7
outperformed significantly because the strong *We generally consider Middle Class as those with incomes >$6,000 and
<$30,000. But, to compare BRICs to the G7, we included estimates for all
growth of these economies surprised many and people >$6,000 - i.e. both the middle and upper class.
Source: Goldman Sachs
the BRICs themselves came into focus. At the
same time, valuations were low relative to
many major markets in 2000. Now that the
BRICs story is better known, expectations are
higher and the valuation gap is much smaller,
the same degree of outperformance seems
much less likely, even if the BRICs deliver
solid returns.
Important disclosures appear at the back of this document
2. Goldman Sachs Global Economics, Commodities and Strategy Research BRICs Monthly
2010
US$trn BRICs' GDP Will Continue To Gain On The G7 The ‘BRICs’ Decade’—Behind Us or Ahead?
40
Since we coined the acronym in 2001, BRICs has become
35 2000
well-known worldwide, and investors, politicians and many
2010
30
2020
others have shifted their focus to these countries. As we look
25
back on the last decade, it’s clear that the BRICs have
already begun to play a more significant role in the global
20 economy and on the world political stage. The BRICs
15 contributed 36.3% of world GDP growth in PPP terms (or
10
27.8% in USD) during the first decade of the century. They
have also steadily increased their share of global output.
5
Currently, they make up about a quarter of the global
0 economy (in PPP).
G7 BRIC N-11 Other Other
Developed Emerging
Markets Markets We expect many of the trends we have already seen to
Source: GS Global ECS Research
continue over the coming 10 years and become even more
% global BRICs Will Contribute Twice As Much To
growth
Global Growth As The G3 In The Next Decade
pronounced. Our baseline projections, underpinned by
50 demographics, a process of capital accumulation and a
45 2001-2010 process of productivity catch-up, envisage that the BRICs, as
40 2011-2020 an aggregate, will overtake the US by 2018. In terms of the
35
size of the economy, by 2020, Brazil will be larger than
Italy; and India and Russia will be individually larger than
30
Spain, Canada or Italy. By 2020, we expect the BRICs to
25
account for a third of the global economy (in PPP terms) and
20 contribute about 49.0% of global GDP growth.
15
10
5
0 Will This Be The Decade of the New Middle Class?
China Russia India Brazil BRICs G3
Although the BRICs’ growth story developed in the last
Source: GS Global ECS Research
decade, one of the major effects of their growth is likely to
Millions of
people The Expanding World Middle Class play out over the next decade. That is, rising incomes in the
4,500 BRICs will create a massive new middle class, as we first
4,000
People with Incomes between 2008 detailed in Global Economics Paper 170: “The Expanding
$6,000 and $30,000
Middle: The Exploding World Middle Class and Falling
3,500
World Global Inequality”. We have already seen falling poverty
3,000 rates and rising income equality over the last decade, and
World ex China and
2,500 India these trends are set to continue.
2,000 China
fact, the middle class as we define it (people with incomes
In
1,500 India greater than $6,000 and less than $30,000) has already grown
1,000 by hundreds of millions in the last decade alone, and is set to
500 grow even more in the coming decade. Growth in the middle
0 class will be led by China, where we expect the number of
1960 1970 1980 1990 2000 2010 2020 2030 2040 2050 people entering the middle class to peak during this decade.
Source: Goldman Sachs Meanwhile, middle class growth in India will accelerate
Millions
of people Millions in the BRICs to Enter Middle Class
throughout this decade. As China and India are the world’s
Income Bracket by 2020, Far Surpassing the G7 two most populous countries, rising incomes there will have
1800 much greater impact on global demand than any other
1600
2000 countries could.
1400
2010
1200 2020
The other BRICs (and other emerging markets) will also see
1000 a rising middle class in the next decade, and should also see
800 People with incomes greater a rising ‘upper class’ (incomes higher than $30,000).
than $6,000*
600
400 With the explosion of the middle classes, spending patterns
200 are likely to change (see next section), leading to competition
0 for resources. Environmental pressures may become even
Brazil Russia India China BRICs G7
more acute, as the demand for energy increases. We have
*We generally consider Middle Class as those with incomes >$6,000 and already seen many of these effects begin to take shape, and
<$30,000. But, to compare BRICs to the G7, we included estimates for all
people >$6,000 - i.e. both the middle and upper class. we expect these patterns to intensify as the decade
Source: Goldman Sachs
progresses.
Issue No: 10/03 2 May 20, 2010
3. Goldman Sachs Global Economics, Commodities and Strategy Research BRICs Monthly
share of
Millions of Number of People Crossing Different Income As the Middle Class Grows,
consumption Transport, recreation&culture,
people Thresholds in BRICs Annually Consumption Becomes More Discretionary
140 restaurants and hotels
100%
$3,000 Housing, water, electricity &
90%
$6,000 other fuels
120
$15,000 80%
$30,000 Health
70%
100
60%
Education
80 50%
40% Communication
60
30%
20% Furnishings, household
40 equipment & maintenance
10%
20 0% Clothing & footwear
1,000-
1,500-
2,000-
3,500-
20,000-
>35,000
1,000
1,500
2,000
3,500
7,500
20,000
35,000
7,500-
800-
0 Food, beverages, tobacco,
00 10 20 30 40 50 clothing and footwear
Source: GS Global ECS Research Source: GS Global ECS Research
Middle Class Growth in the BRICs Will Drive Global Consumption
countries pass through industrialisation and GDP per capita rises to around US$1,000-$3,000, savings and
As
investments typically rise. On the flipside, consumption (as a share of GDP) usually falls during this period. Over
the past decade, China and India have for the most part stayed within this lower income range, characterised by a
low share of consumption and high savings.
believe the annual rate for the number of people with income rising above US$3,000 has peaked. That is, China
We
and India are at an inflection point. The income of tens of millions of people is rising above this key threshold every
year. As we discussed in our Global Portfolio Strategy piece “The BRICs Nifty Fifty,” these trends imply an
acceleration in demand potential. This will impact the types of products the BRICs import—the import share of low
value added goods will fall and imports of high value added goods, such as cars, office equipment and technology,
will rise. In a recent Global Economics Weekly (GEW 10/13, “Emerging Markets Gaining Prominence in Global
Trade”), we showed that the share of exports to the BRICs is increasing in both developed and emerging countries,
and this trend is likely to continue as demand from BRICs consumers rises in the next decade.
% Last Decade, the BRICs' Equity Performance
Massively Outperformed the G3
Will the BRICs’ Equity Outperformance Continue? 1000
800 Equity Return from 1/1/2001 - present
The last decade was a BRICs’ decade for stocks: the
Russian traded index rose by a sizeable 884%, followed by 600
China H-Shares (610%), the BSE in India (319%), and the 400
Bovespa in Brazil (294%). While BRICs equity markets 200
may continue to do well, some factors that led to this 0
extraordinary outperformance are less clear now.
-200
Japan (Nikkei)
Europe (EuroStoxx50)
China (H-shares)
Brazil (Bovespa)
India (BSE)
Russia (RTS)
US (SPX)
the one hand, if one believes in the immense potential of
On
rising consumer demand in the BRICs, particularly from the
middle-income section of the population, this may help to
support market performance over the next decade, both in
the BRICs and other countries that can take advantage of Source: GS Global ECS Research
increased demand. Our near-term growth views are also Index BRICs Equity Indices
stronger than consensus across the BRICs.
1200
the other hand, markets generally tend to reward growth
On Brazil Bovespa
stories most when they are much better than expected or are 1000
Russian Traded Index
in markets that are out of vogue. In the past decade, BRIC India Sensex
equity markets outperformed significantly because the 800 China H-Shares
strong growth of these economies surprised many and the
BRICs themselves came into focus. At the same time, 600
valuations were low relative to the very frothy valuations
400
that existed in many major markets in 2000. Now that the
BRICs story is better known, expectations are higher and the
200
valuation gap is much smaller, the same degree of
outperformance seems much less likely, even if the BRICs 0
deliver solid returns. 01 02 03 04 05 06 07 08 09 10
Source: GS Global ECS Research
Issue No: 10/03 3 May 20, 2010