Academic Major Biggest Factor in Who Gets Job Offer Prior to Graduation
•
0 gefällt mir•211 views

Occupational Statistics on Career Outlooks January 2010

Empfohlen
Weitere ähnliche Inhalte
Was ist angesagt?
Andere mochten auch
Ähnlich wie Academic Major Biggest Factor in Who Gets Job Offer Prior to Graduation
Ähnlich wie Academic Major Biggest Factor in Who Gets Job Offer Prior to Graduation (6)
Mehr von UCAN at UNT
Mehr von UCAN at UNT (20)
Kürzlich hochgeladen
Kürzlich hochgeladen (20)
Academic Major Biggest Factor in Who Gets Job Offer Prior to Graduation
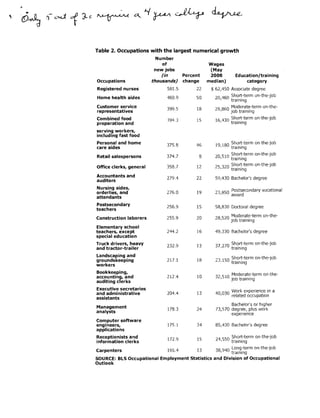
- 1. ,. Table 2. Occupations with the largest numerical growth Number of Wages new jobs (MaV (in Percent 2008 Education/training Occupations thousands) change median} category Registered nurses 581.5 22 $ 62,450 Associate degree Home health aides 460.9 50 20 460 Short-term on-the-job , tralnmg Customer service 399.5 18 29 860 ~oderate-term on-the representatives ( Job training Combined food 394.3 15 16 430 Sh?rt-term on-the-job preparation and ' tramlng serving workers, including fast food Personal and home 375.8 46 19 180 Short-term on-the-job care aides ' training Retail salespersons 374.7 8 20510 Short-term on-the-job ( training Office clerks, general 358.7 12 25 320 Short-term on-the-job , training Accountants and 279.4 22 59,430 Bachelor's degree auditors Nursing aides, orderlies, and 276.0 19 23 850 Postsecondary vocational I award attendants Postsecondary 256.9 15 58,830 Doctoral degree teachers Construction laborers 255.9 20 28 520 ~oderate-term on-the ! Job training Elementary school teachers, except 244.2 16 49,330 Bachelor's degree special education Truck drivers, heavy 232.9 13 37 270 Sh'?rt-term on-the-job and tractor-trailer ' training Landscaping and groundskeeping 217.1 18 -'3 150 Short-term on-the-job £., training workers Bookkeeping, accounting, and 212.4 10 32 510 Moder~te-term on-the ( Job training auditing clerks Executive secretaries and administrative 204.4 13 40 030 Work experience in a ( related occupation assistants Bachelor's or higher Management 178.3 24 73,570 degree, plus work analvsts experience Computer software engineers, 175.1 34 85,430 Bachelor's degree applications Receptionists and 172.9 15 24 550 Short-term on-the-job information clerks ( tramlng Carpenters 165.4 13 38 940 Long.-term on-the-job , training SOURCE: BLS Occupational Emplovment Statistics and Division of Occupational Outlook
- 2. Table 1. Occupations with the fastest growth Number of Wages new jobs (May Percent (in 2008 Education/training Occupations change thousands) median) category Biomedical engineers 72 11.6 $ 77,400 Bachelor's degree Network systems and data communications 53 155.8 71,100 Bachelor's degree analysts Home health aides 50 460.9 20 460 Sh?rt-term on-the-Job , tramlng Personal and home 46 375.8 19 180 Short-term on-the-job care aides f trammg Financial examiners 41 11.1 70,930 Bachelor's degree Medical scientists, 44.2 72,590 Doctoral degree except epidemiologists 40 Physician assistants 39 29.2 81,230 Master's degree Skin care speCialists 38 14.7 Postsecondary 28,730 vocational award Biochemists and biophysicists 37 8.7 82,840 Doctoral degree Athletic trainers 37 6.0 39,640 Bachelor's degree Physical therapist 23 760 Short-term on-the-job aides 36 16.7 ' training Dental hygienists 36 62.9 66,570 Associate degree Veterinary technologists and 36 28.5 28,900 Associate degree technicians Dental assistants 36 105.6 32 380 Moderate-term on-the , Job training Computer software engineers, applications 34 175.1 85,430 Bachelor's degree Medical assistants 34 163.9 28 300 Moderate-term on-the , Job tramlng Physical therapist assistants 33 21.2 46,140 Associate degree Veterinarians 33 19.7 79 050 First professional , degree Self-enrichment 35 720 Work experience in a 32 81.3 education teachers r related occupation Compliance officers, except agriculture, construction, health 31 80.8 48 890 long-term on-the-job and safety, and ' training transportation SOURCE: BLS Occupational Employment Statistics and Division of Occupational Outlook
- 3. Academic Major Biggest Factor in Who Gets Job Offer Prior to Graduation BETHLEHEM, PA- For new college graduates, academic major is the biggest factor in determining who gets a job offer before graduation, according to a new survey conducted by the National Association of Colleges and Employers (NACE). Results of NACE's 2010 Student Survey found that bachelor's degree graduates in five categories fared best in looking for afirst post-college job. Graduates with bachelor's degrees in accounting, business, computer science, engineering, and the social sciences were most likely to have job offers by graduation. More than 40 percent of the responding seniors in each of these categories received job offers before graduating. "'counting majors earned the top spot: Nearly 47 percent reported receiving job offers, followed by busines;;> ( with 45 percent. (See Figure 1.) /in comparison, new graduates with degrees in English, foreign language, and education fared worse; less than'7 " -30 percent of respondents in these field had job offers by time of graduation. '/ Interestingly, these results are consistent with those of earlier NACE studies, and suggest that, in general, the state of the economy and job market do not play a significant role in determining which majors are most attractive to employers, although they may affect which majors are at the bottom in terms of demand. Figure 1: Job offers, by major II Received Offer IMajor II Yes No II % of Responses ,9% 1 53 .1 % IBusiness 45.4% 1 54 .6 % Communicationsllournalis 35.2% IComputerlIS 44.1% 1 55 .9 % IEducation 23.7% 1 76 .3% 1 Engineering 11 4 1.0% 1 English 11 29 .6 % 1 Foreign language 11 28 .3 % IHealth sciences 1 38.7% 1 Liberal ArtslHumanities 11 37 . 1% 11 62 . % 9 I Mathematics 11 39 .7 % 11 60 .3 % HistorylPolitical science 1 33 .6 % 11 66 .4% IPsychology 11 35 . 1% 11 64 .9 %
- 4. EMPLOYER RATINGS OF EMPLOYEE CHARACTERISTICS Figure 34: Employers rate the importance of candidate skills/qualities . Communication skills 4.7 Strong work ethic 4.6 Initiative 4.5 Interpersonal skills (relates well to others) 4.5 Problem-solving skills 4.5 Teamwork skills (works well with others) 4.5 Analytical skills 4.4 Flexibility/adaptability 4.3 Computer skills 4.2 Detail-oriented 4.1 Leadership skills 4.1 Technical skills 4.1 Organizational skills 4.0 Self-confidence 3.9 Tactfulness 3.8 Friendly/outgoing personality 3.7 Creativity 3.6 Strategic planning skills 3.3 Entrepreneurial skills/risk-taker 3.2 Sense of humor 3.0 (5-point scale, where l=not important; 2=not very important; 3=somewhat important; 4=very important; and 5::::extremely important) Figure 36: Skills Lacking in new college graduates Skill/Quality % of Employers Who Said Skill/Quality Is Lacking Communication kills 49.7% Flexibility/adaptability 37.0% Tactfulness 35.8% Initiative 28.9% Teamwork skills 27.2% Organizational 22.5% Strong work ethic 20.8% Self-confidence 17.3% Problem~solving skiils 15.6% Detail-oriented 14.5% Sense of humor 12.7% Leadership skills 11.6% Analytical skills 11.0% Entrepreneurial skills/risk-taker 11.0% Creativity 9.2% Technical skills 8.7%