
Empfohlen
Empfohlen
Weitere ähnliche Inhalte
Was ist angesagt?
Was ist angesagt? (20)
Andere mochten auch
Andere mochten auch (20)
Ähnlich wie Pacific Islands GIS & RS News: Marine Conservation Prioritization
Ähnlich wie Pacific Islands GIS & RS News: Marine Conservation Prioritization (20)
Mehr von Turlough Guerin
Mehr von Turlough Guerin (20)
Pacific Islands GIS & RS News: Marine Conservation Prioritization
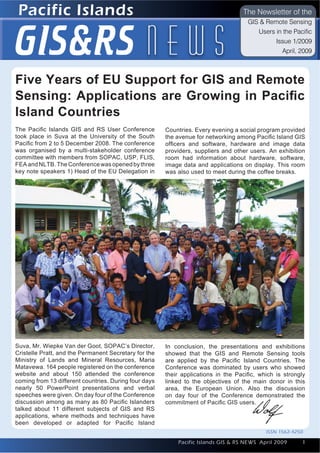
- 1. Pacific Islands Introduction to Quantum GIS Issue 1 The Newsletter of the GIS&RS n e w s GIS & Remote Sensing Users in the Pacific Issue 1/2009 April, 2009 Five Years of EU Support for GIS and Remote Sensing: Applications are Growing in Pacific Island Countries The Pacific Islands GIS and RS User Conference Countries. Every evening a social program provided took place in Suva at the University of the South the avenue for networking among Pacific Island GIS Pacific from 2 to 5 December 2008. The conference officers and software, hardware and image data was organised by a multi-stakeholder conference providers, suppliers and other users. An exhibition committee with members from SOPAC, USP, FLIS, room had information about hardware, software, FEA and NLTB. The Conference was opened by three image data and applications on display. This room key note speakers 1) Head of the EU Delegation in was also used to meet during the coffee breaks. Suva, Mr. Wiepke Van der Goot, SOPAC’s Director, In conclusion, the presentations and exhibitions Cristelle Pratt, and the Permanent Secretary for the showed that the GIS and Remote Sensing tools Ministry of Lands and Mineral Resources, Maria are applied by the Pacific Island Countries. The Matavewa. 164 people registered on the conference Conference was dominated by users who showed website and about 150 attended the conference their applications in the Pacific, which is strongly coming from 13 different countries. During four days linked to the objectives of the main donor in this nearly 50 PowerPoint presentations and verbal area, the European Union. Also the discussion speeches were given. On day four of the Conference on day four of the Conference demonstrated the discussion among as many as 80 Pacific Islanders commitment of Pacific GIS users. talked about 11 different subjects of GIS and RS applications, where methods and techniques have been developed or adapted for Pacific Island ISSN 1562- 4250 Pacific Islands GIS & RS NEWS April 2009 1 1
- 2. ALOS - Advanced Land Observing Satellite Contents Marine Conservation Prioritiztion................................................................................................................................3 The Asia Pacific Natural Hazards Information Network (APNHIN): Providing Geospatial Data and Fostering Data Sharing Partnerships..................................................................................................................................................5 Introduction to Quantum GIS......................................................................................................................................7 Applications of GIS and GPS to Reduce Vehicle Fuel Use........................................................................................8 Water Assets Enterprise Gis Development Using A Modular Approach ....................................................................10 Creation, Management and Aeronautical Chart Production Using GIS of Tonga’s Domestic Airspace Data..............11 Nadi Flood Mapping Applying TerraSAR-X Image Data............................................................................................13 Reference Image Points Collection and Image Rectification of Pohnpei....................................................................17 Habitat Mapping of Aitutaki, Cook Islands.................................................................................................................19 ALOS (Advanced Land Observing Satellite) the alternative for 1:25,000 scale map- ping. This Japanese satellite provides multi-spectral image data with 10 metre spa- tial resolution for the bands blue, green, red and near-infrared recorded from a sensor called AVNIR-2 (Advanced Visible and Near Infrared Radiometer type 2). The satellite has other sensors onboard where one of them PRISM (Panchromatic Remote-sensing Instrument for Stereo Mapping) is capable of looking forward and backward to create stereo data usable for DTM creation with nearly 5 metre accura- cy, which allows contour lines of 10 m. The spatial resolution of PRISM is 2.5 metre, where this data can be also utilised to pan-sharpen the multi-spectral image data. Such data sets then allow thematic mapping at 1:10,000 scale. SOPAC is currently in negotiations to distribute ALOS data for users in Pacific is- land Countries. Western Viti Levu (Fiji) recorded from ALOS 2 2 Pacific Islands GIS & RS NEWS April 2009
- 3. Introduction to Quantum GIS Issue 1 Marine Conservation Prioritization Marine Conservation Prioritization driving forces behind this analysis are the numerous conservation pledges that have been made by Paul Anderson, SPREP Pacific Island Countries and Territories including - The CBD 2012 goals, National biodiversity strategies and action plans, Fiji’s 30% coastal marine protected area commitment, the Micronesian Introduction challenge and the two Samoa’s initiative which all call for expanded coastal marine protection. Another driving factor for this work is the current status of Conservation planners working at the national and near shore biodiversity. In the past, intensive near regional scale need to answer the question “how shore fisheries often were supplied by populations can the locations most in need of conservation/ reproducing in “natural” refuges—places that were protection be best identified?” In the marine too deep, too remote, too dangerous, or too rough context, this question is particularly important given to fish. However, as the reach of fishing expands, the deterioration in the marine environment that and population pressures increase and coral health has occurred due to changes in harvest methods, declines, much of the near shore fisheries are population pressure and environmental pressures as well as our early stage in the development of marine managed areas (MMA) and marine protected areas (MPA). An efficient system of identifying and prioritizing protected sites is required to answer this question. By mapping locations of threatened species and populations that are highly aggregated in time or space, the Key Biodiversity Area (KBA) process which SPREP is employing allows marine sites of global biodiversity significance to be Figure 02: Fiji Qoliqoli areas, the question is where to locate marine managed areas. having to rely on fewer and fewer sources of recruits. Without refuges, MMAs, MPAs and proactive management the future for Pacific reef fish is bleak. This is why MMAs, MPAs and expanded networks are so important Process: To address the issue of conservation prioritization Figure 01: IUCN red listed species, Samoa SPREP is collating data from many sources, then cataloging, mapping analyzing and publishing it. systematically identified. KBAs are sites of global A number of key datasets need to be compiled conservation significance that are actually or can in (GIS). These include range maps and locality potentially be managed for conservation. records of target species (i.e., species that trigger the KBA criteria), and contextual data layers that Background are available, such as bathymetry, habitat maps, political/traditional boundaries, and management SPREP is using physical and biological marine units (including existing MMAs/MPAs). observations to assist members plan and create MMAs and expand MMA/MPA networks. One of the The 6 main steps to identifying KBAs and marine Pacific Islands GIS & RS NEWS April 2009 3 3
- 4. Marine Conservation Prioritization Figure 04: Potential MMA network including Samoa Figure 03:Vulnerable IUCN red listed species- and American Samoa Bumphead Parrot Fish managed area networks are listed below: information and there is no one clearinghouse for this data, it is critical to document the sources of • Compile a list of species that can potentially supporting data in the GIS. SPREP is addressing trigger KBAs, and map localities at which they this by uploading the sources to a literature database occur. where they are assigned a unique identifier which • Apply thresholds to populations of each trigger can be used as an attribute in a vector layer and species to identify KBA sites. in the metadata for the layer, thereby linking the • Delineate KBA boundaries by overlaying source to the spatial data. All published literature, locations of threatened species and populations historical surveys and expert commentary is input of other species that can trigger KBAs with into this database which will be available to the available maps describing management public early next year. units (particularly those showing boundaries of existing and proposed MPAs), habitats, GIS database – The GIS layers created as the bathymetry and geomorphology. result of the KBA analysis as well as the contextual • As resources allow, identify and undertake data layers used in the analysis are compiled into a appropriate actions to safeguard KBAs and national marine data set. populations of trigger species within. This activity will generally begin with the development MMA Networks – By identifying the types of of a prioritization framework for KBAs within the habitat and species of concern that are currently region in question, and include the establishment represented in managed areas the results from of a monitoring program. the KBA analysis can help link existing sites into • Document data used and all steps undertaken a strategic system of resilient, linked sites that during the KBA identification and delineation conserve and enhance biodiversity by including processes. underrepresented sites, species and replication of key site types. Results Challenges There are several outputs of the KBA analysis aside Species Data: Due to the long history of marine re- from the identification of key biodiversity areas. search in the region being conducted by different The supporting literature and GIS data is compiled government agencies, NGOs, overseas scientists into databases to allow for future iterations of this and regional organizations there are many sourc- work and other marine applications. es of data on species of concern which serve as the triggers for KBA site prioritization. Locating all Source database - Because there are so many sources for a particular area or species has proved types of data sources for the species location spatial to be a major undertaking. In response to this chal- 4 4 Pacific Islands GIS & RS NEWS April 2009
- 5. Introduction to Quantum GIS Issue 1 (APNHIN): Providing Geospatial Data and Fostering Data Sharing Partnerships lenge preliminary analysis and results are shared For more information visit www.kba.conservation. widely to elicit comments, data and recommenda- org to download the marine KBA manual and tions from the wider conservation community. paula@sprep.org with any questions. Spatial data – Many of the contextual data layers used for terrestrial KBA analy- The Asia Pacific Natural Hazards sis are lacking in the marine environment. Information Network (APNHIN): Pro- For example, bathymetry for near shore areas is viding Geospatial Data and Fostering lacking for many islands and habitat and habitat Data Sharing Partnerships proxies in marine environments have only been de- veloped for specific locations. Part of the results Todd Bosse, Senior Geospatial Information of the KBA analysis is a gap analysis of what data, Analyst both spatial and taxonomic, is lacking, thereby high- Pacific Disaster Center lighting the areas for future work. Connectivity Issues. Pacific Disaster Center hosts the Asia Pacific Natu- ral Hazards Information Network (APNHIN), a suite of applications and information services providing disaster managers, planners, governments, and nongovernmental organizations with instant access to a wide spectrum of high-quality geospatial data resources. Built upon the underlying specifications and tech- nologies of ESRI’s Geography Network (http://www. geographynetwork.com), APNHIN is a metadata search tool which has been customized to provide users with a web-based form with which to search for, evaluate, and download data. APNHIN requires only a standard browser to connect. Users can search for data using a range of options such as: • Theme Keyword (i.e. river, flooding, volcano, etc.); • Place Keyword (i.e Hawaii); • FGDC Content Keywords (Admin & Political Bounds, Oceans & Estuaries, etc). Figure 05: Drifter data from the Samoan Archipelago In addition to these options, users of APNHIN can used to view connectivity. The red polygon is the 30 search for data on recent international disasters day travel distance for the drifters. by entering the GLIDE number (http://www.glide- number.net) or by entering the words “International Summary and Recommendations Charter” to locate a disaster for which the Interna- tional Charter “Space and Major Disasters” (http:// Applicability – All Pacific island countries can utilize www.disasterscharter.org/) has been activated. and adapt the KBA methodology to help prioritize their conservation goals and achieve their respective The results of a search will present the user with protected area commitments. metadata in fully compliant ISO 19115 format (and Local commitment – The since local ownership is FGDC where applicable). The metadata will inform critical to the success of protected the user of important information such as source, areas, prioritization of KBAs including identification, date, use/access constraints, and point of contact delineation and implementation, is best achieved to obtain the dataset. The data in APNHIN comes through activities undertaken at local and national from either PDC’s data environment or one of the levels. APNHIN partner organizations. Pacific Islands GIS & RS NEWS April 2009 5 5
- 6. (APNHIN): Providing Geospatial Data and Fostering Data Sharing Partnerships PDC Enterprise Geospatial Database (EGDb) The creation of metadata records is crucial for APNHIN draws upon PDC’s Enterprise Geospatial APNHIN participation. All information, whether map APNHIN draws upon PDC’s Enterprise Geospatial services or data files, must have compliant metadata Database (EGDb), a comprehensive geospatial meeting some minimum standard—preferably either data management and storage environment. International Standards Organization (ISO) 19115 The EGDb supports a wealth of remotely sensed or Federal Geographic Data Committee (FGDC), imagery and GIS layers acquired from a variety but at least enough information to allow users to of sources at different spatial resolutions, which search and locate desired datasets. have been processed to consistent specifications, integrated, and subjected to quality control steps. EGDb includes data such as: • Active and Historical Hazard Events (Tropical storm, volcano, tsunami, earthquake, etc.); • Critical Infrastructure ; • Emergency and Public Services; • Environmental Characteristics; • Demographic and Socio-Economic Data; and • Baseline Topographic Data. APNHIN provides access to PDC’s unique dynamic data on frequently changing weather and natural phenomenon such as those currently deployed in PDC’s Asia Pacific Natural Hazards and Vulnerabilities Atlas (http://atlas.pdc.org). APNHIN users are provided access to frequently updated, value-added information on phenomena including tropical storms, earthquakes, volcanoes, wildfires, rainfall, and flooding. Figure 01: This is the simple form that starts an APNHIN data search. Become a Partner of the APNHIN Community By building collaborations with partner organizations, APNHIN has grown over time to form a community of information-sharers, and it is growing still. Joining APNHIN is formalized by a Memorandum of Understanding (MOU) with Pacific Disaster Center. Identifying, collecting, processing, and maintaining geospatial data layers can be extremely time consuming—accounting for nearly 80% of the cost of deploying a GIS-based decision support or resource management application. By providing instant access to a wide spectrum of high-quality data resources, APNHIN becomes an indispensable asset to disaster management decision-makers. Organizations/Agencies who have information resources that can be shared are encouraged to become APNHIN Partners. When information is shared in this fashion the high cost of data collection, processing, and maintenance is spread among many, reducing the cost to each. Additionally, the data are more likely to be current since they are Figure 02: A tab on the APNHIN website provide retrieved each time from the originator rather than a information on data-partners duplicated archive. 6 6 Pacific Islands GIS & RS NEWS April 2009
- 7. Introduction to Quantum GIS (APNHIN): Providing Geospatial Data and Fostering Data Sharing Partnerships Issue 1 Figure 03:This screen shows the results from an Figure 05:This page shows the full metadata for the APNHIN search for data on historical earthquakes. World Historical Earthquakes dataset in APNHIN. Figure 04:This page shows the details of the World Figure 06:This screen shows the results from a search Historical Earthquakes dataset in APNHIN. for data holdings of an APNHIN Partner. In this case the Partner is the NOAA Coastal Services Center. Recognizing that effective metadata authoring can be a daunting task to those not currently working Current data-partners in APNHIN include: with metadata standards and tools, PDC has prepared templates for many of the commonly used • NOAA Pacific Services Center (PSC) ; data sets. As part of our “APNHIN Startup Kit,” • Geo-Informatics and Space Technology PDC provides these templates and other training Development Agency (GISTDA); documents to new members. • Pacific Risk Management Ohana (PRiMO); • U.S. Geological Survey (USGS) ; To access APNHIN go to: http://apnhin.pdc.org. • The National Map; • Hawaii Clearinghouse of USGS; and To inquire about becoming an APNHIN Partner • Pacific Biodiversity Information Forum send an email to: apnhin@pdc.org. • Partnerships in progress: • Pacific Islands Applied Geoscience Commission (SOPAC); and • U.N. Office for the Coordination of Humanitarian Affairs (OCHA). Pacific Islands GIS & RS NEWS April 2009 7 7
- 8. Introduction to Quantum GIS Map Info Mif / Tab file formats, oracle spatial, Introduction to Quantum GIS GML and Post GIS file formats. Keleni Raqisia QGIS also supports raster data sources to include SOPAC tools for importing Grass raster file formats, Web Map services formats (WMS) and provides support for file based GDAL). It allows for viewing of layers and with its current QGIS version 1.0.0 Preview tool, includes improved editing functionality for layers and attributes, such as copy/cut/ paste features, vertex editing, snapping and panning during digitising of layers and also allows for GIS analysis through PlugIns including the improved fwtool PlugIn which allows for geo- processing functionality such as clipping/ dissolve, buffering, union and intersect. Sampling tools for selecting by location/ select by attributes and integration with other open GIS packages such as Grass. QGIS also has thousands of defined projections available with functionality allowing search by EPSG Code or by projection name, dialogue to enable “on the fly Figure 01:QGIS Map Composer Interface projections” and customising projections. The current QGIS version 1.0.0 Preview 2 also has improved Map Composing tools to enable easy navigation and organisation of map elements. Quantum GIS is currently being used within SOPAC as a support software for creating maps and eventually producing thumbnails for the SOPAC GEONETWORK website a repository that houses and allows the sharing of geographically referenced thematic information between different organizations. Currently QGIS has being utilised to produce bathymetry maps, showing differences in depth around survey area . XYZ files are imported into Quantum GIS as text delimited files and using Figure 02:QGIS Map Layout the layer properties to give a continuous colour and classification of the depth value showing the The main limitation to the use of GIS software maximum and the minimum value. Quantum GIS in the Pacific ,is usually the issue of the hefty has also being utilised as an effective viewing tool cost associated with the software and with due allowing visualisation of survey control points , consideration to which GIS software individuals survey ship tracks and viewing of various types of may prefer to use or what users generally are ocean survey, Ariel and satellite imagery . accustomed to. An emerging option available today is the use of Open-Source GIS software. Quantum GIS has a long history of its development. Its capability to perform GIS functionalities has Quantum GIS , is one of those Open-Source improved tremendously as well, to now include desktop GIS application that has been used within performing GIS analysis . Though Quantum GIS SOPAC and has proven to produce similar results may not be seen as having the ability to convincingly to what proprietary GIS software can do. replace ArcGIS or MapInfo, QGIS with its continuous Being Open-Source the software is free of cost. It daily development to its functionalities, QGIS can runs on Linux, Unix, Mac OSX, Windows XP and be viewed as another option for GIS users in the possibly others and is user-friendly. It supports Pacific where financial resources is limited vector data file formats including Esri shapefiles, 8 8 Pacific Islands GIS & RS NEWS April 2009
- 9. Introduction to Quantum GIS GPS to Reduce Vehicle Fuel Use Applications of GIS and Issue 1 Applications of GIS and GPS to Reduce Vehicle Fuel Use Dr. Turlough Guerin, Telstra Corporation Limited, Melbourne, Australia Fuel used in road transport is a major contributor to greenhouse gas emissions and global warm- ing. Consider this. The transport sector in Austalia contributes 14% to national greenhouse gas emis- sions. The information Communications and Tele- communications industry (ICT) contributes to just 0.3%. ICT, GIS & GPS can cut the amount of fuel we burn for road transport. Figure 01:Real-time vehicle tracking and activity monitoring to help reduce operational costs As GIS/GPS professionals I don’t need to tell you and improve productivity, safety and customer about the consequences of global warming on hab- satisfaction itats and ecosystems. Making sense of large mass- Trimble Geo Manager . Let me explain. Trimble es of geographic and time course data is a critical GeoManager is a product offered to our enterprise role that you as professionals, and researchers, and government customers to improve the efficien- contribute to understanding the impacts of climate cy of their field work forces and fleets. This product change. Just a 2 degree increase in global average relies on field staff being connected via wireless temperature will be sufficient to see the onset of broadband. It finds the shortest distance between irreversible impacts of dangerous climate change. jobs so work can be scheduled in the most time ef- Unfortunately, with our current rates of greenhouse fective and spatially efficient way. It leverages GPS gas emissions to the atmosphere, we are on track technology with the additional feature that it sends to see this rise of 2 degrees unless we make deep a regular positioning signal to a satellite. cuts. It allows work schedulers to match the closest field Smart ICT, GPS and GIS based systems, that can staff, with the needed skills, to the next nearest job. improve the efficiency of how we use fossil fuels, Trimble is now reducing travel kilometres between has to be a priority. Road transport systems are field jobs by 6%. When running a large field work woefully, inefficient. The Australian Bureau of Sta- force and vehicle fleet, like ours, this equates to tistics reported a few years ago that commercial millions of litres of fuel saved each year. Telstra vehicle utilisation was about 70%. That is one I ev- has a vehicle fleet of around 14,000 vehicles. But ery 3 trucks on Australian roads are empty. In ad- the greatest value in implementing Trimble has dition to inefficiencies, transport costs are trending been the recovery of lost time from the field work- upwards. Road congestion in Australia is estimated force. Telstra has seen an increase of 13 percent to cost the economy 6 billion dollars (Australian) a productivity in the field work force since installing year. Trimble in the past year alone. Through our directo- ries and search business, Sensis, which is a wholly And the current recession means that transport owned subsidiary of Telstra, we are offering our costs are coming under closer scrutiny. Fuel prices customers online maps. The concept is simple. In will track upwards again even though the crude oil conjunction with our directories, we are helping our is now down to $50/barrel. In reducing fuel usage, consumer customers and small businesses, to find consider what we are doing in Telstra right now us- what they want quicker, with the least amount of ing GIS/GPS: both for our enterprise and govern- travel required. ment customers and ourselves. This same business unit, Sensis, publishes a quar- We are enabling the efficient deployment of field terly consumer report based on a survey of more work forces, linking field staff to jobs in the short- than a 1000 consumers. I’ll lift two findings from est possible time with least travel distance using the most recent report that shows that consumers Pacific Islands GIS & RS NEWS April 2009 9
- 10. Water Assets Enterprise Gis Development Using A Modular Approach are making use of these online services to reduce Water Board had two action plans to maintain best their fuel usage: practise in asset management; 1. To initiate comprehensive asset audit on all • 44% of customers reported they used online their water and sewerage systems to have an maps to find more efficient routes accurate understanding of the true state of all assets in terms of value, performance and re- • 36% reported they used online directories to sidual life, and find closer suppliers 2. To establish and maintain a fully integrated as- set management system to be able to have a In closing, I have mentioned just 2 applications of systematic storage of asset information for easy ICT, GIS and GPS to reduce fuel consumption and accessibility and an improved pre-active capital greenhouse gas emissions. New GIS and GPS ap- asset maintenance, upgrade and replacement plications will need to be developed, and existing planning. ones adopted widely, if we are to curb our reliance on transport fuels. Your contributions as GIS and Project Scope GPS professionals are needed more than ever be- fore to meet this challenge. From the initial system design phase through needs assessment, system requirement specifica- tions development and the conceptual design of Water Assets Enterprise Gis the Water Assets Geographical Information Sys- Development tem (WAGIS), three processes were identified for the WAGIS. The systems identified were the; Using A Modular Approach 3. Drawing Cataloguing and Registration System (DCAR); Mary Pati, Datec (PNG) and Nepthaly Serebut, 4. Planning and design system (PAD); and PNG Water Board. 5. Assets Maintenance and Management System Introduction (AMAM). In 2008, the PNG Water Board, having recognised The scope of the first module of the WAGIS was a need to have a water and waste asset manage- identified as; ment system commissioned a GIS project to Datec • development of a WAGIS pilot project for data (PNG) Ltd to be it’s development partner. PNG capture and training • Oracle, MapInfo and Map Basic installations • development of the Drawing Cataloguing and Registration system (DCAR) • development of Pronto and WAGIS interface for management reports and customised the- matic maps. Module 1 – Document Cataloguing and Registra- tion System (DCAR) Operational Environment This module dealt with the problem of hardcopy design drawings and plans stored in filing cabinets in the head office in Port Moresby without proper archival system for quicker access and retrieval of the drawings by the various offices throughout Figure 01: An overview Water Assets Geographical Papua New Guinea. Information System 10 Pacific Islands GIS & RS NEWS April 2009
- 11. Creation, Management GIS Aeronautical Chart Production Using GIS of Tonga’s Domestic Airspace Data Introduction to Quantum and Issue 1 2. Use the pilot project to train PNG Water board staff on data capture, update and maintenance of the WAGIS database, create thematic maps, and to create and print workspaces. 3. Using the pilot project to draw CAD standards and specifications. Deliverables 4. Drawing cataloguing and registration system (DCAR) 5. Water assets geographic information system (WAGIS) working area. 6. Water assets geographic interface develop- Figure 02: The main components of the Water Assets ment Geographical System. 7. PNG Waterboard standards and specifications document. 8. DCAR users guide. The APEX or the Oracle Application Express which 9. WAGIS users guide and data capture proce- is browser based and cost effective was used to dure develop the DCAR. All the manual maps and plans 10. DCAR and WAGIS training. were scanned and uploaded on to the Oracle data- base. The DCAR automatically assigns a drawing number from the earliest to the latest drawings and Summary plans and categories them as water, sewer or both and miscellaneous for all other drawings. With the first module completed and operational, it builds the platform for the next module to be devel- MapInfo workspaces are also prepared and pa- oped. The next module will involve a more dynamic rameters of plotters are set to print or viewing to environment whereby library templates will be de- required scales and paper sizes with standard title veloped for different CAD symbols and standards blocks. It is then printed as a pdf document and identified in this module. Designs and drawings will uploaded onto the database as a pdf document for be captured and stored in the database. viewing and printing. These documents can be ac- The most challenging aspect of this project has cessed by all users. The documents can be eas- been the spatial data capture. A champion has to ily accessed by their offices throughout PNG using be identified for the data capture who needs to have a greater commitment to ensure data quality assur- various search parameters. ance and consistency in the spatial data updates. Development Environment Creation, Management and Aeronau- tical Chart Production Using GIS of This environment is the area whereby updates and Tonga’s Domestic Airspace Data modifications to the WAGIS data layers take place. Upon logon to the DCAR, officers with access rights Lara Payne, Peace Corps, Tonga to updating can view the Map Basic program which launches certain customised MapInfo with updating Recently, the LGIS Section of the Ministry of Lands, procedures for the base water and sewer assets Survey, Natural Resources and Environment was tables. asked by Tonga Airports Limited (TAL) to create, house and manage all of the Kingdom’s domestic WAGIS Pilot project aeronautical data using GIS. TAL supplied the Ministry’s LGIS Section with hard copy maps, some The suburb of East Taraka of Lae City was chosen flight space parameter criteria and X, Y coordinates as the pilot project area due to the fact that it had of navigational aids and airport reference points to aid most of the water and sewer assets. The aim of de- LGIS in creation of all the domestic aeronautical GIS veloping the pilot project is three fold; data. With only these materials and the utilization of 1. Create the water and sewer assets base tables satellite imagery for remote QA/QC the LGIS Section in MapInfo and to export data from CAD and was successful in creating a current and accurate manual forms, domestic aeronautical GIS dataset for Tonga and 11 Pacific Islands GIS & RS NEWS April 2009 11
- 12. Creation, Management and Aeronautical Chart Production Using GIS of Tonga’s Domestic Airspace Data Figure 01:Completed Tonga Domestic Aeronautical Chart Figure 03:Example of ARP & NAVAID locations in relation to airfield Figure 02: Erroneous ARP locations for Niuatoputapu Island, Tonga Figure 04:Example of Tonga Domestic Airspace 12 Pacific Islands GIS & RS NEWS April 2009
- 13. Introduction to Quantum GIS Issue 1 Nadi Flood Mapping Applying TerraSAR-X Image Data. TAL. Additionally, the aeronautical dataset is z –value Nadi Flood Mapping Applying enabled to enable 3D visualization and modeling. TerraSAR-X Image Data. In order to create the Tonga Domestic Aeronautical GIS data accurate source data for five features had Wolf Forstreuter, Litia Gaunavou, Elizabeth to be collected. Here is a list of those features and definitions: Whippy, Vilisi Tokalauvere and Joy Papao. 1. Airport Reference Points (ARP’s) • these are the official coordinate values that Introduction reference a specific airport • the most important feature because several of From 10th to 11th January 2009, Nadi was flooded the other feature classes are based on these to an extent that only occurs every 20 years. The values.(see Figure 03) new space-borne image radar technology is able to capture data during cloud cover and heavy rain 2. Navigational Aids (NAVAIDS) and provide data suitable for mapping at a 1:10,000 • various types of reference points used by scale. This technology was utilised for flood analyis airports and pilots for navigation purposes. (see in the Nadi area Figure 1) Flood Mapping 3. Aerodomes • these features (See Figure 01) indicate minimum flight height for particular distances from the ARP (25, 75,100 and 130 nautical miles) • based on ARP points, created with buffers 4. Domestic Flight Paths • linear features indicating minimum flight altitude, • distance and bearing • based on ARP’s 5. Domestic Airspace • airspace designated to be under the jurisdiction of the Tonga Aviation Authority. The greatest difficulty with this project was that in many cases the source data information was erro- neous and conflicting. Figure 4 demonstrates the discrepancy that was found in the ARP source data information. ARP locations should be closely as- sociated with airstrips so it was evident once the first set of coordinates was input and appeared in the ocean that care needed to be taken with the source data supplied. Correctly identifying the ARP points is vital as the aerodromes and flight path routes are based them. Once the correct input data Figure 02: Radar Scene captured on 12th January was obtained and verified the GIS dataset of the 5 2009 through TerraSAR-X satellite. The scene covers feature classes was created. All data creation and most of the Nadi river catchment. processing was done using ArcGIS 9.2 and verified with Quickbird 1 meter resolution satellite imagery. See Figure 5 for an example of the 3D representa- Flood Mapping was done to identify areas and tion of the aeronautical data. households that are susceptible to flooding. This can either be related to low-lying topography or poor drainage system. During data recording at 18:30 on Monday, 12th January most water had receeded and it was impossible to map the flood extent, how- ever, the remaining water coverage indicates areas 13 Pacific Islands GIS & RS NEWS April 2009 13
- 14. Nadi Flood Mapping Applying TerraSAR-X Image Data. that are prone to flooding Water bodies of flooded areas have very smooth surface which reflects the beam away from the sen- Data Sources sor therefore the areas appear black. Three different data sources were utilised for inter- pretation and map production: radar satellite image Pan-Sharpened QuickBird Image Data data, high resolution satellite data in optical range Pan-sharpened QuickBird data is a synthetic image and the topographic map 1:50,000. product by combining the 60cm resolution panchro- matic channel of the satellite with the 2.4 metre res- TerraSAR-X Image Data olution multi-spectral channel of the same satellite. The TerraSAR-X image data was captured 6:30 The image data in Figure 03 was recorded on 6th (Greenwich time) on Monday 12th January, which May 2006. The image data arrived as GeoTiff file is equivalent to 18:30 Fiji time. This data was down- projection UTM WGS84, Datum Zone 60 South. In- loaded in Kiruna (Sweden) transferred to company vestigations have shown that the data has a shift of Infoterra and from there downloaded through the several metres compared with GPS measurements Internet. The download required 8 and a half hours of Reference Image Points. for 1.6 giga bytes file size. Topographic Map 1:50,000 The image data was available as 8bit GeoTIFF file. To classify the road network into categories, the ERDAS image analysis software is able to display sheet L27 Lautoka of the topographic map series and analyze TIFF file format. The recording was 31 of the Fiji Lands Department was utilised. made as strip mode resampled to 1.3m pixels. Ter- raSAR-X satellite is equipped with a synthetic aper- ture radar sensor which sends the beam to the ob- Information Layers ject and analyse the intensity of the reflected signal. The produced map (refer to figure 04 page 5) com- The signal response depends on the smoothness bines several information layers derived from inter- and texture of the surface, the angle of the surface pretation and digitising of the QuickBird data and towards the sensor and the material of the object. satellite radar data. Road Network The road network was digitised from the pan-sharp- ened QuickBird data and categorised according to the topographic map. The road network is stored into three different MapInfo tables: 1. Main roads; 2. Secondary roads; and 3. Vehicle tracks. River System/Water Bodies The river system was digitised from the pan-sharp- ened QuickBird data and categorised according to the topographic map. Water and lakes and other water bodies were captured as polygons. There are three MapInfo tables: 1. Rivers; 2. Creeks; and 3. Water bodies. House Location The centre of the houses were interpreted from the pan-sharpened QuickBird images and a symbol was placed on top of the roof. Figure 02: Pan-sharpened Quickbird Image data recorded over a period in 2006 with 60cm resolution. This image data was used as reference to rectify the Coastline radar data and to digitise the location of houses and The coastline was interpreted from the pan-sharp- infrastructure ened QuickBird image and stored as polyline. 14 Pacific Islands GIS & RS NEWS April 2009
- 15. Introduction to Quantum GIS Issue 1 Nadi Flood Mapping Applying TerraSAR-X Image Data. Flooded Areas The radar data was geometrically corrected in Ger- Flooded areas were mapped through different meth- many, however data analysis of similar image data ods as described in the paragraphs below in 2008 showed a shift of about 100 metres. Flooded Areas Mapped Through Visual Inter- For the mapping procedure, the radar data was rec- pretation tified and reference to the pan-sharpened QuickBird The visual interpretation of the TerraSAR-X radar data which resulted in a linear shift. data delineated all areas of low reflectance. Known Accuracy of Interpretation as tarsealed areas such as the runaway of Nadi During the interpretation of water bodies from the Airport were excluded. It is possible that other ar- radar data set a zoom factor of 1000 metres was eas are also tarsealed and not flooded as reference used and areas smaller the one tenth of a hector data was missing. The data was captured at three- was attached to the biggest neighboring class. Dur- metre resolution as polygons to fulfil the mapping ing the semi-automatic data analysis areas smaller requirement at 1:10,000 scale. the 1000 square metre were also attached to the biggest neighboring class. Flooded Areas Mapped through Semi-automatic Procedures The interpretation of the road network and the river As described in the semi automatic water body system including creeks and other water bodies ful- exAs described in the semi-automatic water body filled the requirements of 1:10,000 scale thematic extraction chapter, analysis methods were utilised to semi-automatically delineate flooded areas from mapping. the image. The advantage is the faster analysis and Steps of Work non-biased interpretation. Resulting in more smaller This chapter describes the work flow and work pro- areas included in the mapping process. cess. Accuracy Creating Subsets The mapping accuracy is determined by the resolu- The subset was delineated from the pan-sharpened tion of the two types of image data, the delineation QuickBird data covering one map sheet of A0 size process and the accuracy of geometric correction. at 1:10,000 scale. From the radar data a bigger area was extracted extending the subset of the Quick- Accuracy of Projection Bird data. The pan-sharpened QuickBird data was received Geometric Image Correction The pan-sharpened QuickBird data was received The radar dataset as rectified and referenced to the as geometric corrected data with UTM projection pan-sharpened QuickBird data where six Reference WGS84 spheroid and datum zone 60 South. Tests Image Points were used; mostly corners of road GPS surveys in 2007 showed that this data is not junctions. Polynomial transformation first order was correct. A set of Referenced Image Points is re- used to re-calculate the image position. Bilinear in- quired to geometrically re-correct the data to be ex- terpolation was used as re-sampling method. act at 1:10,000 scale. Figure 03: Result of visual delineation of areas covered by water (left) and semi-automatic mapping (right). The semi automatic mapping is much faster (one hour) compared to One and a half days of visual interpretation and it is less biased. 15 Pacific Islands GIS & RS NEWS April 2009 15
- 16. Nadi Flood Mapping Applying TerraSAR-X Image Data. Figure 04: The resulting map of the mapped flooded areas shows the situation on Monday evening where most of the water had drained. There are still areas covered by water either due to low topography or bad drainage. The areas have been mapped from TerraSAR-X radar data, all other map elements such as roads, river system and house locations were interpreted from pan-sharpened QuickBird data. 16 Pacific Islands GIS & RS NEWS April 2009
- 17. Introduction to QuantumPoints Collection and Image Rectification of Pohnpei Reference Image GIS Issue 1 GIS Backdrop Production Map Editing and Printing The geometrically corrected radar image data as All described layers were displayed in a map win- well as the pan-sharpened QuickBird image data dow layout. Scale bar, title and legend were added was exported as GeoTiff enabling a direct import to and converted to PDF file format. It was possible MapInfo. to print the map directly from MapInfo environment as only vector layers were involved keeping the file Delineation and Digitizing size small. The rivers, road network, house location, coastline, and water bodies before the flood were digitised Conclusion and Recommendations from the screen in the MapInfo environment of the The visual image interpretation of flooded areas QuickBird image backdrop. The flooded areas were required one and a half day of work. The digitising delineated from the radar image. of road network, river system and house location is slightly faster but also required two additional people Semi Automatic Water Body Extraction working in parallel. If these features are available To reduce the interpretation time and to perform a as digital layers and if the described semi-automatic non-biased analysis, a semi-automatic water body flood area extraction is used, the analysis time extraction was tested. would be reduced to one hour. It is recommended Speckle Suppression that all houses located in low-lying areas as well To reduce the salt and pepper effect (speckle) ER- infrastructures are available in digital format. DAS provides several filters. The filter used was called “Local Region”, which uses the mean value The programming of the satellite was too late due to of the pixels in a local region of a moving window a delay in request from Fiji. As a result, the recording having the lowest variance. The result was a smooth was not at the high peak of the flooding. image with reduced speckle. To ensure that the satellite data is recorded at the peak of the flood, the data acquisition order has to Density Slicing be placed on time. As a inter-active process the level between the grey It is therefore essential that the disaster management indicating water and non water area was identified office directly informs the SOPAC GIS&RS section on the screen. Through the ERDAS module Spatial during the rising of the flood. Modeler, a program was created which separated the image pixels into water and non water areas. SOPAC has to have access to funding resources for the image data, therefore it is recommended that Image Clustering (Clump) there is a permanent flood response fund available The resulting image shows many small areas with for image data aquisition. low reflectance that can be caused by reasons, such as roofs at an angle similar to the radar beam. Water areas can be identified as big pixel clusters Reference Image Points Collection of low reflectance. and Image Rectification of Pohnpei The ERDAS module Clump can address pixel clus- Elizabeth Whippy, Vilisi Tokalauvere ters of same class attached together. The module and Litea Biukoto clump creates an ID for every cluster and stores the information for the number of pixels in a particular Introduction cluster. The pansharpened QuickBird image (hereafter will be referred to as satellite image) of Pohnpei is a Elimination of Small Clusters 60 cm resolution satellite image purchased through The ERDAS module Eliminate, was used to convert the SOPAC-EU project. This satellite image comes the class of clusters lower than thousand pixels to in geo-referenced but, the average shift amount to the biggest neighboring class. about 12 meters. To correct this shift, a survey of different Reference Raster to Vector Conversion Image Points (RIPs) around the island was The ERDAS module Raster to Vector was utilised to established. Survey grade Global Positioning convert the cluster to polygons stored as an ArcInfo System (GPS) as used to achieve the scale required shape file. The ArcInfo shape file was converted in for correcting the image. the MapInfo utility into MapInfo TAB file. 17 Pacific Islands GIS & RS NEWS April 2009 17
- 18. Reference Image Points Collection and Image Rectification of Pohnpei Pre-selection of RIPs A 1km grid was drawn on the satellite image. Within a space of 1km, a potential RIP was identified and digitised using a zoom window of 0.5 km, refer to figure 02. Around the urban areas, corners of fences, road marking, corners of jetties were the dominant features; however, when moving into the peri-urban and rural areas, roof corners are the only physical features clearly shown on the satellite image. Once the RIPs were identified and digitised, the maps were printed onto an A3 size paper, which were later used in the field as a guide to identify the RIPs, refer to figure 03. Base Station Setup The benchmark were identified to set the base station up and coordinates provided by lands department The benchmarks were chosen over observing the base station points for 24 hours as they are tied into other benchmarks and referenced to a known Figure 03: A 1 km grid drawn on top of the image with datum used by the Lands Department.The base the Identified RIP in red dots station was set up sitting on a levelled position on top of the bench mark during the survey, refer to one was captured and marked on the map. figure 4. It was taken out daily when the survey was Capturing of RIPs completed and restored the following day The RIPs were captured using the RTK GPS. Each Identification of RIPs in the Field RIPs were observed from 7 – 45 minutes depending The Printed map was used as reference to identify on the number of satellites and geometry. The the RIPs on the ground. Having the printed map was observation of the point is longer when satellites in important as it marked which corner of the feature view are not sufficient and the PDOP is high; however to be captured. In some cases the actual RIPs was under good condition when sufficient satellites were difficult to locate, hence other features in the A3 in view and PDOP was low, observation time of a paper was used as reference like the colour of the particular RIP was shortened. houses, road junctions, nearest house to identify Pre-processing the correct RIP. If the RIP was not found, a new Each day the Data was downloaded from the rover using the Trimble Business Centre software and the baseline calculation was applied to correct the image at a sub metre level. This was important to verify the data is captured before the team move to the next area. The data was then exported to MapInfo and exported as DXF readable in ERDAS. The DXF files were imported from ERDAS using the Export/Import function which converts the DXF data into annotation, a readable file in ERDAS format The satellite image was then corrected using the RIPs as a reference and using Polynomial order 2 as the transformation tool to correct the shift in the image. Results At the end of the Survey, one hundred and five RIPs were collected around the island and the satellite image data was corrected to a 1/2 meter shift. Figure 02:Satellite Image and RIPs location Conclusions and Recommendations The collection of RIPs is suitable for rectifying the 18 Pacific Islands GIS & RS NEWS April 2009
- 19. Introduction to Quantum GIS Habitat Mapping of Aitutaki, Cook Islands Issue 1 m resolution (Fig.1). The image was geo-rectified using control points in the lagoon and on the islands (Fig. 2). Radiometric, atmospheric, and geometric corrections were applied to the Quickbird imagery to derive at-surface radiance image data, capable of integration with field survey data. A Garmin hand held GPS contained in a dry bag towed by the habitat mapper was used to collect positional data for the photographs taken during transects (Fig.3). The photos were later georeferenced using Quantum GIS software. A Classification scheme was developed for photo analysis and Coral Point Count (CPCe) was used to classify the photos into different mapping Figure 05: Setting up the base station on a known categories (e.g. coral, algae, sand etc). Areas point of interest (AOI’s) were manually digitised with MAPINFO using the field data and image data as satellite image which resulted in mapping up to 1: a backdrop. Reflectance signatures were extracted 5, 00 scale. The maps could be used for backdrops from the satellite image for the AOI’s, enabling a to update maps of roads, utility assets and houses characteristic “spectral radiance signature” to be etc. defined for benthic community cover types. Mapping The Satellite image could be corrected using the process was performed using the software programs rubber sheeting tool to decrease the error from ARCGIS and ERDAS Imagine, and was adjusted to ½ meter to zero. To have these RIPs as image also perform using MAPINFO and ERDAS Imagine. reference points it is recommended that the base A habitat map of accuracy 60% was produced. station to be observed for 24 hours and baseline recalculated. Habitat Mapping of Aitutaki, Cook Islands By Sharma, A., Kruger, J., Kumar, S., Roelfsema, C., Leiper, I., Phinn, S., George, N. and Story, R. SOPAC needed a benthic habitat map of Aitutaki Reef, Cook Islands to use as a base map to determine the possible impacts of changes in reef hydrodynamics resulting from increasing the size and depth of the major boating channel. A starting point or “baseline” inventory of resources was important in order to provide evidence of change in the ecosystem. Habitat maps are designed to be used to understand and predict moderate depth (~10 - 20m) benthic habitats for different organisms that inhabit coral reef ecosystems, providing a baseline inventory as an important tool in assessing change in coral reef ecosystems and allowing scientists to spatially document the location of corals, percentage of coral cover, and relative overall health of the system. Habitat mapping in Aitutaki was carried out in April, Figure 01: Satellite image of Aitutaki Lagoon. Satellite 2008. The habitat map was created from visual image is a Quickbird image with a 2.4 m resolution interpretation of the Quickbird image with a 2.4 taken in July 2007 19 Pacific Islands GIS & RS NEWS April 2009 19
- 20. SOPAC Establishes Contacts with KOMSAT-2 Figure 02: Reference Image Points around the atoll Figure 04:Benthic habitat map of Aitutaki, Cook Islands. This work was initiated by the Pacific Islands Applied Geoscience Commission (SOPAC) and European Union (EU) Reducing Vulnerability of Pacific ACP States Project in conjunction with consultants from the University of Queensland. In addition to the Habitat maps presented in this report Figure 03:Diver taking benthic photos at regular and their relevance to the SOPAC/EU project, it is intervals and depth. envisaged that data from the survey will be used to support activities in fisheries, mineral exploration, coastal management, and geo-hazard studies. SOPAC Establishes Contacts with KOMSAT-2 SOPAC has in the past had difficulties in acquiring image data from dealers because GeoEye, QuickBird and IKONOS were booked out. SOPAC has established contact with another source of data: KompSat-2, a Korean satellite with similar specifications as IKONOS. Pan: 500 – 900 nm. MS1 (blue): 450 – 520 nm. MS2 (green): 520 – 600 nm. MS3 (red): 630 – 690 nm. MS4 (near-infrared): 760 – 900 nm. Simultaneous acquisition of Pan and MS allow acquisition of pan- sharpened 1-m images. The sensor covers a footprint of 15 km x 15 km. 20 Pacific Islands GIS & RS NEWS April 2009