Italy Vs Albania Euro Cup 2024 Italy's Strategy for Success.docx
Industrial re a4 2010
1. Q4 2010 | INDUSTRIAL
METRO DETROIT & WASHTENAW MARKET
RESEARCH REPORT
Detroit Industrial Market
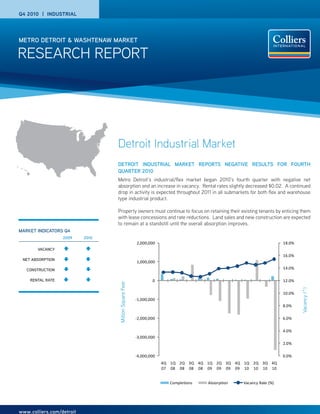
DETROIT INDUSTRIAL MARKET REPORTS NEGATIVE RESULTS FOR FOURTH
QUARTER 2010
Metro Detroit’s industrial/flex market began 2010’s fourth quarter with negative net
absorption and an increase in vacancy. Rental rates slightly decreased $0.02. A continued
drop in activity is expected throughout 2011 in all submarkets for both flex and warehouse
type industrial product.
Property owners must continue to focus on retaining their existing tenants by enticing them
with lease concessions and rate reductions. Land sales and new construction are expected
to remain at a standstill until the overall absorption improves.
MARKET INDICATORS Q4
2009 2010
2,000,000 18.0%
VACANCY
16.0%
NET ABSORPTION
1,000,000
CONSTRUCTION 14.0%
RENTAL RATE 0 12.0%
Million Square Feet
Vacancy (^)
10.0%
-1,000,000
8.0%
-2,000,000 6.0%
4.0%
-3,000,000
2.0%
-4,000,000 0.0%
4Q 1Q 2Q 3Q 4Q 1Q 2Q 3Q 4Q 1Q 2Q 3Q 4Q
07 08 08 08 08 09 09 09 09 10 10 10 10
Completions Absorption Vacancy Rate (%)
www.colliers.com/detroit
2. RESEARCH REPORT | Q4 2010 | INDUSTRIAL | DETROIT
INVENTORY sectors. Rates range as high as $11.95 per
Total industrial inventory in the Detroit market Total industrial inventory amounted to square foot in the Airport I-275 market to as
area amounted to 480,579,732 square feet in 480,579,732 square feet in 9,573 buildings low as $4.89 per square foot in the Detroit
9,573 buildings at the end of the fourth quarter in the fourth quarter 2010. The flex sector submarket. Most of the rental rates range
2010.
consisted of 40,527,644 square feet and the from $7.00 to $9 per square foot; with the
Warehouse/Distribution sector consisted of average settling at $8.17 per square foot in
Fourth quarter reports a negative absorption
compromised of 3,685,375 square feet, with 440,052,088 square feet. the overall market.
the highest absorption this quarter found in
the I-75 corridor submarket. Asking warehouse/distribution rates are
RENTAL RATES
averaging $3.97 per square foot. Effective
This quarter the average overall asking rental rates are usually up to 20% less than
rental rate slightly decreased $0.02 and asking rates, due to concessions and face
currently stands at $4.33 per square foot. rate reductions used as incentives for
tenants to commit to a lease.
R&D and Flex rates are double that of
warehouse & distribution in almost all
submarkets and continue to fluctuate
significantly among the geographic market
continued on page 4
SALES ACTIVITY
PROPERTY ADDRESS CITY SALE DATE SALE PRICE SIZE PRICE PER SF
32000 John R Rd Madison Heights 10/7/2010 4,650,000 95,618 48.63
28000 Dylan Dr Novi 12/20/2010 3,387,000 47,782 70.88
2550 Auburn Ct Auburn Hills 10/22/2010 2,000,000 148,000 13.51
1045 Durant Dr Howell 12/6/2010 1,900,000 112,500 16.89
20189-20201 Northline Rd Taylor 11/24/2010 1,840,000 54,400 33.82
35935 Ecorse Rd Romulus 11/1/2010 1,600,000 43,000 37.21
2329-2333 E Walton Blvd Auburn Hills 10/8/2010 1,165,000 46,600 25
795 S Oakwood Blvd Detroit 10/6/2010 921,000 23,350 39.44
40805 Mound Rd Sterling Heights 10/15/2010 801,000 28,751 27.86
1693 Thunderbird Dr Troy 10/19/2010 800,000 18,875 42.38
19800 Gibraltar Rd Gibraltar 11/30/2010 800,000 67,865 11.79
8000 Ronda Dr Canton 11/2/2010 775,000 47,326 16.38
50500 Mound Rd Shelby Township 10/19/2010 N/A 1,870,480 N/A
LEASE ACTIVITY
BUILDING NAME SUBMARKET TENANT SIZE SF
10401 Harrison Rd Airport District N/A 142,500
8747 Brandt St. Downriver North Ind The Edison Insitute 101,400
2800 Superior Ct. I-75 Corr/N Oak Dokka Fasteners 100180
1350 W Hamlin Rd. I-75 Corr/N Oak Kostal Kontakt Systeme 93,000
36501 Van Born Airport District Penske Logistics 81,608
754 W Maple Troy US Farathane Corp. 78,000
P. 2 | COLLIERS INTERNATIONAL