With brands continuing to book video inventory for the ever engaged online audience we can expect a rise in tailored content and further research into the impact on brand impact. However, its hot on the heels of TV. Take a look!
This research was commission and supplied by Brightroll UK.
HOW TO HANDLE SALES OBJECTIONS | SELLING AND NEGOTIATION
Brightroll UK and EU Digital Video Outlook
1. 2014 2015 2016 2017 2018
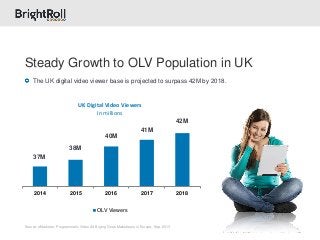
UK Digital Video Viewers
In millions
OLV Viewers
Source: eMarketer, Programmatic Video Ad Buying Goes Mainstream in Europe, Sep. 2013
Steady Growth to OLV Population in UK
42M
41M
40M
38M
37M
The UK digital video viewer base is projected to surpass 42M by 2018.
2. Source: eMarketer Comparative Estimates Nov.
2013
Digital Video Ad Spending Growth in the EU-5
including programmatic (%)
25%
23%
19%
16% 14%
2013 2014 2015 2016 2017
Growth in Digital Video Ad Spend in EU-5
Source: eMarketer, Western Europe Digital Ad Spending, Nov. 2013
€120M
Programmatic Digital Video Ad Spend
in the EU-5
€226M
€369M
€503M
€627
M
2013 2014 2015 2016 2017
3. 0%
5%
10%
15%
20%
25%
30%
35%
40%
45%
2013 2014 2015 2016 2017
Programmatic Video Ad Spending Share in the EU-5
UK France Italy Spain Germany
Source: eMarketer, Programmatic Video Ad Buying Goes Mainstream in Europe, Sep. 2013
Development of Programmatic Video Spend
4. Digital Video Outlook of UK Market
* Videos per video per month.
Source: eMarketer, UK Mobile and Tablet Users: #3 2013 Forecast and Comparative Estimates, Dec. 2013
13B videos viewed in the UK in 2013, with an average of 377 videos per viewer*.
Mobile phone video viewers in the UK are estimated to surpass 25M in 2017.
25% of UK consumers are more likely to react to an ad viewed on a smartphone or tablet.
63%
Completion rate
for pre-roll
videos
59%
Completion rate
for interactive
pre-roll
43%
Of marketers will
increase OLV
budget
65%
Believe OLV is as
effective as TV
for brand
awareness
5. Allocation of Video Ad Budget to Digital Channels
% of respondents
89%
79%
72%
34%
Digital Mobile Tablet Connected TV
UK Advertisers Realise Online Video Potential
52% of UK agencies say half or more of their RFP’s now include digital video
component.
62% of agency executives believe video ads are more effective than display.
Source: eMarketer BrightRoll, Digital Video: 2013 UK Advertising Report
6. Source: eMarketer UK Moblle Phone Video Viewers, Aug. 2013 / Faster Mobile Service Boosts Usage in UK, Jan 2014.
19M users in the UK will watch video on mobile phones at least once per month in 2014.
Mobile phone video viewership in the UK is increasing at a much faster rate than the digital video
audience due to the adoption of faster 4G technology.
Since the switch to 4G, 36% of UK users streamed more mobile video content.
Mobile Video Continues Rise in Viewership
2013 2014 2015 2016 2017
Mobile video viewers 16M 19M 22M 24M 26M
% of mobile users 31% 36% 41% 45% 48%
% of OLV viewers 46.% 51% 57% 61% 64%
% of population 24% 29% 33% 36% 39%
UK Mobile Video Ad Spending Share
7. UK Tablet Users
in millions 2014-2017
25M
28M
32M 35M
2014 2015 2016 2017
Source: eMarketer Comparative Estimates Nov.
2013
As the UK’s smartphone and tablet user base
expands, new consumers will help drive
growth of the mobile video viewing audience.
The UK tablet population is expanding at an even faster pace than the country’s smartphone
audience.
Nearly one out of every two people living in the UK will use a tablet by 2016.
Significant Adoption of Tablet Users in UK
8. 2010 2011 2012 2013 2014
Digital 1:47 2:05 2:35 3:07 3:41
Online 1:32 1:38 1:43 1:48 1:52
Mobile 0:15 0:28 0:52 1:19 1:49
TV 3:20 3:19 3:17 3:16 3:15
Average Time Spent per Day with Major Media
The amount of time spent using digital devices as a whole has more than doubled from 2010 to
2014.
The improvements to mobile technology has enabled and encouraged users of mobile devices to
spend more time using their smartphone, tablets and other data capable devices.
UK Users Spending More Time on Devices
Source: eMarketer, UK Time Spent with Media: The Complete eMarketer Forecast for 2014