SlideShare ist ein Scribd-Unternehmen logo
1 von 38
Using	
  TERN	
  infrastructure	
  to	
  answer	
  
land	
  management	
  ques8ons	
  
capturing	
  near	
  real	
  8me	
  GHG	
  exchange	
  
using	
  flux	
  towers	
  
 Mila	
  Bristow	
  (CDU),	
  Lindsay	
  Hutley	
  (CDU),	
  Jason	
  Beringer	
  
 (Monash),	
  Stephen	
  Livesley	
  (U	
  Melb),	
  Stefan	
  Arndt	
  (U	
  
 Melb),	
  MaMhew	
  Northwood	
  (CDU)	
  
Partner	
  Agencies	
  
Background	
  
Background	
  

 February	
  14,	
  2013	
  12:26PM	
  
North	
  Australian	
  water	
  resources	
  
Land	
  use	
  in	
  Australia	
  today	
  
Landscapes	
  of	
  north	
  Australia	
  	
  
Tropical	
  savanna	
  woodland	
  and	
  open-­‐forests	
  
dominate	
  the	
  north	


Savanna	
  
Landscapes	
  of	
  north	
  Australia	
  climate	
  
North	
  Australian	
  landscapes	
  	
  
Savanna	
  burning	
  –	
  2011	
  fire	
  scars	
  
North	
  Australian	
  Flux	
  Network	
   	
  TERN	
  OzFlux	
  Facility	
  
                                                       Fogg	
  Dam	
  
                                               Howard	
  Springs	
  
            Adelaide	
  River	


  Daly	
  River:	
  Uncleared	


                                                                                        Rainfall	
  gradient	
  
      Dry	
  River	
  

                                        Sturt	
  Plains	


SpaFal	
  paGerns	
  of	
  mass	
  and	
                               UTS	
  managed	
  arid	
  
energy	
  exchange	
                                                   zone	
  tower	
  
North	
  Australian	
  Flux	
  Network	
   	
  TERN	
  OzFlux	
  Facility	
  
Red	
  Dirt	
  Melons	
  Flux	
  Tower
                                     	
       	
  ARC-­‐Linkage	
  project	


  Daly	
  River:	
  Uncleared	


                                                                        Rainfall	
  gradient	
  
     Red	
  Dirt	
  Melons	
  Farm	
  
What	
  is	
  the	
  impact	
  of	
  LUC	
  on	
  
ecosystem	
  GHG	
  exchange?	
  
Tools	
  used:	
  
Eddy	
  covariance	
  (flux	
  tower)	
  system	
  
•  Measures:	
  
   •  energy	
  
   •  ET	
  
   •  CO2	
  fluxes	
  
•  calculate	
  NEE	
  
•  scale	
  up	
  to	
  annual	
  
   sink/source	
  
Tools	
  used:	
  standing	
  biomass	


                   •  Need	
  to	
  know	
  stocks	
  
                      as	
  well	
  as	
  fluxes	
  
                   •  How	
  much	
  biomass	
  
                      in	
  the	
  savanna?	
  
Also	
  non-­‐CO2	
  fluxes,	
  soil	
  C	
  &	
  N	
  stocks	
  
                and	
  process?	
  
                                 •  Temporal	
  and	
  spa8al	
  
                                    sampling	
  of	
  fluxes	
  
                                    CO2	
  and	
  non-­‐CO2	
  and	
  
                                    drivers	
  
                                 •  Replicated	
  cleared	
  
                                    and	
  uncleared	
  plots	
  
                                 •  NO3,	
  NH4	
  pool	
  size	
  
                                    and	
  net	
  nitrifica8on	
  
                                 •  Soil	
  physico-­‐chemical	
  
                                    characteris8cs	
  
How	
  is	
  forest	
  converted	
  to	
  farm	
  land?	
  
Before	
                             ANer	


                                                          Source	
  
NEE	
                                                        	
  
                                                           Sink	


                       Day	
  of	
  year	
  
Clearing	
  site	
  –	
  flux	
  data	
  
                                 60	
  

                                 50	
  

                                 40	
  
NEE	
  (gCO2	
  m-­‐2	
  d-­‐1)	


                                 30	
  

                                 20	
  

                                 10	
  
                                                                                                               Source	
  
                                      0	


                        -­‐10	
  
                                                                                                                Sink	
  
                        -­‐20	
  
                            Aug	
  11	
        Dec	
  11	
     Mar	
  12	
     Jun	
  12	
     Sep	
  12	
  
Clearing	
  site:	
  source/sink	
  dynamics	
  
                                       60	
                                                                                     25	
  

                                       50	
       Wet	
  season	
  
                                                                                                                                20	
  
                                       40	
  
NEE	
  (gCO2	
  m-­‐2	
  d-­‐1)	


                                                                                                                                         Rainfall	
  (mm)	
  
                                       30	
                                                                                     15	
  
                                       20	
  

                                       10	
                                                                                     10	
  
                                                                                         Source	
  
                                          0	
  
                                                                                            	
                                  5	
  
                                      -­‐10	
  
                                                                                          Sink	
  
                                      -­‐20	
                                                                                   0	
  
                                          Aug	
  11	
        Dec	
  11	
     Mar	
  12	
        Jun	
  12	
     Sep	
  12	
  
Clearing	
  site:	
  source/sink	
  dynamics	
  
                                       60	
                                                                                         25	
  
                                                                                          Savanna	
  clearing	
  
                                       50	
  
                                                                                                                                    20	
  
                                       40	
  
NEE	
  (gCO2	
  m-­‐2	
  d-­‐1)	


                                                                                                                                             Rainfall	
  (mm)	
  
                                       30	
                                                                                         15	
  
                                       20	
  

                                       10	
                                                                                         10	
  
                                                                                                         Source	
  
                                          0	
  
                                                                                                            	
                      5	
  
                                      -­‐10	
  
                                                                                                          Sink	
  
                                      -­‐20	
                                                                                       0	
  
                                          Aug	
  11	
     Dec	
  11	
     Mar	
  12	
              Jun	
  12	
      Sep	
  12	
  
Clearing	
  site:	
  source/sink	
  dynamics	
  
                                       60	
                                                                                      25	
  
                                                                                          Dry	
  season	
  
                                       50	
  
                                                                                                                                 20	
  
                                       40	
  
NEE	
  (gCO2	
  m-­‐2	
  d-­‐1)	


                                                                                                                                          Rainfall	
  (mm)	
  
                                       30	
                                                                                      15	
  
                                       20	
  

                                       10	
                                                                                      10	
  
                                                                                                                    Source	
  
                                          0	
  
                                                                                                                       	
        5	
  
                                      -­‐10	
  
                                                                                                                     Sink	
  
                                      -­‐20	
                                                                                    0	
  
                                          Aug	
  11	
     Dec	
  11	
     Mar	
  12	
           Jun	
  12	
     Sep	
  12	
  
Clearing	
  site:	
  source/sink	
  dynamics	
  
                                       60	
                                                                                     25	
  
                                                                                                Fire	
  
                                       50	
  
                                                                                                                                20	
  
                                       40	
  
NEE	
  (gCO2	
  m-­‐2	
  d-­‐1)	


                                                                                                                                         Rainfall	
  (mm)	
  
                                       30	
                                                                                     15	
  
                                       20	
  

                                       10	
                                                                                     10	
  
                                                                                                                           Source	
  
                                          0	
  
                                                                                                                              	
  5	
  
                                      -­‐10	
  
                                                                                                                            Sink	
  
                                      -­‐20	
                                                                                   0	
  
                                          Aug	
  11	
     Dec	
  11	
     Mar	
  12	
     Jun	
  12	
      Sep	
  12	
  
Clearing	
  site:	
  source/sink	
  dynamics	
  
                                       60	
                                                                                    25	
  

                                       50	
  
                                                                                                                               20	
  
                                       40	
  
NEE	
  (gCO2	
  m-­‐2	
  d-­‐1)	


                                                                                                                                        Rainfall	
  (mm)	
  
                                       30	
                                                                                    15	
  
                                       20	
  

                                       10	
                                                                                    10	
  
                                                                                                                          Source	
  
                                          0	
  
                                                                                                                             	
  5	
  
                                      -­‐10	
  
                                                                                                                           Sink	
  
                                      -­‐20	
                                                                                  0	
  
                                          Aug	
  11	
     Dec	
  11	
     Mar	
  12	
     Jun	
  12	
     Sep	
  12	
  
Uncleared	
  +	
  Clearing	
  site	
  
                                             savanna	
  
                                             clearing	
                           >4	
  tC	
  ha-­‐1	
  
NEE	
  (mg	
  CO2	
  m-­‐2	
  s-­‐1)	


                                                                    Cleared	
  site	
  

                                                                                                                      Source	


                                                                                                                       Sink	
  

                                                  Uncleared	
  site	
  
                                                                                                           Fire	
  

                                                            Week	
  of	
  the	
  year	
  
GHG	
  emissions	
  from	
  burning	
  debris	
  
•  Fuel	
  curing	
  over	
  dry	
        •  Assump8ons	
  
   season	
  2012	
                            •    all	
  AGB	
  consumed	
  
•  Burning	
  late	
  dry	
  season	
          •    90%	
  of	
  BGB	
  consumed	
  
   to	
  maximise	
                            •    Fine	
  roots	
  ignored,	
  no	
  
   consump8on	
  for	
  site	
                      soil	
  C	
  loss,	
  no	
  CWD	
  
   prepara8on	
  to	
  melons	
                     included,	
  no	
  decay	
  of	
  
                                                    coarse	
  roots	
  	
  
•  Emissions	
  es8mated	
  
   for	
  fire	
  event	
  using	
  
   NCAS	
  default	
  emissions	
  
   factors	
  
Post-­‐clearing	
  fire	
  
                        GHG	
  emissions	
  t	
  CO2-­‐e	


                        92.3	
       3.8	
   1.2	


Post	
  clearing	
  debris	
  
                         CO2	
       CH4	
   N2O	
  
The	
  site	
  today	


  Final	
  stage:	


agricultural	
  land	
  
CO2	
  from	
  clearing:	
  comparing	
  cleared	
  
              and	
  uncleared	
  tower	
  sites	
  
•  Equivalent	
  to	
  31.4	
  t	
  C	
  ha-­‐1	
  (or	
  115.4	
  t	
  CO2-­‐e	
  ha-­‐1)	
  
•  equivalent	
  to	
  12	
  years	
  of	
  carbon	
  sequestra8on	
  
Soil	
  CH4	
  and	
  N2O	
  fluxes	
  
                                                         Methane	
  Flux	
  

                                      14	
                                                                   Cleared	
  savanna	
  
                                      12	
  
                                                                                                             Savanna	
  woodland	
  
                                      10	
  
ug	
  CH4-­‐C	
  m-­‐2	
  h-­‐1	


                                         8	
  
                                         6	
  
                                         4	
  
                                         2	
  
                                         0	
  
                                      -­‐2	
  
                                      -­‐4	
  
                                      -­‐6	
  
                                         Oct	
  11	
      Dec	
  11	
     Feb	
  12	
     Mar	
  12	
     May	
  12	
     Jul	
  12	
  
Soil	
  CH4	
  and	
  N2O	
  fluxes	
  
                                                         Methane	
  Flux	
  +	
  rainfall	
  

                                      14	
                                                                  Cleared	
  savanna	
         25	
  
                                      12	
                                                                  Savanna	
  woodland	
  
                                      10	
                                                                  rainfall	
                   20	
  
ug	
  CH4-­‐C	
  m-­‐2	
  h-­‐1	


                                         8	
  
                                         6	
                                                                                             15	
  
                                         4	
  
                                         2	
                                                                                             10	
  
                                         0	
  
                                      -­‐2	
                                                                                             5	
  
                                      -­‐4	
  
                                      -­‐6	
                                                                                             0	
  
                                         Oct	
  11	
     Dec	
  11	
     Feb	
  12	
     Mar	
  12	
     May	
  12	
     Jul	
  12	
  
Soil	
  CH4	
  and	
  N2O	
  fluxes	
  
                                                                         Nitrous	
  Oxide	
  Flux	
  
                                                      25	
  
                                                                                                                                 Cleared	
  savanna	
  
N2O	
  flux	
  (ug	
  N2O-­‐N	
  m-­‐2	
  h-­‐1)	


                                                      20	
  
                                                                                                                                 Savanna	
  woodland	
  
                                                      15	
  

                                                      10	
  

                                                        5	
  

                                                        0	
  

                                                      -­‐5	
  
                                                         Oct	
  11	
      Dec	
  11	
     Feb	
  12	
     Mar	
  12	
     May	
  12	
     Jul	
  12	
  
Soil	
  CH4	
  and	
  N2O	
  fluxes	
  
                                                                 Nitrous	
  Oxide	
  Flux	
  +	
  rainfall	
  
                                                                                                                        Cleared	
  savanna	
  
                                                      25	
                                                                                 25	
  
N2O	
  flux	
  (ug	
  N2O-­‐N	
  m-­‐2	
  h-­‐1)	
  

                                                                                                                        Savanna	
  woodland	
  
                                                                                                                        rainfall	
  
                                                      20	
                                                                                       20	
  
                                                      15	
  
                                                                                                                                                 15	
  
                                                      10	
  
                                                                                                                                                 10	
  
                                                        5	
  

                                                        0	
                                                                                      5	
  

                                                      -­‐5	
                                                                                     0	
  
                                                         Oct	
  11	
   Dec	
  11	
   Feb	
  12	
   Mar	
  12	
   May	
  12	
   Jul	
  12	
  
Savanna	
  ecosystems	
  are	
  a	
  major	
  exchange	
  of	
  global	
  GHG	
  
Flux	
  towers	
  cri8cal	
  tool	
  to	
  understand	
  ecosystem	
  change....	
  
to	
  this....	
  
to	
  this...	
  
Thanks…	
  ques8ons???	
  
We	
  would	
  like	
  to	
  thank	
  our	
  research	
  partners	
  Red	
  Dirt	
  
Melon	
  Farm,	
  this	
  is	
  an	
  ARC-­‐Linkage	
  funded	
  project	
  

  Mila	
  Bristow	
  (CDU),	
  Lindsay	
  Hutley	
  (CDU),	
  Jason	
  Beringer	
  
  (Monash),	
  Stephen	
  Livesley	
  (U	
  Melb),	
  Stefan	
  Arndt	
  (U	
  
  Melb),	
  MaMhew	
  Northwood	
  (CDU)	
  

Weitere ähnliche Inhalte

Ähnlich wie Mila Bristow_What is the impact of land use change on greenhouse gas exchange in tropical savannas?

Gulf Coast Carbon Center - Research on Geologic CO2 Storage - Ian Duncan - Gl...
Gulf Coast Carbon Center - Research on Geologic CO2 Storage - Ian Duncan - Gl...Gulf Coast Carbon Center - Research on Geologic CO2 Storage - Ian Duncan - Gl...
Gulf Coast Carbon Center - Research on Geologic CO2 Storage - Ian Duncan - Gl...Global CCS Institute
 
Water resources and biofuels water quality april 2012
Water resources and biofuels water quality   april 2012Water resources and biofuels water quality   april 2012
Water resources and biofuels water quality april 2012Sharon Lezberg
 
Aberson Ecsa Meeting April 2009
Aberson Ecsa Meeting April 2009Aberson Ecsa Meeting April 2009
Aberson Ecsa Meeting April 2009mypie17881
 
Relationship of the environmental risk and surface energy budget over the Tib...
Relationship of the environmental risk and surface energy budget over the Tib...Relationship of the environmental risk and surface energy budget over the Tib...
Relationship of the environmental risk and surface energy budget over the Tib...Global Risk Forum GRFDavos
 

Ähnlich wie Mila Bristow_What is the impact of land use change on greenhouse gas exchange in tropical savannas? (6)

Clad oct09 pchapman
Clad oct09 pchapmanClad oct09 pchapman
Clad oct09 pchapman
 
Gulf Coast Carbon Center - Research on Geologic CO2 Storage - Ian Duncan - Gl...
Gulf Coast Carbon Center - Research on Geologic CO2 Storage - Ian Duncan - Gl...Gulf Coast Carbon Center - Research on Geologic CO2 Storage - Ian Duncan - Gl...
Gulf Coast Carbon Center - Research on Geologic CO2 Storage - Ian Duncan - Gl...
 
Water resources and biofuels water quality april 2012
Water resources and biofuels water quality   april 2012Water resources and biofuels water quality   april 2012
Water resources and biofuels water quality april 2012
 
Distributed modelling simplified hydrological process models for humid areas
Distributed modelling simplified hydrological process models for humid areas Distributed modelling simplified hydrological process models for humid areas
Distributed modelling simplified hydrological process models for humid areas
 
Aberson Ecsa Meeting April 2009
Aberson Ecsa Meeting April 2009Aberson Ecsa Meeting April 2009
Aberson Ecsa Meeting April 2009
 
Relationship of the environmental risk and surface energy budget over the Tib...
Relationship of the environmental risk and surface energy budget over the Tib...Relationship of the environmental risk and surface energy budget over the Tib...
Relationship of the environmental risk and surface energy budget over the Tib...
 

Mehr von TERN Australia

Careers Grounded in Soils
Careers Grounded in SoilsCareers Grounded in Soils
Careers Grounded in SoilsTERN Australia
 
TERN Australia Soil & Herbarium Collection Brochure
TERN Australia Soil & Herbarium Collection BrochureTERN Australia Soil & Herbarium Collection Brochure
TERN Australia Soil & Herbarium Collection BrochureTERN Australia
 
Summary of TERN monitoring plots in the Pilbara WA, Apr2015 - Jun2021
Summary of TERN monitoring plots in the Pilbara WA, Apr2015 - Jun2021Summary of TERN monitoring plots in the Pilbara WA, Apr2015 - Jun2021
Summary of TERN monitoring plots in the Pilbara WA, Apr2015 - Jun2021TERN Australia
 
Summary of TERN plots on Kangaroo Island, SA, Oct 2018 - Oct 2021
Summary of TERN plots on Kangaroo Island, SA, Oct 2018 - Oct 2021Summary of TERN plots on Kangaroo Island, SA, Oct 2018 - Oct 2021
Summary of TERN plots on Kangaroo Island, SA, Oct 2018 - Oct 2021TERN Australia
 
MER Pilot Network flyer 2020
MER Pilot Network flyer 2020MER Pilot Network flyer 2020
MER Pilot Network flyer 2020TERN Australia
 
Australia's Environmental Predictive Capability
Australia's Environmental Predictive CapabilityAustralia's Environmental Predictive Capability
Australia's Environmental Predictive CapabilityTERN Australia
 
Biodiversity Management in Tasmania's Temperate Native Forests
Biodiversity Management in Tasmania's Temperate Native ForestsBiodiversity Management in Tasmania's Temperate Native Forests
Biodiversity Management in Tasmania's Temperate Native ForestsTERN Australia
 
Observing Environmental Change in Australia: Conversations for Sustainability
Observing Environmental Change in Australia: Conversations for SustainabilityObserving Environmental Change in Australia: Conversations for Sustainability
Observing Environmental Change in Australia: Conversations for SustainabilityTERN Australia
 
Dr Michael Mirtl (ILTER Chair) presenting at the AusLTER Forum 2018
Dr Michael Mirtl  (ILTER Chair) presenting at the AusLTER Forum 2018Dr Michael Mirtl  (ILTER Chair) presenting at the AusLTER Forum 2018
Dr Michael Mirtl (ILTER Chair) presenting at the AusLTER Forum 2018TERN Australia
 
Prof Bob Scholes (Wits University, South Africa) presenting at the AusLTER Fo...
Prof Bob Scholes (Wits University, South Africa) presenting at the AusLTER Fo...Prof Bob Scholes (Wits University, South Africa) presenting at the AusLTER Fo...
Prof Bob Scholes (Wits University, South Africa) presenting at the AusLTER Fo...TERN Australia
 
Prof Phil Robertson (Michigan State University, USA) presenting at the AusLTE...
Prof Phil Robertson (Michigan State University, USA) presenting at the AusLTE...Prof Phil Robertson (Michigan State University, USA) presenting at the AusLTE...
Prof Phil Robertson (Michigan State University, USA) presenting at the AusLTE...TERN Australia
 
Dr Manuel Maass (National Autonomous University of Mexico) presenting at the ...
Dr Manuel Maass (National Autonomous University of Mexico) presenting at the ...Dr Manuel Maass (National Autonomous University of Mexico) presenting at the ...
Dr Manuel Maass (National Autonomous University of Mexico) presenting at the ...TERN Australia
 
Yuxia Liu Phenology 2018 poster on tracking grass phenology
Yuxia Liu Phenology 2018 poster on tracking grass phenologyYuxia Liu Phenology 2018 poster on tracking grass phenology
Yuxia Liu Phenology 2018 poster on tracking grass phenologyTERN Australia
 
Qiaoyun Xie Phenology 2018 presentation on agricultural phenology
Qiaoyun Xie Phenology 2018 presentation on agricultural phenologyQiaoyun Xie Phenology 2018 presentation on agricultural phenology
Qiaoyun Xie Phenology 2018 presentation on agricultural phenologyTERN Australia
 
Ha Nguyen Phenology 2018 presentation on Melbourne pollen trends
Ha Nguyen Phenology 2018 presentation on Melbourne pollen trendsHa Nguyen Phenology 2018 presentation on Melbourne pollen trends
Ha Nguyen Phenology 2018 presentation on Melbourne pollen trendsTERN Australia
 
Paul Beggs Phenology 2018 presentation on AusPollen
Paul Beggs Phenology 2018 presentation on AusPollenPaul Beggs Phenology 2018 presentation on AusPollen
Paul Beggs Phenology 2018 presentation on AusPollenTERN Australia
 
GEOSS Ecosystem Mapping for Australia
GEOSS Ecosystem Mapping for AustraliaGEOSS Ecosystem Mapping for Australia
GEOSS Ecosystem Mapping for AustraliaTERN Australia
 
TERN Ecosystem Surveillance Plots Roy Hill Station
TERN Ecosystem Surveillance Plots Roy Hill StationTERN Ecosystem Surveillance Plots Roy Hill Station
TERN Ecosystem Surveillance Plots Roy Hill StationTERN Australia
 
TERN Ecosystem Surveillance Plots Kakadu National Park
TERN Ecosystem Surveillance Plots Kakadu National ParkTERN Ecosystem Surveillance Plots Kakadu National Park
TERN Ecosystem Surveillance Plots Kakadu National ParkTERN Australia
 

Mehr von TERN Australia (20)

Careers Grounded in Soils
Careers Grounded in SoilsCareers Grounded in Soils
Careers Grounded in Soils
 
TERN Australia Soil & Herbarium Collection Brochure
TERN Australia Soil & Herbarium Collection BrochureTERN Australia Soil & Herbarium Collection Brochure
TERN Australia Soil & Herbarium Collection Brochure
 
Summary of TERN monitoring plots in the Pilbara WA, Apr2015 - Jun2021
Summary of TERN monitoring plots in the Pilbara WA, Apr2015 - Jun2021Summary of TERN monitoring plots in the Pilbara WA, Apr2015 - Jun2021
Summary of TERN monitoring plots in the Pilbara WA, Apr2015 - Jun2021
 
Summary of TERN plots on Kangaroo Island, SA, Oct 2018 - Oct 2021
Summary of TERN plots on Kangaroo Island, SA, Oct 2018 - Oct 2021Summary of TERN plots on Kangaroo Island, SA, Oct 2018 - Oct 2021
Summary of TERN plots on Kangaroo Island, SA, Oct 2018 - Oct 2021
 
MER Pilot Network flyer 2020
MER Pilot Network flyer 2020MER Pilot Network flyer 2020
MER Pilot Network flyer 2020
 
Australia's Environmental Predictive Capability
Australia's Environmental Predictive CapabilityAustralia's Environmental Predictive Capability
Australia's Environmental Predictive Capability
 
Biodiversity Management in Tasmania's Temperate Native Forests
Biodiversity Management in Tasmania's Temperate Native ForestsBiodiversity Management in Tasmania's Temperate Native Forests
Biodiversity Management in Tasmania's Temperate Native Forests
 
Observing Environmental Change in Australia: Conversations for Sustainability
Observing Environmental Change in Australia: Conversations for SustainabilityObserving Environmental Change in Australia: Conversations for Sustainability
Observing Environmental Change in Australia: Conversations for Sustainability
 
Observing Environmental Change in Australia: Conversations for Sustainability
Observing Environmental Change in Australia: Conversations for SustainabilityObserving Environmental Change in Australia: Conversations for Sustainability
Observing Environmental Change in Australia: Conversations for Sustainability
 
Dr Michael Mirtl (ILTER Chair) presenting at the AusLTER Forum 2018
Dr Michael Mirtl  (ILTER Chair) presenting at the AusLTER Forum 2018Dr Michael Mirtl  (ILTER Chair) presenting at the AusLTER Forum 2018
Dr Michael Mirtl (ILTER Chair) presenting at the AusLTER Forum 2018
 
Prof Bob Scholes (Wits University, South Africa) presenting at the AusLTER Fo...
Prof Bob Scholes (Wits University, South Africa) presenting at the AusLTER Fo...Prof Bob Scholes (Wits University, South Africa) presenting at the AusLTER Fo...
Prof Bob Scholes (Wits University, South Africa) presenting at the AusLTER Fo...
 
Prof Phil Robertson (Michigan State University, USA) presenting at the AusLTE...
Prof Phil Robertson (Michigan State University, USA) presenting at the AusLTE...Prof Phil Robertson (Michigan State University, USA) presenting at the AusLTE...
Prof Phil Robertson (Michigan State University, USA) presenting at the AusLTE...
 
Dr Manuel Maass (National Autonomous University of Mexico) presenting at the ...
Dr Manuel Maass (National Autonomous University of Mexico) presenting at the ...Dr Manuel Maass (National Autonomous University of Mexico) presenting at the ...
Dr Manuel Maass (National Autonomous University of Mexico) presenting at the ...
 
Yuxia Liu Phenology 2018 poster on tracking grass phenology
Yuxia Liu Phenology 2018 poster on tracking grass phenologyYuxia Liu Phenology 2018 poster on tracking grass phenology
Yuxia Liu Phenology 2018 poster on tracking grass phenology
 
Qiaoyun Xie Phenology 2018 presentation on agricultural phenology
Qiaoyun Xie Phenology 2018 presentation on agricultural phenologyQiaoyun Xie Phenology 2018 presentation on agricultural phenology
Qiaoyun Xie Phenology 2018 presentation on agricultural phenology
 
Ha Nguyen Phenology 2018 presentation on Melbourne pollen trends
Ha Nguyen Phenology 2018 presentation on Melbourne pollen trendsHa Nguyen Phenology 2018 presentation on Melbourne pollen trends
Ha Nguyen Phenology 2018 presentation on Melbourne pollen trends
 
Paul Beggs Phenology 2018 presentation on AusPollen
Paul Beggs Phenology 2018 presentation on AusPollenPaul Beggs Phenology 2018 presentation on AusPollen
Paul Beggs Phenology 2018 presentation on AusPollen
 
GEOSS Ecosystem Mapping for Australia
GEOSS Ecosystem Mapping for AustraliaGEOSS Ecosystem Mapping for Australia
GEOSS Ecosystem Mapping for Australia
 
TERN Ecosystem Surveillance Plots Roy Hill Station
TERN Ecosystem Surveillance Plots Roy Hill StationTERN Ecosystem Surveillance Plots Roy Hill Station
TERN Ecosystem Surveillance Plots Roy Hill Station
 
TERN Ecosystem Surveillance Plots Kakadu National Park
TERN Ecosystem Surveillance Plots Kakadu National ParkTERN Ecosystem Surveillance Plots Kakadu National Park
TERN Ecosystem Surveillance Plots Kakadu National Park
 

Mila Bristow_What is the impact of land use change on greenhouse gas exchange in tropical savannas?

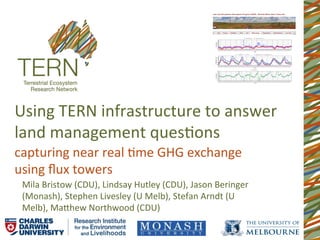
  • 1. Using  TERN  infrastructure  to  answer   land  management  ques8ons   capturing  near  real  8me  GHG  exchange   using  flux  towers   Mila  Bristow  (CDU),  Lindsay  Hutley  (CDU),  Jason  Beringer   (Monash),  Stephen  Livesley  (U  Melb),  Stefan  Arndt  (U   Melb),  MaMhew  Northwood  (CDU)  
  • 4. Background   February  14,  2013  12:26PM  
  • 5. North  Australian  water  resources  
  • 6. Land  use  in  Australia  today  
  • 7. Landscapes  of  north  Australia     Tropical  savanna  woodland  and  open-­‐forests   dominate  the  north    
  • 9. Landscapes  of  north  Australia  climate  
  • 10. North  Australian  landscapes     Savanna  burning  –  2011  fire  scars  
  • 11. North  Australian  Flux  Network    TERN  OzFlux  Facility   Fogg  Dam   Howard  Springs   Adelaide  River   Daly  River:  Uncleared   Rainfall  gradient   Dry  River   Sturt  Plains   SpaFal  paGerns  of  mass  and   UTS  managed  arid   energy  exchange   zone  tower  
  • 12. North  Australian  Flux  Network    TERN  OzFlux  Facility   Red  Dirt  Melons  Flux  Tower    ARC-­‐Linkage  project   Daly  River:  Uncleared   Rainfall  gradient   Red  Dirt  Melons  Farm  
  • 13. What  is  the  impact  of  LUC  on   ecosystem  GHG  exchange?  
  • 14. Tools  used:   Eddy  covariance  (flux  tower)  system   •  Measures:   •  energy   •  ET   •  CO2  fluxes   •  calculate  NEE   •  scale  up  to  annual   sink/source  
  • 15. Tools  used:  standing  biomass   •  Need  to  know  stocks   as  well  as  fluxes   •  How  much  biomass   in  the  savanna?  
  • 16. Also  non-­‐CO2  fluxes,  soil  C  &  N  stocks   and  process?   •  Temporal  and  spa8al   sampling  of  fluxes   CO2  and  non-­‐CO2  and   drivers   •  Replicated  cleared   and  uncleared  plots   •  NO3,  NH4  pool  size   and  net  nitrifica8on   •  Soil  physico-­‐chemical   characteris8cs  
  • 17. How  is  forest  converted  to  farm  land?  
  • 18.
  • 19. Before   ANer   Source   NEE     Sink   Day  of  year  
  • 20. Clearing  site  –  flux  data   60   50   40   NEE  (gCO2  m-­‐2  d-­‐1)   30   20   10   Source   0     -­‐10   Sink   -­‐20   Aug  11   Dec  11   Mar  12   Jun  12   Sep  12  
  • 21. Clearing  site:  source/sink  dynamics   60   25   50   Wet  season   20   40   NEE  (gCO2  m-­‐2  d-­‐1)   Rainfall  (mm)   30   15   20   10   10   Source   0     5   -­‐10   Sink   -­‐20   0   Aug  11   Dec  11   Mar  12   Jun  12   Sep  12  
  • 22. Clearing  site:  source/sink  dynamics   60   25   Savanna  clearing   50   20   40   NEE  (gCO2  m-­‐2  d-­‐1)   Rainfall  (mm)   30   15   20   10   10   Source   0     5   -­‐10   Sink   -­‐20   0   Aug  11   Dec  11   Mar  12   Jun  12   Sep  12  
  • 23. Clearing  site:  source/sink  dynamics   60   25   Dry  season   50   20   40   NEE  (gCO2  m-­‐2  d-­‐1)   Rainfall  (mm)   30   15   20   10   10   Source   0     5   -­‐10   Sink   -­‐20   0   Aug  11   Dec  11   Mar  12   Jun  12   Sep  12  
  • 24. Clearing  site:  source/sink  dynamics   60   25   Fire   50   20   40   NEE  (gCO2  m-­‐2  d-­‐1)   Rainfall  (mm)   30   15   20   10   10   Source   0    5   -­‐10   Sink   -­‐20   0   Aug  11   Dec  11   Mar  12   Jun  12   Sep  12  
  • 25. Clearing  site:  source/sink  dynamics   60   25   50   20   40   NEE  (gCO2  m-­‐2  d-­‐1)   Rainfall  (mm)   30   15   20   10   10   Source   0    5   -­‐10   Sink   -­‐20   0   Aug  11   Dec  11   Mar  12   Jun  12   Sep  12  
  • 26. Uncleared  +  Clearing  site   savanna   clearing   >4  tC  ha-­‐1   NEE  (mg  CO2  m-­‐2  s-­‐1)   Cleared  site   Source     Sink   Uncleared  site   Fire   Week  of  the  year  
  • 27. GHG  emissions  from  burning  debris   •  Fuel  curing  over  dry   •  Assump8ons   season  2012   •  all  AGB  consumed   •  Burning  late  dry  season   •  90%  of  BGB  consumed   to  maximise   •  Fine  roots  ignored,  no   consump8on  for  site   soil  C  loss,  no  CWD   prepara8on  to  melons   included,  no  decay  of   coarse  roots     •  Emissions  es8mated   for  fire  event  using   NCAS  default  emissions   factors  
  • 28. Post-­‐clearing  fire   GHG  emissions  t  CO2-­‐e   92.3   3.8   1.2   Post  clearing  debris   CO2   CH4   N2O  
  • 29. The  site  today   Final  stage:     agricultural  land  
  • 30. CO2  from  clearing:  comparing  cleared   and  uncleared  tower  sites   •  Equivalent  to  31.4  t  C  ha-­‐1  (or  115.4  t  CO2-­‐e  ha-­‐1)   •  equivalent  to  12  years  of  carbon  sequestra8on  
  • 31. Soil  CH4  and  N2O  fluxes   Methane  Flux   14   Cleared  savanna   12   Savanna  woodland   10   ug  CH4-­‐C  m-­‐2  h-­‐1   8   6   4   2   0   -­‐2   -­‐4   -­‐6   Oct  11   Dec  11   Feb  12   Mar  12   May  12   Jul  12  
  • 32. Soil  CH4  and  N2O  fluxes   Methane  Flux  +  rainfall   14   Cleared  savanna   25   12   Savanna  woodland   10   rainfall   20   ug  CH4-­‐C  m-­‐2  h-­‐1   8   6   15   4   2   10   0   -­‐2   5   -­‐4   -­‐6   0   Oct  11   Dec  11   Feb  12   Mar  12   May  12   Jul  12  
  • 33. Soil  CH4  and  N2O  fluxes   Nitrous  Oxide  Flux   25   Cleared  savanna   N2O  flux  (ug  N2O-­‐N  m-­‐2  h-­‐1)   20   Savanna  woodland   15   10   5   0   -­‐5   Oct  11   Dec  11   Feb  12   Mar  12   May  12   Jul  12  
  • 34. Soil  CH4  and  N2O  fluxes   Nitrous  Oxide  Flux  +  rainfall   Cleared  savanna   25   25   N2O  flux  (ug  N2O-­‐N  m-­‐2  h-­‐1)   Savanna  woodland   rainfall   20   20   15   15   10   10   5   0   5   -­‐5   0   Oct  11   Dec  11   Feb  12   Mar  12   May  12   Jul  12  
  • 35. Savanna  ecosystems  are  a  major  exchange  of  global  GHG   Flux  towers  cri8cal  tool  to  understand  ecosystem  change....  
  • 38. Thanks…  ques8ons???   We  would  like  to  thank  our  research  partners  Red  Dirt   Melon  Farm,  this  is  an  ARC-­‐Linkage  funded  project   Mila  Bristow  (CDU),  Lindsay  Hutley  (CDU),  Jason  Beringer   (Monash),  Stephen  Livesley  (U  Melb),  Stefan  Arndt  (U   Melb),  MaMhew  Northwood  (CDU)