Purchasing Managers' Index - September 3, 2012
•
0 gefällt mir•319 views

Purchasing Managers' Index - September 3, 2012: PMI drops to 45.1 in August – a significant weakening of the industrial economy

Empfohlen
Empfohlen
Weitere ähnliche Inhalte
Andere mochten auch
Andere mochten auch (9)
Ähnlich wie Purchasing Managers' Index - September 3, 2012
Ähnlich wie Purchasing Managers' Index - September 3, 2012 (20)
Mehr von Swedbank
Mehr von Swedbank (20)
Kürzlich hochgeladen
Kürzlich hochgeladen (20)
Purchasing Managers' Index - September 3, 2012
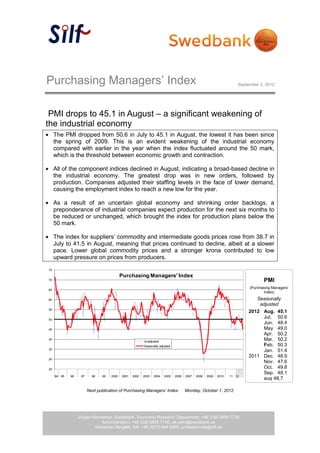
- 1. Purchasing Managers’ Index September 3, 2012 PMI drops to 45.1 in August – a significant weakening of the industrial economy The PMI dropped from 50.6 in July to 45.1 in August, the lowest it has been since the spring of 2009. This is an evident weakening of the industrial economy compared with earlier in the year when the index fluctuated around the 50 mark, which is the threshold between economic growth and contraction. All of the component indices declined in August, indicating a broad-based decline in the industrial economy. The greatest drop was in new orders, followed by production. Companies adjusted their staffing levels in the face of lower demand, causing the employment index to reach a new low for the year. As a result of an uncertain global economy and shrinking order backlogs, a preponderance of industrial companies expect production for the next six months to be reduced or unchanged, which brought the index for production plans below the 50 mark. The index for suppliers’ commodity and intermediate goods prices rose from 38.7 in July to 41.5 in August, meaning that prices continued to decline, albeit at a slower pace. Lower global commodity prices and a stronger krona contributed to low upward pressure on prices from producers. 75 Purchasing Managers' Index 70 PMI (Purchasing Managers’ 65 Index) 60 Seasonally adjusted 55 2012 Aug. 45.1 50 Jul. 50.6 Jun. 48.4 45 May 49.0 Apr. 50.2 40 Unadjusted Mar. 50.2 Seasonally adjusted Feb. 50.3 35 Jan. 51.4 2011 Dec. 48.9 30 Nov. 47.6 25 Oct. 49.8 Sep. 48.1 94 95 96 97 98 99 2000 2001 2002 2003 2004 2005 2006 2007 2008 2009 2010 11 12 aug 48,7 jul 50,1 Next publication of Purchasing Managers’ Index: Monday, October 1, 2012 Jörgen Kennemar, Swedbank, Economic Research Department, +46 (0)8-5859 7730 Administration, +46 (0)8-5859 7740, ek.sekr@swedbank.se Sebastian Bergfelt, Silf, +46 (0)73-944 6450, professionals@silf.se 1 (4)
- 2. Silf/Swedbanks’ Purchasing Managers’ Index. seasonally adjusted PMI Components of PMI Other indices Forecast Total New Produc- Employ- Delivery Export Domestic Back-log Planned Index orders tion ment times Inventories orders orders of orders Prices Import Production 2009 May 43.7 46.4 47.4 31.1 34.2 33.5 47.5 44.1 42.8 32.7 41.0 47.3 Jun 50.5 54.7 55.8 36.0 42.4 34.0 54.4 49.2 47.4 43.3 47.3 55.2 Jul 54.3 60.5 61.0 40.3 44.4 38.4 56.4 58.1 54.1 46.9 51.0 59.1 Aug 52.4 57.8 56.1 40.6 46.4 40.4 61.1 50.1 54.3 52.6 50.7 61.7 Sep 55.9 59.2 60.5 45.0 53.7 40.6 61.1 55.0 54.0 54.5 55.7 63.3 Oct 56.7 60.8 61.7 43.8 56.2 41.6 60.7 55.8 58.9 56.7 55.8 62.2 Nov 56.0 57.9 59.0 48.7 55.0 41.3 59.7 53.6 53.6 59.8 57.0 62.2 Dec 58.2 63.7 59.7 49.5 56.3 42.7 58.1 66.3 56.6 57.3 59.0 67.4 2010 Jan 61.7 66.8 70.2 49.6 61.5 48.3 62.3 64.8 62.6 61.2 61.3 69.5 Feb 61.5 67.5 65.3 55.0 61.4 53.6 62.7 63.6 64.2 61.3 59.7 68.1 Mar 61.1 63.8 63.7 54.9 67.0 50.2 62.3 58.9 60.6 65.7 62.3 69.6 Apr 64.0 68.1 66.3 56.6 68.3 46.0 64.6 63.2 62.5 75.6 60.3 77.5 May 66.0 68.8 71.0 60.1 71.5 50.7 62.6 64.1 64.3 71.0 59.9 73.0 Jun 62.4 61.1 66.8 60.3 69.2 50.4 57.4 60.1 60.9 71.1 59.5 73.1 Jul 64.2 67.3 72.2 56.3 66.4 51.4 61.4 63.2 63.4 70.9 60.9 72.0 Aug 60.6 61.8 61.9 60.5 64.5 52.0 57.4 58.7 59.7 68.5 56.1 72.4 Sep 63.3 65.8 67.4 60.3 66.3 52.9 61.4 62.9 62.2 71.1 58.6 70.8 Oct 61.8 63.0 63.5 59.0 66.8 47.9 61.6 58.2 61.7 66.4 59.3 72.4 Nov 61.3 60.4 64.2 60.2 67.2 50.2 58.9 56.3 58.2 70.8 61.4 72.5 Dec 60.2 63.6 62.8 57.1 64.5 55.5 60.5 63.6 59.5 71.9 59.7 74.0 2011 Jan 61.5 64.2 64.9 57.7 64.6 51.9 61.9 62.1 60.2 77.1 58.6 70.9 Feb 60.9 59.5 65.0 61.1 67.2 54.4 58.8 56.3 58.0 77.1 60.2 71.0 Mar 58.6 56.1 61.4 58.3 66.0 52.0 54.7 54.0 54.3 73.8 58.9 71.6 Apr 59.8 61.5 61.9 57.7 65.1 54.6 58.3 56.9 57.3 74.5 58.5 70.5 May 56.1 55.4 59.8 54.4 61.0 55.6 52.8 56.4 55.3 63.5 56.2 69.1 Jun 52.9 52.3 54.0 51.3 58.1 51.4 52.5 48.8 51.0 60.5 52.2 64.5 Jul 50.1 45.4 49.4 53.7 55.4 50.1 46.9 43.4 49.1 51.5 50.4 63.1 Aug 48.7 47.0 48.6 50.9 49.1 51.5 48.0 42.3 47.9 47.4 48.5 55.8 Sep 48.1 46.5 48.9 50.0 47.5 52.0 48.3 46.2 47.0 47.0 45.8 53.8 Oct 49.8 50.5 48.2 50.7 47.8 47.1 48.9 49.1 48.9 39.9 46.8 53.6 Nov 47.6 47.1 46.2 48.3 45.6 46.0 47.5 46.1 45.1 42.6 44.5 51.6 Dec 48.9 47.0 49.2 49.5 49.9 48.3 48.7 45.1 46.4 42.6 46.5 59.3 2012 Jan 51.4 52.0 52.9 48.0 51.0 47.0 49.9 49.0 50.6 50.3 50.3 56.2 Feb 50.3 49.5 51.9 48.3 52.6 51.2 48.7 48.5 48.0 52.5 50.6 57.7 Mar 50.2 50.5 48.6 49.5 49.3 43.7 50.1 48.6 48.6 55.3 47.9 56.5 Apr 50.2 51.2 51.2 46.7 49.3 46.3 52.3 48.3 52.7 52.3 48.6 55.0 May 49.0 49.2 51.2 46.3 46.9 47.9 51.1 44.9 47.0 45.8 46.5 54.5 Jun 48.4 46.4 50.9 46.7 46.8 46.0 50.3 44.1 46.9 44.0 48.5 53.7 Jul 50.6 51.2 54.0 47.7 46.9 48.2 52.3 47.3 48.5 38.7 52.4 54.9 Aug 45.1 41.1 45.8 45.1 45.1 45.2 43.2 41.3 41.9 41.5 45.5 48.6 2 (4)
- 3. Silf/Swedbanks’ Purchasing Managers’ Index PMI Components of PMI Other indices Forecast Total New- Produc- Employ- Delivery Export Domestic Back-log Planned Index orders tion ment times Inventories orders orders of orders Prices Import Production 2009 May 45.8 49.0 50.3 33.1 36.5 35.3 49.6 46.6 45.9 36.5 43.2 48.3 Jun 53.9 59.4 60.8 39.1 45.5 37.3 58.3 53.5 50.3 45.1 50.0 54.6 Jul 50.7 55.7 51.3 40.8 46.9 40.7 53.5 53.6 53.1 47.4 47.3 59.2 Aug 56.2 62.9 62.9 41.9 49.3 41.5 64.6 55.3 60.2 54.5 53.9 64.7 Sep 57.7 59.9 63.6 46.7 56.6 40.4 61.2 57.1 54.0 57.0 57.8 62.9 Oct 56.1 58.6 61.1 43.6 57.2 40.4 58.1 54.7 55.0 56.8 54.7 59.6 Nov 53.9 53.8 56.1 48.1 53.5 39.3 56.1 50.8 48.5 56.9 55.4 59.5 Dec 54.2 57.9 53.5 47.2 52.8 39.3 61.6 52.8 50.8 52.8 56.0 65.7 2010 Jan 59.7 65.4 67.7 47.2 57.9 49.2 61.7 62.3 61.5 59.4 60.1 70.6 Feb 62.2 70.4 66.3 54.3 59.4 52.9 65.5 65.0 66.9 60.6 59.8 70.2 Mar 62.4 66.7 66.4 54.5 66.6 51.4 64.8 60.3 63.4 66.1 64.2 71.6 Apr 66.0 70.9 69.6 58.0 69.2 46.8 66.6 65.4 64.9 79.3 61.7 79.9 May 67.8 70.8 73.6 62.1 73.6 52.5 64.0 66.1 66.9 74.4 61.6 73.4 Jun 65.3 64.9 71.2 63.2 71.8 53.6 60.4 63.7 63.2 72.5 61.6 72.0 Jul 60.3 62.1 62.4 56.3 68.2 53.6 58.0 58.4 62.1 70.8 56.8 71.6 Aug 63.9 66.3 68.0 61.5 66.7 53.0 60.4 63.4 65.1 69.7 58.7 75.0 Sep 64.8 66.2 70.2 61.7 68.7 52.6 61.4 64.9 61.9 73.2 60.3 70.0 Oct 60.9 60.5 62.5 58.4 67.3 46.3 58.9 56.6 57.6 65.8 57.9 69.5 Nov 58.9 55.9 61.0 59.4 65.3 47.9 55.2 53.1 52.8 67.6 59.7 69.6 Dec 56.0 57.6 56.2 54.3 60.5 52.1 55.9 58.3 53.4 67.2 56.6 72.2 2011 Jan 59.4 62.7 62.3 54.9 60.6 50.7 61.5 59.6 59.0 75.3 57.3 71.7 Feb 61.5 62.2 65.9 60.3 65.0 53.7 61.6 57.4 60.5 76.4 60.3 72.8 Mar 59.6 58.6 63.9 57.6 65.4 53.1 56.9 55.1 56.8 74.0 60.8 73.4 Apr 61.7 64.3 65.0 58.9 65.8 55.4 60.3 59.0 59.6 78.1 59.9 72.8 May 57.7 57.3 62.3 56.1 62.9 57.5 54.0 58.4 57.8 66.2 57.8 69.4 Jun 55.6 56.1 58.1 54.1 59.9 54.8 55.8 52.4 53.7 61.8 54.0 63.1 Jul 45.8 39.7 39.2 53.5 56.9 52.0 43.1 38.1 47.5 50.5 46.0 62.4 Aug 51.7 51.3 54.4 51.7 50.7 52.4 50.7 46.6 53.0 47.7 50.7 57.8 Sep 49.4 46.8 51.6 51.3 49.4 51.6 48.1 48.1 46.5 48.4 47.1 52.5 Oct 48.9 48.1 47.1 50.0 48.1 45.1 46.2 47.7 44.9 38.5 45.2 50.3 Nov 45.2 42.6 42.9 47.4 43.5 43.4 43.8 42.9 39.6 39.0 42.6 48.4 Dec 44.8 41.2 42.8 46.7 46.0 44.8 44.2 39.9 40.4 37.7 43.4 57.7 2012 Jan 49.6 51.0 50.7 45.2 47.3 45.5 49.7 46.9 49.7 49.0 49.3 57.2 Feb 51.1 52.4 53.1 47.6 50.7 50.7 51.7 50.0 50.7 52.5 51.0 59.8 Mar 51.5 53.3 51.3 49.0 49.0 44.6 52.6 50.0 51.3 56.3 50.0 58.6 Apr 52.4 54.4 54.7 48.0 50.3 47.2 54.7 50.7 55.5 56.5 50.3 57.5 May 50.8 51.3 54.0 48.0 49.0 50.0 52.6 47.0 50.0 49.0 48.3 55.0 Jun 51.2 50.0 55.3 49.4 49.4 49.1 53.4 47.5 49.1 45.1 50.6 52.5 Jul 46.6 45.8 44.2 47.7 48.7 50.3 48.7 42.2 47.1 37.7 48.4 54.5 Aug 48.0 45.0 51.5 45.9 46.8 46.1 45.6 45.3 46.8 41.9 47.7 50.6 3 (4)
- 4. 4 (4)