
Recommended
Recommended
More Related Content
Similar to Cost of olympics
Similar to Cost of olympics (20)
More from Surbhi Jindal
More from Surbhi Jindal (20)
Recently uploaded
Recently uploaded (20)
Cost of olympics
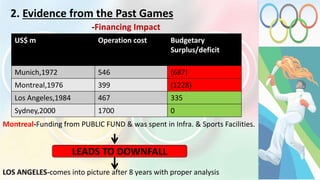
- 1. 2. Evidence from the Past Games US$ m Operation cost Budgetary Surplus/deficit Munich,1972 546 (687) Montreal,1976 399 (1228) Los Angeles,1984 467 335 Sydney,2000 1700 0 -Financing Impact Montreal-Funding from PUBLIC FUND & was spent in Infra. & Sports Facilities. LOS ANGELES-comes into picture after 8 years with proper analysis LEADS TO DOWNFALL
- 2. -GDP & Employment Impact COUNTRIES Impact of GDP % NEW JOBS (appx) Sydney 2.78 90,000 Atlanta 2.41 77,000 Barcelona 0.03 2,95,000 Seoul 1.40 3,35,000 Los Angeles 0.47 73,000 Cost-Benefit analysis Source: Greek Statistical Service, European Commission forecasts for 2004
- 3. 3. ATHENS-Slowdown Economy • Smallest Country ,Population of 7,90,000 app • Work was not done according to the Schedule. • Several projects has to Scrapped • Total cost EXCEEDS Estimate cost leads to Downfall. 500million – 2 billion • Even the villages lands are used to conduct OLYMPICS. • Widening Government Budget Deficit.
- 4. % GROWTH 2000 2001 2002 2003 2004 GDP 4.4 4.0 3.8 4.7 4.0 Private Consumption 2.0 2.8 2.8 4.0 3.6 Public Consumption 2.2 -1.0 5.1 6.0 2.0 Investment 10.0 5.5 6.1 11.6 6.0 Exports 14.1 -1.1 -7.7 1.6 7.3 Imports 8.9 -3.4 -4.7 3.7 5.6 SOURCE:-Arthur Andersen (1999)“Economic impact study of the Sydney 2000 Olympic Games”, Centre for Regional Economic Analysis, University of Tasmania Decrease Increase