1. Global Economics Weekly
Issue No: 10/29
July 28, 2010 Goldman Sachs Global Economics,
Commodities and Strategy Research
at https://360.gs.com
Looking into the Second Half
Jim O’Neill In our final weekly before a brief summer
jim.oneill@gs.com break, we look back over the year so far and
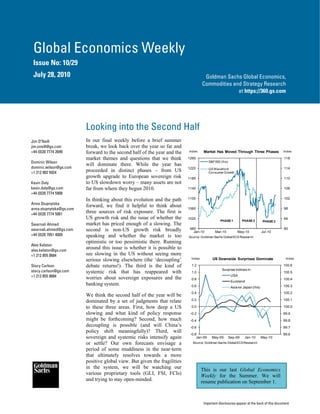
+44 (0)20 7774 2699 forward to the second half of the year and the Index Market Has Moved Through Three Phases Index
market themes and questions that we think 1260 118
Dominic Wilson S&P 500 (lhs)
will dominate there. While the year has
dominic.wilson@gs.com 1220 114
+1 212 902 5924 proceeded in distinct phases – from US GS Wavefront
Consumer Growth
growth upgrade to European sovereign risk 1180 110
Kevin Daly to US slowdown worry – many assets are not
kevin.daly@gs.com far from where they begun 2010. 1140 106
+44 (0)20 7774 5908
In thinking about this evolution and the path 1100 102
Anna Stupnytska
forward, we find it helpful to think about 1060 98
anna.stupnytska@gs.com
+44 (0)20 7774 5061
three sources of risk exposure. The first is
US growth risk and the issue of whether the 1020 94
PHASE 1 PHASE 2 PHASE 3
Swarnali Ahmed market has priced enough of a slowing. The
swarnali.ahmed@gs.com second is non-US growth risk broadly 980
Jan-10 Mar-10 May-10 Jul-10
90
+44 (0)20 7051 4009 speaking and whether the market is too Source: Goldman Sachs Global ECS Research
optimistic or too pessimistic there. Running
Alex Kelston
alex.kelston@gs.com
around this issue is whether it is possible to
+1 212 855 0684 see slowing in the US without seeing more
serious slowing elsewhere (the ‘decoupling’ Index US Downside Surprises Dominate Index
Stacy Carlson debate returns!). The third is the kind of 1.2 100.6
Surprise Indices in:
stacy.carlson@gs.com systemic risk that has reappeared with 1.0 100.5
+1 212 855 0684 USA
worries about sovereign exposures and the 0.8 100.4
Euroland
banking system. 0.6 100.3
Asia ex Japan (rhs)
0.4 100.2
We think the second half of the year will be
dominated by a set of judgments that relate 0.2 100.1
to these three areas. First, how deep a US 0.0 100.0
slowing and what kind of policy response -0.2 99.9
might be forthcoming? Second, how much -0.4 99.8
decoupling is possible (and will China’s -0.6 99.7
policy shift meaningfully)? Third, will
-0.8 99.6
sovereign and systemic risks intensify again Jan-09 May-09 Sep-09 Jan-10 May-10
or settle? Our own forecasts envisage a Source: Goldman Sachs Global ECS Research
period of some muddiness in the near-term
that ultimately resolves towards a more
positive global view. But given the fragilities
in the system, we will be watching our This is our last Global Economics
various proprietary tools (GLI, FSI, FCIs) Weekly for the Summer. We will
and trying to stay open-minded. resume publication on September 1.
Important disclosures appear at the back of this document
2. Goldman Sachs Global Economics, Commodities and Strategy Research Global Economics Weekly
Looking into the Second Half
In our final weekly before a brief summer break, we look to look more positively again at broad EM and China-
back over the year so far and forward to the second half related exposures.
of the year and the market themes and questions that we
think will dominate there. While the year has proceeded We think the second half of the year will be dominated
in distinct phases – from US growth upgrade to European by a set of judgments that relate to these three areas.
sovereign risk to US slowdown worry – many assets are First, how deep a US slowing and what kind of policy
not far from where they begun 2010. response might be forthcoming? Second, how much
decoupling is possible (and will China’s policy shift
In thinking about this evolution and the path forward, we meaningfully)? Third, will sovereign and systemic risks
find it helpful to think about three sources of risk intensify again or settle? Our own forecasts envisage a
exposure. The first is US growth risk and the issue of period of some muddiness in the near-term that
whether the market has priced enough of a slowing. The ultimately resolves towards a more positive global view.
second is non-US growth risk broadly speaking and But given the fragilities in the system, we will be
whether the market is too optimistic or too pessimistic watching our various proprietary tools (GLI, FSI, FCIs)
there. Running around this issue is whether it is possible and trying to stay open-minded.
to see slowing in the US without seeing more serious
slowing elsewhere (the ‘decoupling’ debate returns!). The
Three phases this year
third is the kind of systemic risk that has reappeared with
We see three distinct phases in the evolution of the
worries about sovereign exposures and the banking
markets this year. In the first phase from early December
system.
to early April, the market was dominated by further
Most asset classes are a mixture of all three risk evidence of acceleration in the global growth cycle but
exposures, but the mix varies widely. In terms of our own led by consistent upgrades to US growth views. European
views, we continue to think that US growth risk is not sovereign worries flared in the background but only
fully reflected and that the downgrade to US growth briefly spilled into broader markets. Over this phase,
views that the market has been making takes us only part risky assets generally did well, but US outperformance
of the way to where we need to be. In contrast, we still was clear in the performance of the USD, the
find ourselves more upbeat than consensus on the non- outperformance of US equity indices and of domestic-
US growth picture. Particularly as concern deepened in facing cyclical stocks within the US market.
May and June, we have also found ourselves on the more
In the second phase, from mid-April to mid-May, the
benign side of the debate about the impact of sovereign
European sovereign crisis intensified dramatically and
and system risks, though the issue is unlikely to disappear
funding stresses, systemic risk and concerns about
and there are plenty of political road-bumps that could
Europe’s political and economic health came to the fore.
resurface in the months ahead.
The sharp rise in volatility, a blow-out in peripheral
As a result, we have argued that we want to be ‘short US European sovereign spreads, a further rapid decline in the
growth risk’, ‘long non-US growth risk’ and to try to earn EUR and intense pressure on global asset markets were
‘systemic risk premia’. For now this has pushed us the major symptoms. Reinforcing this process were
towards relative trades between the US and the rest of the increasing signs that global cyclical indicators were
world in equities and FX, and a preference for earning peaking.
risk premium through parts of credit. We have also begun
Index First Phase of Market Driven by US Index Index Second Phase Saw Sovereign Risk and Index
Consumer Upgrade Volatility Spike
1260 118 300 50
S&P 500 (lhs)
275 Spain 5-yr CDS
1220 114 45
GS Wavefront (lhs)
Consumer Growth 250
VIX 40
1180 110 225
35
200
1140 106
175 30
1100 102
150
25
1060 98 125
20
100
1020 94 15
PHASE 1 PHASE 2 PHASE 3 75 PHASE 1 PHASE 2 PHASE 3
980 90 50 10
Jan-10 Mar-10 May-10 Jul-10 Jan-10 Mar-10 May-10 Jul-10
Source: Goldman Sachs Global ECS Research Source: Goldman Sachs Global ECS Research
Issue No: 10/29 2 July 28, 2010
3. Goldman Sachs Global Economics, Commodities and Strategy Research Global Economics Weekly
% Third Phase Driven by US Slowdown Fear % Index Focus Shifted from Relative US Strength Index
to Weakness
1.5 1.9 1.50 0.0380
US 2-year swap
rate (lhs) PHASE 1 PHASE 2 PHASE 3 0.0375
1.4 1.8 1.48
Euro 2-year swap
rate (rhs) 0.0370
1.3 1.46
1.7
0.0365
1.2 1.44
1.6 0.0360
1.1 1.42
PHASE 3 0.0355
1.5
1.0 PHASE 2 1.40
0.0350
PHASE 1
1.4
0.9 1.38 International vs
Domestic equities in 0.0345
1.3 US (lhs)
0.8 1.36 0.0340
EM equities vs SPX
0.7 1.2 1.34 0.0335
Jan-10 Mar-10 May-10 Jul-10 Jan-10 Mar-10 May-10 Jul-10
Source: Goldman Sachs Global ECS Research Source: Goldman Sachs Global ECS Research
Since mid-May, a third phase generated by the The most striking exceptions are in government bonds
combination of an aggressive European policy response and currencies. US 10-year yields are around 80bp below
and increased evidence of a US slowdown has been where they began the year and US 2-year yields more
evident to varying degrees across markets. This has been than 50bp lower and German yields have also fallen. In
associated with a gradual relaxation of some of the contrast, Greek sovereign spreads are (even now) over
extreme worries about sovereign risk and a greater focus 400bp wider than at the start of the year and Spanish
on pricing a slower US growth picture. The USD has spreads are still close to double their starting point
been weakening for nearly two months now, US equities (though the all-in yield has changed relatively little). In
have underperformed both Europe and EM (with FX, the EUR is even now 10% below where it started the
domestic outperformance within the market also year and the JPY has also rallied sharply in line with the
reversing) and US yields have fallen sharply both in fall in US rates. This means that point-to-point by far the
absolute and relative terms. biggest repricing this year has not been in the market’s
overall growth and risk view but in the relative pricing of
Despite these phases, we have ended up ‘round-tripping’ sovereign risk and a realization that policy rates will stay
in many places. US equities are almost exactly flat on the lower for longer in both the US and Eurozone.
year, as are broad EM equities, while Europe and China
have been clearer underperformers. Commodities and
broad cyclical equities (as captured by our Wavefront How our views have changed
Growth basket) are down a touch, while US consumer- This evolution has matched our outlook in places and
facing equities are still up year-to-date. And the VIX and challenged it in others. In a series of pieces analyzing this
corporate credit spreads are a touch higher. But many stage of the cycle and the post-housing bust experiences
things are more or less where they started the year, elsewhere, we argued that 2010 would be a year in which
despite following a volatile path in the interim. stocks went through a flatter period with more moderate
returns as the acceleration period in the global growth
Index US Downside Surprises Dominate Index % mom GLI Momentum vs. Global Industrial Production*
1.2 100.6 1.5
Surprise Indices in:
1.0 100.5 1.0
USA
0.8 Euroland 100.4 0.5
0.6 Asia ex Japan (rhs) 100.3 0.0
0.4 100.2 -0.5
0.2 100.1
-1.0
0.0 100.0
-1.5
-0.2 99.9
-2.0
-0.4 99.8 Global Industrial Production*, 3mma
-2.5
-0.6 99.7 GLI Momentum
-3.0
-0.8 99.6 98 99 00 01 02 03 04 05 06 07 08 09 10
Jan-09 May-09 Sep-09 Jan-10 May-10
* Includes OECD countries plus BRICs, Indonesia and South Africa
Source: Goldman Sachs Global ECS Research Source: OECD, GS Global ECS Research
Issue No: 10/29 3 July 28, 2010
4. Goldman Sachs Global Economics, Commodities and Strategy Research Global Economics Weekly
GDP Growth: GS vs Consensus GLI now shows a clear peak in March 2010, it is at this
2010 2011
point still consistent with relatively robust growth rates,
% yoy 2009 GS GS (23 Dec Consensus
GS Consensus* as are the PMIs as Kevin Daly and Alex Kelston recently
(Current) 2009) (Current)*
illustrated.
USA -2.4 2.6 2.3 3.1 2.4 3.0
Japan -5.2 3.4 1.5 3.2 1.7 1.6
Euroland -4.0 1.4 1.5 1.1 2.2 1.4
What we have missed so far includes three major issues.
UK -4.9 1.3 1.9 1.3 3.2 2.1
First, we underestimated the spread of the European
Europe -3.9 1.5 1.7 1.3 2.5 1.7 sovereign crisis to broad risk sentiment (and of course
China 8.7 10.1 11.4 10.1 10.0 9.1 initially to the EUR) and the extreme resurgence of both
India 7.4 8.2 8.2 8.3 8.7 8.3 volatility and financial risk. Second, we have
Brazil -0.2 7.8 5.8 7.1 4.5 4.4 underestimated the impact of ultra-low G3 rates on the
Russia -7.9 5.8 4.5 5.1 6.1 4.7 profile of interest rates globally. While many central
BRICs 5.3 8.9 9.2 8.8 8.7 8.0
banks have seen rates rise significantly relative to the G3,
Advanced
Economies
-3.1 2.6 2.2 2.7 2.6 2.5 the absolute pace of tightening – in Europe in particular –
World -0.6 4.7 4.4 4.6 4.8 4.3 has been slower than we initially envisaged. In most
* Consensus Economics July 2010 Source: Goldman Sachs Global ECS Research cases, this has not been because our growth and inflation
picture ended; that yields would fall rather than rise in the forecasts have been too ‘hawkish’ but because the
US as disinflation and a sub-par recovery continued; and reaction function of central banks has been different
that the unique US housing experience would see the re- (more dovish) than we expected. Third, we have been a
emergence of differentiation between the US and the rest little early to activate a view that our more robust EM
of the world and a moderate form of ‘decoupling’ on that growth views would translate into better absolute EM
basis. asset performance.
With global equity markets flat, bond yields lower and Looking at the changes to our own key forecasts since the
the market shifting back towards a US slowdown, many start of the year (set out in the table), our global growth
of these features still look relevant to us. The slowing in forecasts have actually risen both for this year and next.
the US economy that we have long forecast for 2010H2 Within this, our US GDP growth views are modestly
is becoming more visible than seemed likely a few higher for 2010 and our China growth views lower. Our
months ago. European data has so far validated our views for the Eurozone are not meaningfully different
forecast of relative resilience. And while our (improved) than they were at the start of the year. But they have
remained stable alongside significant reductions to our
Bigger Changes to Rates/FX Than Equities/Growth European rate forecasts for the end of 2010 (across most
31-Dec-09 27-Jul-10 European economies) and a substantial weakening in the
Equities currency, so easing financial conditions have more or less
SPX 1115.1 1113.8
offset the impact of fiscal austerity and sovereign risk.
This pattern of revisions broadly fits the revisions that
Eurostoxx 2965.0 2769.3
markets have also made so far this year.
EM equities 100.0 99.7
China H-shares 12794.1 11931.1
WF Growth 97.2 94.8 Three risks and how to think about them –
WF Consumer Growth 95.1 98.2 We have recently identified three sources of ‘exposure’
Volatility/Credit
that run through many macro assets to help us focus on
the asset landscape. The first is exposure to US growth
VIX (%) 21.7 23.2
risk. The second is exposure to non-US growth risk. The
CDX (bp) 85.5 102.5
third is exposure to systemic (and sovereign) risk, closer
CDX HY (bp) 515.6 553.4
to a pure risk premium.
Bonds
US 10-year (%) 3.85 3.08 Our own current views on these three areas are as
US 2-year (%) 1.14 0.65 follows:
German 10-year (%) 3.3 2.66
German 2-year (%) 1.35 0.87
On US growth risk, our forecasts remain firmly
below consensus on an absolute and relative basis
Spain 5-yr CDS (bp) 116 175
(recent data weakness has pushed the consensus
Greece 5-yr CDS (bp) 288 709
towards our 2010H2 US GDP growth forecast of
FX/Commodities 1.5%, but it remains above 2.5%). We do not think our
EUR/$ 1.43 1.30 US growth views are fully priced across markets. This
USD/JPY 93.09 87.90 is clearest from looking at our front-end views which
EUR/CHF 1.48 1.38 remain lower than the forwards even after the recent
AUD/$ 0.90 0.90 rally, both in absolute terms and relative to the entire
Crude Oil 79.4 77.5 G10. Benchmarking to the relative performance of US
Copper 7375.0 7059.0 equity markets, the picture is a little less clear, though
Source: Goldman Sachs Global ECS Research on a relative basis here too domestic-facing parts of
Issue No: 10/29 4 July 28, 2010
5. Goldman Sachs Global Economics, Commodities and Strategy Research Global Economics Weekly
the US market have also looked too optimistic versus Purer exposures to systemic risk premia tend to be
our forecasts. available in credit and volatility. Commodities have the
opposite flavour, providing more direct exposure to
On non-US growth risk, we continue to have a more growth views than to pure risk adjustments, though with
positive view in general. Our global growth forecast a global (and increasingly an EM-demand related) tilt.
remains above consensus and we see more tightening FX is a more complicated mix, but relative growth and
than the market in a significant number of the G10. rates views are an important driver of G10 in particular
Our European growth views in particular are now but also beyond. And the absolute state of the global
clearly more optimistic than others, as Erik Nielsen cycle and risk premium clearly impact many of the more
and team have set out for some time, and the latest cyclical and EM currencies as we have also shown in the
data has been quite encouraging on that front. For past.
China, the other big market focus, we see more
deceleration in the near-term, but our medium-term Using that template for mapping, this mix biases us
view is more constructive. In particular, we are now towards relative trades in equities and FX (including a
watching closely for signs of a shift towards a more stronger bias towards USD weakening); a cautiously
supportive policy stance. China-related assets have optimistic view of the overall risk picture particularly
been heavily discounted over the last 12 months and later in the year; a preference near-term for credit over
we think the market is not priced for the reacceleration equities and other risk assets as a more focused way to
in growth that our own forecasts envisage. Because earn elevated risk premia without excessive growth risk;
EM has been tightening, the impact of some and a bias towards global growth exposures. Our latest
deceleration in growth raises less of a policy dilemma asset allocation views, set out in a recent GOAL
here and continued low real rates in many places may publication, embody a lot of this thinking, arguing for a
again prove equity-supportive. preference for credit within risk assets, a generally pro-
risk stance and using commodity exposures to access the
On systemic risk, we have argued for several weeks potential for better than-expected growth outside the US
that the heightened concern about sovereign defaults and in China in particular.
(in Spain in particular) and about broad financial
system risk has been excessive. And our models across More specifically, the same approach suggests that the
asset classes point to elevated risk premia in many key asset market themes for the second half of the year
places. We have seen significant compression in some are likely to include:
of these risk premia (and falls in volatility) from the
highs in May and June. And we doubt that the In equities, a muddier risk picture as the market
sovereign crisis is ‘over’ in any definitive sense. But balances slowing US growth with better news
on balance our view remains that systemic risk and elsewhere, but one that is more likely to resolve in
asset market volatility are overpriced. favour of higher equity markets as the year proceeds.
Continued underperformance of US exposures and a
Asset market implications renewed bias to seek commodity and emerging market
Our own views can be seen through this lens. Looking at exposure within and across equity markets. In
the remainder of the year, our forecasts suggest that we particular, if expectations of Chinese growth begin to
should be: positioned for weaker US growth and low move higher again as we ultimately expect, this should
policy rates, at least on a relative basis; positioned for reinforce the outperformance of EM equities that has
better growth outcomes in other parts of the world and a resumed in recent months, alongside the continued
still-reasonable global growth picture, with an increasing easiness in policy in much of EM.
focus on the potential for a more positive shift in policy
in China; positioned to earn high risk premia where we A renewed search for carry and credit exposures as
can do that in ways consistent with our growth views. volatility drifts back towards more normal levels. This
drift may be punctuated by periodic bouts of sovereign
To translate these views into assets means understanding concern as political news on this front comes and goes.
the mix of these three exposures that different assets
deliver. In rates markets, front-end markets have the In rates, continued anchoring of G3 bond yields as
tightest links with local domestic growth views. As per policy rates remain low and disinflation continues in
our Sudoku models, longer-dated yields are a more the US and Eurozone. Further separation of relative
complicated mix of sensitivities to local growth, global rate spreads as a number of smaller G10 markets
growth and overall risk premia. In equities, relative tighten more than priced (Sweden, Switzerland,
performance of domestic-focused equities to other areas Norway, UK, Australia).
is also often a cleaner expression of growth views than a
straight directional view at the index level. The relative In FX, a renewed bias towards USD weakness
performance of indices – particularly of EM to DM –also alongside renewed appreciation in Asian FX (and
bears some relationship to the pattern of growth surprises other crosses with similar relative exposures like
in each area. AUD/CAD) if China-US outperformance becomes
evident again and CNY drift continues as per our
Issue No: 10/29 5 July 28, 2010
6. Goldman Sachs Global Economics, Commodities and Strategy Research Global Economics Weekly
forecasts. In line with that theme, some of the split in the US would be a challenge. A world in which
between the G3 core and ‘periphery’ currencies may non-US growth turns out somewhat better than
re-emerge, a trend that has been on hiatus, but that expected offsetting disappointing US growth news will
would be more likely if risk sentiment broadly feel very different to one in which we shift back from
improves further. a US to a global slowdown. Beyond the generic
question, we are particularly focused on whether
European data continues to slow less than expected or
What we are watching
whether inventory dynamics ultimately follow the US
Given our view of the three key risk exposures, we are
pattern and whether we get further noises about policy
watching the following:
shifts away from tightening in China.
1. How much will the US/world slow? Our biggest worry
3. Will sovereign and system risk intensify again or fade?
is that the US slowdown will be more rapid than we
This is arguably the hardest issue to handicap. We
think and that policy is then extremely constrained in
think that the recent European policy response –
dealing with it here. And that is the risk we think is
including the European stress tests – has increased the
most worth seeking protection against. But despite the
chances that we can muddle through the most intense
recent evidence of slowing, a more moderate outcome
risks. But the political challenges of dealing with the
than our own forecasts is conceivable too. While
fiscal adjustments that are needed in many places are
recent data has reinforced our comfort with our below-
intense and the political calendar in a range of places
consensus US forecast, the data has oscillated above
may heat up at the end of the summer. And it is too
and below expectations all year, so the latest news
early to be sounding an ‘all clear’ on these issues.
may overstate the deterioration in the trend just as the
March/April data likely overstated the acceleration. One of the greater difficulties of macro trading in 2010
Our Global Leading Indicator (newly improved) and relative to 2009 – and one that we always feared – has
our regular sifting of the PMI and export data will be a been that the underlying dynamics have tended to be less
critical part of our assessment. The levels of the GLI stable and, ironically, it has been easier to envisage a
remain consistent with strong global industrial growth, wide range of outcomes. In part, that is the nature of this
but the pace of recent deceleration in momentum stage of the recovery, which is almost always muddier
needs to be watched. than the initial acceleration period. Additionally, it is an
indication that the healing from the global recession and
2. How much (and where) can the rest of the world
financial crisis is still a work in progress.
‘decouple’? The latest data has been supportive of our
view of moderate ‘decoupling’, but a sharper slowing
Dominic Wilson
Issue No: 10/29 6 July 28, 2010
8. The World in a Nutshell
THE GLOBAL ECONOMY
OUTLOOK KEY ISSUES
UNITED STATES It is now reasonably clear that real GDP growth With various headwinds to private-sector growth
dropped below its 2.5%-3% long-term potential range (excess vacant housing, state and local budget
last quarter. We expect Q2 growth of 2% (annual stresses, lack of lending, reluctance to hire) still firmly
rate), followed by a further deceleration to 1.5% in in place, we expect real GDP growth to slow in the
both Q3 and Q4. This slowdown is happening just remainder of 2010, and we worry that reacceleration
ahead of the loss of growth support from fiscal in 2011 will not occur as now projected. Despite these
stimulus and the inventory cycle that we have been growing downside risks, US authorities (including Fed
anticipating would occur at mid-year. Chairman Bernanke in recent testimony) do not
exhibit much urgency to apply more policy stimulus.
JAPAN Our real GDP growth forecast is +3.4%yoy for 2010 The DPJ’s flagship policy of child-care allowance
and +1.7%yoy for 2011. Exports and production have started in June, but its economic impact is uncertain.
slowed as the yen has appreciated in response to the With the new Prime Minister in place, conditions may
expected US slowdown. Domestic consumption has allow Japan to progress on its taxation system and
held up well but has been concentrated in durable fiscal challenges. The government announced its long-
goods, supported by government subsidies. Once their term fiscal reform plan, calling for a cap on JGB
subsidies end, there is no guarantee of sustained issuance, and hence a natural cap on spending
consumption. Meanwhile, the labour market seems to growth. Prime Minister Kan has become vocal on a
be over the worst. future consumption tax rate hike before the July Upper
House election.
EUROPE Europe should continue to benefit from the stronger The stress test results provided more disclosure but
global growth environment. We expect EU-27 real lower estimates of required capital than the market
growth to be 1.5%yoy in 2010 and 2.5%yoy in 2011. expected. We think the large amount of information
For the Euro-zone, we forecast growth at 1.4% in on European banks is helpful and should increase
2010 and 2.2% in 2011. However, the cyclical transparency and help ease funding stresses. This
position of each country is different. While Euro- should help the ongoing gradual healing process of
zone Q1 GDP disappointed us, we think a good deal the European financial system. Additionally, our
of the overall shortfall was caused by the weather analysis shows that bank exposures to sovereigns
and will therefore show up in Q2. in Southern Europe, Ireland and Greece are
manageable.
NON-JAPAN ASIA In China, we have lowered our real GDP growth Our forecasts for China assume the current policy
forecast to 10.1% for 2010, from 11.4% previously. tightening measures remain in place at least for
We have not changed our view of the trend level, and another month, and then some loosening is likely in the
therefore once policy loosens, growth should quickly three months starting from August. These measures
revert to trend. Thus, we have kept our 2011 GDP include continued credit rationing, direct administrative
forecast unchanged at 10%. For Asia ex Japan we controls on certain heavy industrial producers, and
forecast 8.7% and 8.4% growth in 2010 and 2011. tightening measures on the property sector.
LATIN AMERICA Our LatAm growth forecast is 5.8% for 2010 and 4.7% We have lowered our Brazil growth forecast to 7.8%
in 2011. Our view is optimistic due to an encouraging yoy in 2010. Although the lagged effects from strong
global outlook, continuance of easy policy in the policy stimulus should continue to boost domestic
advanced economies, our expectation that global demand growth, recent data has been slightly weaker
liquidity will lead to capital inflows to LatAm, and high than expected. We also reduced our IPCA inflation
commodity price forecasts. forecasts to 6.0% in 2010 and 5.7% in 2011.
CENTRAL & EASTERN CEEMEA activity data has slowed in recent months In Hungary, disagreements between the government
EUROPE, MIDDLE EAST as industrial momentum has tapered and regional and the IMF/EU over 2011 fiscal targets pose a
uncertainty has increased. We have revised down potential risk for the region. Looking further ahead,
AND AFRICA some of our forecasts in the region, but most still some of the job losses in Russia, Hungary, Turkey
remain above consensus. The economies with strong and the Czech Republic during the crisis may prove
balance sheet structures and easy financial conditions permanent, owing to the relative rigidity of their labour
are expected to maintain strong growth. markets.
CENTRAL BANK POLICIES
CURRENT SITUATION NEXT MEETINGS EXPECTATION
UNITED STATES: FOMC The Fed cut the funds rate to a range August 10 We expect the Fed to keep the funds rate
of 0%-0.25% on December 16, 2008. September 21 near 0% through the end of 2011.
JAPAN: BoJ Monetary The BoJ cut the overnight call rate by August 10 We expect the BoJ to keep the policy rate
Policy Board 20bp to 0.1% on December 19, 2008. September 7 at 0.1% through 2011.
EUROLAND: ECB The ECB cut rates by 25bp to 1.0% on August 5 We expect the ECB to keep the policy rate
Governing Council May 7, 2009. September 2 on hold until a 25bp hike in 2011Q2.
UK: BoE Monetary The BoE cut rates by 50bp to 0.5% on August 5 We expect the BoE to begin hiking in
Policy Committee March 5, 2009. September 9 2010Q4 and continue to 3.0% by end-2011.
Issue No: 10/28 8 July 21, 2010