
Empfohlen
Empfohlen
Weitere ähnliche Inhalte
Was ist angesagt?
Was ist angesagt? (20)
Andere mochten auch
Ähnlich wie More study stuff
Ähnlich wie More study stuff (20)
Kürzlich hochgeladen
Kürzlich hochgeladen (20)
More study stuff
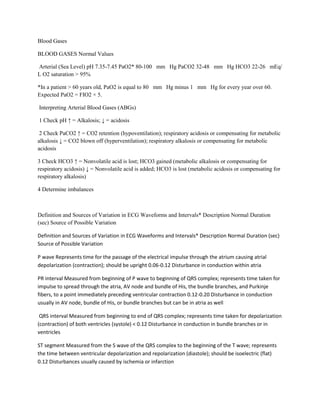
- 1. Blood Gases BLOOD GASES Normal Values Arterial (Sea Level) pH 7.35-7.45 PaO2* 80-100 mm Hg PaCO2 32-48 mm Hg HCO3 22-26 mEq/ L O2 saturation > 95% *In a patient > 60 years old, PaO2 is equal to 80 mm Hg minus 1 mm Hg for every year over 60. Expected PaO2 = FIO2 × 5. Interpreting Arterial Blood Gases (ABGs) 1 Check pH ↑ = Alkalosis; ↓ = acidosis 2 Check PaCO2 ↑ = CO2 retention (hypoventilation); respiratory acidosis or compensating for metabolic alkalosis ↓ = CO2 blown off (hyperventilation); respiratory alkalosis or compensating for metabolic acidosis 3 Check HCO3 ↑ = Nonvolatile acid is lost; HCO3 gained (metabolic alkalosis or compensating for respiratory acidosis) ↓ = Nonvolatile acid is added; HCO3 is lost (metabolic acidosis or compensating for respiratory alkalosis) 4 Determine imbalances Definition and Sources of Variation in ECG Waveforms and Intervals* Description Normal Duration (sec) Source of Possible Variation Definition and Sources of Variation in ECG Waveforms and Intervals* Description Normal Duration (sec) Source of Possible Variation P wave Represents time for the passage of the electrical impulse through the atrium causing atrial depolarization (contraction); should be upright 0.06-0.12 Disturbance in conduction within atria PR interval Measured from beginning of P wave to beginning of QRS complex; represents time taken for impulse to spread through the atria, AV node and bundle of His, the bundle branches, and Purkinje fibers, to a point immediately preceding ventricular contraction 0.12-0.20 Disturbance in conduction usually in AV node, bundle of His, or bundle branches but can be in atria as well QRS interval Measured from beginning to end of QRS complex; represents time taken for depolarization (contraction) of both ventricles (systole) < 0.12 Disturbance in conduction in bundle branches or in ventricles ST segment Measured from the S wave of the QRS complex to the beginning of the T wave; represents the time between ventricular depolarization and repolarization (diastole); should be isoelectric (flat) 0.12 Disturbances usually caused by ischemia or infarction
- 2. T wave Represents time for ventricular repolarization; should be upright 0.16 Disturbances usually caused by electrolyte imbalances, ischemia, or infarction QT interval Measured from beginning of QRS complex to end of T wave; represents time taken for entire electrical depolarization and repolarization of the ventricles 0.34-0.43 Disturbances usually affecting repolarization more than depolarization and caused by drugs, electrolyte imbalances, and changes in heart rate