UK Labour Market Data Signals Stronger Jobs Growth
•
0 gefällt mir•548 views

- The document is a report on the UK labour market from the Recruitment and Employment Confederation and KPMG. - It summarizes that permanent staff placements grew at the fastest rate since April 2011 in June, while temp billings increased at the strongest pace since November, indicating stronger growth in both permanent and temporary hiring. - Demand for staff from employers also increased sharply in June, with the rate of vacancy growth reaching a three-year high, showing rising job opportunities across both permanent and temporary positions.

Empfohlen
Empfohlen
Weitere ähnliche Inhalte
Was ist angesagt?
Was ist angesagt? (20)
Andere mochten auch
Andere mochten auch (20)
Ähnlich wie UK Labour Market Data Signals Stronger Jobs Growth
Ähnlich wie UK Labour Market Data Signals Stronger Jobs Growth (20)
Kürzlich hochgeladen
Kürzlich hochgeladen (20)
UK Labour Market Data Signals Stronger Jobs Growth
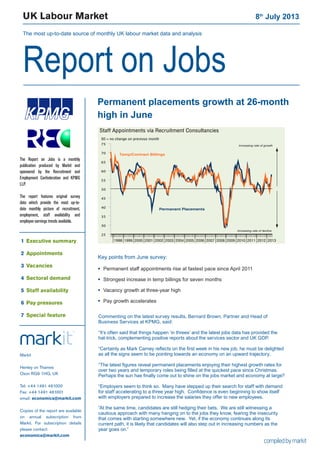
- 1. UK Labour Market 8th July 2013 The most up-to-date source of monthly UK labour market data and analysis Report on Jobs 1998 1999 2000 2001 2002 2003 2004 2005 2006 2007 2008 2009 2010 2011 2012 2013 25 30 35 40 45 50 55 60 65 70 75 Temp/Contract Billings Permanent Placements Increasing rate of decline Increasing rate of growth 50 = no change on previous month Staff Appointments via Recruitment Consultancies Permanent placements growth at 26-month high in June Commenting on the latest survey results, Bernard Brown, Partner and Head of Business Services at KPMG, said: “It’s often said that things happen ‘in threes’ and the latest jobs data has provided the hat-trick, complementing positive reports about the services sector and UK GDP. “Certainly as Mark Carney reflects on the first week in his new job, he must be delighted as all the signs seem to be pointing towards an economy on an upward trajectory. “The latest figures reveal permanent placements enjoying their highest growth rates for over two years and temporary roles being filled at the quickest pace since Christmas. Perhaps the sun has finally come out to shine on the jobs market and economy at large? “Employers seem to think so. Many have stepped up their search for staff with demand for staff accelerating to a three year high. Confidence is even beginning to show itself with employers prepared to increase the salaries they offer to new employees. “At the same time, candidates are still hedging their bets. We are still witnessing a cautious approach with many hanging on to the jobs they know, fearing the insecurity that comes with starting somewhere new. Yet, if the economy continues along its current path, it is likely that candidates will also step out in increasing numbers as the year goes on.” Markit Henley on Thames Oxon RG9 1HG, UK Tel: +44 1491 461000 Fax: +44 1491 461001 email: economics@markit.com Copies of the report are available on annual subscription from Markit. For subscription details please contact: economics@markit.com The Report on Jobs is a monthly publication produced by Markit and sponsored by the Recruitment and Employment Confederation and KPMG LLP. The report features original survey data which provide the most up-to- date monthly picture of recruitment, employment, staff availability and employee earnings trends available. 1 Executive summary 2 Appointments 3 Vacancies 4 Sectoral demand 5 Staff availability 6 Pay pressures 7 Special feature Key points from June survey: Permanent staff appointments rise at fastest pace since April 2011 Strongest increase in temp billings for seven months Vacancy growth at three-year high Pay growth accelerates
- 2. Report on Jobs | Recruitment Industry Survey The Report on Jobs is unique in providing the most comprehensive guide to the UK labour market, drawing on original survey data provided by recruitment consultancies and employers to provide the first indication each month of labour market trends. The main findings for June are: Stronger increases in permanent and temporary appointments Growth of permanent staff placements accelerated markedly in June, reaching the fastest rate for over two years. Similarly, temporary/contract staff billings rose at a much sharper pace, with the latest increase the strongest in seven months. Demand for staff rises at strongest rate in three years The rate of expansion of job vacancies accelerated to a three-year high in June. Sharper increases in demand were signalled for both permanent and temporary workers. Pay growth accelerates Permanent staff salaries rose at the fastest pace for 23 months in June. Temporary/contract staff pay growth also quickened, reaching the sharpest since March 2008. Permanent staff availability down, but temp availability rises Recruitment consultants signalled a further drop in the availability of candidates for permanent roles during June. However, temp availability continued to improve. 1 Executive summary 1998 1999 2000 2001 2002 2003 2004 2005 2006 2007 2008 2009 2010 2011 2012 2013 25 30 35 40 45 50 55 60 65 70 Staff Appointments Temp/Contract Billings Permanent Placements 25 30 35 40 45 50 55 60 65 70 50 = no change on previous month 50=no change on previous month 1998 1999 2000 2001 2002 2003 2004 2005 2006 2007 2008 2009 2010 2011 2012 2013 35 40 45 50 55 60 65 70 Staff Availability and Earnings Growth Skill shortages Average permanent salaries (LHS) 90 80 70 60 50 40 30 50 = no change on previous month 50 = no change on previous month (inverted) inverted - RHS) (Availability of staff 1998 1999 2000 2001 2002 2003 2004 2005 2006 2007 2008 2009 2010 2011 2012 2013 Temp/Contract Vacancies Permanent Vacancies 50 = no change on previous month 25 30 35 40 45 50 55 60 65 70 75 Increasing rate of growth Increasing rate of decline Demand for staff All Intellectual Property Rights owned by Markit Economics Limited
- 3. Report on Jobs | Recruitment Industry Survey Recruitment consultancies report on the number of people placed in permanent jobs each month, and their revenues (billings) received from placing people in temporary or contract positions at employers. Latest data signalled faster increases in both permanent staff placements and temporary/contract staff billings during June. Permanent placements rise at strongest rate for 26 months... The number of people placed in permanent jobs by recruitment consultancies increased for a ninth consecutive month in June. Moreover, the rate of expansion picked up markedly since May to the sharpest pace since April 2011. Anecdotal evidence pointed to stronger client demand, improved confidence and quicker decision-making as factors behind higher placements. The South posted the fastest rise in permanent appointments during the latest survey period, closely followed by the North. The Midlands saw a solid expansion, while London recorded a moderate increase. ...while temp billings growth quickens to seven-month high Billings received by employment agencies from the employment of temporary/contract staff rose for the second month running in June. Accelerating sharply since May, the rate of growth reached the strongest since last November. Higher temp billings were generally attributed by panellists to increased client activity levels. Temporary/contract staff billings rose in each of the four monitored English regions, although in the case of the Midlands growth was marginal. The North posted the strongest increase. An index reading above 50 signals a higher number of placements/billings than the previous month. Readings below 50 signal a decline compared with the previous month. 2 Staff appointments 1998 1999 2000 2001 2002 2003 2004 2005 2006 2007 2008 2009 2010 2011 2012 2013 25 30 35 40 45 50 55 60 65 70 75 Temp/Contract Billings Permanent Placements Increasing rate of decline Increasing rate of growth 50 = no change on previous month Staff Appointments via Recruitment Consultancies 2013 Jan 41.7 29.1 29.2 12.5 56.3 53.2 Feb 39.1 28.5 32.4 6.8 53.4 52.7 Mar 38.3 34.0 27.6 10.7 55.3 50.8 Apr 38.9 36.7 24.4 14.5 57.2 52.5 May 39.2 30.7 30.1 9.1 54.6 53.4 Jun 47.9 31.5 20.6 27.2 63.6 57.6 Higher Same Lower Net Index S.Adj. % % % +/- 50 = no chg Index Permanent Staff Placements Q. Please compare the number of staff placed in permanent positions with the number one month ago. 2013 Jan 21.3 38.9 39.8 -18.5 40.7 55.5 Feb 32.9 36.7 30.4 2.5 51.3 51.6 Mar 37.6 37.7 24.7 12.9 56.4 51.0 Apr 26.1 42.7 31.3 -5.2 47.4 48.7 May 34.8 42.7 22.5 12.2 56.1 52.6 Jun 41.3 39.1 19.6 21.7 60.8 56.4 Higher Same Lower Net Index S.Adj. % % % +/- 50 = no chg Index Temporary/Contract Staff Billings Q. Please compare your billings received from the employment of temporary and contract staff with the situation one month ago.
- 4. Report on Jobs | Recruitment Industry Survey 3 Vacancies All Intellectual Property Rights owned by Markit Economics Limited Recruitment consultants are asked to specify whether the demand for staff from employers has changed on the previous month, thereby providing an indicator of the number of job vacancies. The summary indexes shown in this page are derived from the detailed sector data shown on page 5. Vacancy growth at three-year high The Report on Jobs Vacancies Index climbed to its highest level for three years in June. At 59.1, up from 54.8 in May, the index signalled a strong pace of expansion. Faster increases in demand were recorded for both permanent and temporary staff vacancies during the latest survey period. Rates of growth were at 36- and 27-month highs respectively. Public & private sector vacancies Public sector permanent vacancies rose for the first time in six months during June, while public sector temporary/contract vacancies were unchanged from May. In the private sector, both permanent and temporary/ contract vacancies increased at the fastest pace since data were first available in December 2011. Other vacancy indicators Data from the Office for National Statistics showed that job vacancies were up 10.3% on an annual basis in the three months to May. That was up slightly from 9.9% in the three months to April and the fastest growth for nearly three years. Latest available data signalled that internet-based recruitment spending rose by 3.1% in the fourth quarter of 2012. That followed a -0.8% fall in the third quarter. The Job Vacancies Index monitors the overall demand for staff at recruitment consultancies. An index reading above 50 signals a higher number of vacancies than the previous month. Readings below 50 signal a decline compared with the previous month. 1998 1999 2000 2001 2002 2003 2004 2005 2006 2007 2008 2009 2010 2011 2012 2013 Temp/Contract Vacancies Permanent Vacancies 50 = no change on previous month 25 30 35 40 45 50 55 60 65 70 75 Increasing rate of growth Increasing rate of decline 25 30 35 40 45 50 55 60 65 70 75 Job Vacancies 50 = no change on previous month Vacancy Index Increasing rate of growth Increasing rate of decline Job Vacancy Indicators Feb’13 Mar Apr May Jun Job Vacancy Index (recruitment industry survey) 50 = no change on previous month Other key vacancy data Annual % change Sources: Job centre vacancies provided by Office for National Statistics Internet recruitment spending provided by WARC.com Total 56.1 54.8 54.9 54.8 59.1 Permanent Staff 56.1 54.7 54.9 54.8 59.2 Temporary Staff 56.0 55.5 53.9 55.2 57.7 Public: perm 47.8 49.5 45.0 46.7 52.8 Public: temp 48.5 52.3 47.3 50.8 50.0 Private: perm 63.0 57.4 58.9 64.9 66.6 Private: temp 58.8 56.0 54.4 60.2 63.9 Job centre vacancies 7.1 9.1 9.9 10.3 n/a Internet recruitment 3.1 -- -- -- -- Public & private sector vacancies (not seasonally adjusted)
- 5. Report on Jobs | Recruitment Industry Survey Recruitment consultancies are requested to compare the demand for staff according to sector with the situation one month ago. Permanent Staff Growth of demand was broad-based across all nine types of permanent staff monitored by the survey in June. Engineering remained the most sought-after category, posting a substantial increase in vacancies. The slowest rates of expansion were indicated for Blue Collar and Hotel & Catering workers. 4 Demand for staff by sector 50 = no change on previous month Demand for staff 20 30 40 50 60 70 80 90 Secretarial & Clerical Perm Tem p 2002 2003 2004 2005 2006 2007 2008 2009 2010 2011 2012 20 30 40 50 60 70 80 90 Accounting & Financial Tem p Perm 2002 2003 2004 2005 2006 2007 2008 2009 2010 2011 2012 2002 2003 2004 2005 2006 2007 2008 2009 2010 2011 2012 20 30 40 50 60 70 80 90 Executive & Professional Perm Tem p 2002 2003 2004 2005 2006 2007 2008 2009 2010 2011 2012 20 30 40 50 60 70 80 90 IT & Computing Tem p Perm 20 30 40 50 60 70 80 90 2002 2003 2004 2005 2006 2007 2008 2009 2010 2011 2012 Tem p Blue Collar Perm 20 30 40 50 60 70 80 90 2002 2003 2004 2005 2006 2007 2008 2009 2010 2011 2012 Nursing/Medical/Care Tem p Perm 2002 2003 2004 2005 2006 2007 2008 2009 2010 2011 2012 20 30 40 50 60 70 80 90 Hotel & Catering Tem p Perm Engineering; Construction This year (Last year) Rank Jun'13 Rank Jun'12 This year (Last year) Rank Jun'13 Rank Jun'12 *Non-seasonally adjusted data. Prior to April 2013 Engineering/Construction was reported as a single category. Data are presented in the form of diffusion indices whereby a reading of 50 indicates no change on the previous month. Readings above 50 signal stronger demand than a month ago. Readings below 50 signal weaker demand than a month ago. Engineering* 1 64.9 n/a n/a Nursing/Medical/Care 2 64.7 (1) (59.0) Construction* 3 58.1 n/a n/a IT & Computing 4 57.3 (3) (51.4) Blue Collar 5 55.9 (4) (49.2) Hotel & Catering 6 55.3 (7) (47.5) Secretarial/Clerical 7 55.0 (2) (52.3) Executive/Professional 8 54.3 (5) (48.4) Accounting/Financial 9 53.0 (6) (47.6) Engineering* 1 69.4 n/a n/a IT & Computing 2 61.6 (1) (57.1) Executive/Professional 3 60.9 (3) (53.9) Nursing/Medical/Care =4 60.7 (2) (54.8) Construction* =4 60.7 n/a n/a Accounting/Financial 6 57.8 (5) (49.9) Secretarial/Clerical 7 55.6 (4) (52.8) Blue Collar 8 53.6 (6) (48.3) Hotel & Catering 9 53.4 (7) (46.4) Temporary/contract staff Mirroring the trend seen for permanent employees, Engineering workers were the most in-demand category of temporary/contract staff during June. This was closely followed by Nursing/Medical/Care. The weakest increase was signalled for Accounting/Financial staff. 46 50 54 58 62 66 70 74 Engineering Construction Perm Tem p
- 6. Report on Jobs | Recruitment Industry Survey Recruitment consultants are asked to report whether availability of permanent and temporary staff has changed on the previous month. An overall indicator of staff availability is also calculated. Availability of permanent staff The availability of candidates to fill permanent job vacancies fell for a second consecutive month in June. Although moderate, the rate of decline was nevertheless the sharpest since December 2012. Lower permanent staff availability was recorded in London, the Midlands and the North, whereas the South posted a rise. Availability of temp/contract staff In contrast to the trend seen for permanent staff, the availability of candidates for short-term roles increased at a faster pace in June. The latest rise was the strongest in seven months. London and the Midlands both registered solid increases in temporary/contract staff availability in the latest survey period. The South saw no change, while the North recorded a marginal decline. 5 Staff availability 1998 1999 2000 2001 2002 2003 2004 2005 2006 2007 2008 2009 2010 2011 2012 2013 Temp Availability Permanent Availability 50 = no change on previous month 20 30 40 50 60 70 80 90Improving availability Deteriorating availability 20 30 40 50 60 70 80 90 Staff Availability 50 = no change on previous month Staff Availability Index Improving availability Deteriorating availability 2013 Jan 33.7 49.7 16.6 17.1 58.6 49.0 Feb 23.1 59.8 17.1 6.0 53.0 48.9 Mar 19.6 60.2 20.2 -0.7 49.7 48.5 Apr 19.5 61.1 19.4 0.1 50.0 50.1 May 16.3 64.1 19.6 -3.3 48.4 49.6 Jun 15.5 61.0 23.6 -8.1 45.9 48.3 Key permanent staff skills reported in short supply:* Accountancy/Financial: Accountants, Credit, Insurance. Blue Collar: Distribution, Welders. Engineering: Automotive, Electrical, General engineering, Oil & gas, Structural. Executive/Professional: Legal, Marketing, PR, Senior managers. Hotels/Catering: Chefs. IT/Computing: Developers, Digital marketing, PHP, SQL, Web developers. Nursing/Medical/Care: Nurses. Secretarial/Clerical: Admin, Receptionists. Other: Buyers, Sales. Key temp skills reported in short supply:* Blue Collar: Cleaners, HGV drivers, LGV drivers. Construction: Wirers. Engineering: CNC programmers, Engineers, Oil & gas. Executive/Professional: Advertising. Hotels/Catering: Chefs. IT/Computing: Java, .Net, PHP, VM. Secretarial/Clerical: Admin, Legal secretaries. Other: Customer services. Availability of permanent staff Q. Is the availability of candidates for permanent vacancies better, the same or worse than one month ago? Better Same Worse Net Index S.Adj. % % % +/- Index 2013 Jan 29.5 59.2 11.3 18.2 59.1 52.0 Feb 23.5 62.7 13.7 9.8 54.9 51.6 Mar 17.3 66.1 16.6 0.7 50.4 51.5 Apr 16.8 65.5 17.7 -1.0 49.5 51.4 May 15.6 66.8 17.6 -2.0 49.0 51.0 Jun 23.4 59.7 17.0 6.4 53.2 53.1 Availability of temporary/contract staff Q. Is the availability of candidates for temporary vacancies better, the same or worse than one month ago? Better Same Worse Net Index S.Adj. % % % +/- Index All Intellectual Property Rights owned by Markit Economics Limited *consultants are invited to specify any areas in which they have encountered skill shortages during the latest month
- 7. Report on Jobs | Recruitment Industry Survey The recruitment industry survey tracks both the average salaries awarded to people placed in permanent jobs each month, as well as average hourly rates of pay for temp/contract staff. Permanent salaries Average starting salaries awarded to successful candidates placed in permanent jobs rose further in June. Moreover, the rate of inflation accelerated to a solid pace that was the fastest in 23 months. Those panellists reporting a rise in salaries cited shortages of quality candidates and greater numbers of senior- level placements. Higher salaries were registered in all four monitored English regions. The strongest increase was signalled in the North, while London posted the weakest rise. Temp/contract pay rates June data indicated a sharper rise in hourly pay rates for temporary/contract staff. The latest increase was the strongest since March 2008. Higher demand for short-term workers was reported as the principal reason behind temp pay inflation. Marked rises in temp pay were recorded in the Midlands and the South, whereas London and the North posted marginal increases. 6 Pay pressures 1998 1999 2000 2001 2002 2003 2004 2005 2006 2007 2008 2009 2010 2011 2012 2013 35 40 45 50 55 60 65 70 Temp/Contract Hourly Pay Rates Permanent Salaries Increasing rate of decline Increasing rate of growth 50 = no change on previous month Pay Pressures 2012 Dec 7.4 87.4 5.2 2.3 51.1 52.3 2013 Jan 10.1 82.6 7.3 2.8 51.4 52.5 Feb 11.3 82.3 6.3 5.0 52.5 52.9 Mar 10.7 84.1 5.2 5.5 52.7 52.7 Apr 10.1 84.8 5.1 4.9 52.5 52.1 May 13.1 80.4 6.5 6.6 53.3 51.8 Jun 14.4 79.6 6.0 8.4 54.2 53.2 Higher Same Lower Net Index S.Adj. % % % +/- Index Permanent Salaries Q.Areaverage salaries awarded tostaffplaced in permanent positions higher, the same or lower than one month ago? 2012 Dec 4.8 90.1 5.1 -0.3 49.9 51.4 2013 Jan 5.6 88.9 5.4 0.2 50.1 49.8 Feb 7.0 87.3 5.7 1.3 50.6 50.3 Mar 8.8 89.3 1.9 6.9 53.5 52.1 Apr 7.7 86.8 5.5 2.2 51.1 51.6 May 8.6 87.1 4.4 4.2 52.1 52.0 Jun 11.9 83.7 4.4 7.5 53.7 53.9 Higher Same Lower Net Index S.Adj. % % % +/- Index Temporary/Contract Pay Rates Q. Are average hourly pay rates for temporary/contract staff higher, the same or lower than one month ago? 2001 2002 2003 2004 2005 2006 2007 2008 2009 2010 2011 2012 -6 -3 0 3 6 9 Public sector Private sector Annual percent change Yr/yr % chg in average weekly earnings (3mma) 2010 2011 2012 Jan'13 Feb Mar Apr Whole economy 2.3 2.4 1.5 1.2 1.1 0.6 1.3 Private sector 2.0 2.5 1.6 1.1 0.8 0.1 1.3 Public sector 3.3 2.5 1.6 1.9 1.7 1.4 1.2 Services 2.3 2.8 1.5 1.3 1.2 0.6 1.3 Manufacturing 4.0 1.6 1.8 1.6 1.7 2.1 2.8 Construction 0.3 0.8 0.9 -1.3 -1.2 -2.4 -0.8 UK average weekly earnings Data from the Office for National Statistics signalled that annual growth of employee earnings (including bonuses) picked up to 1.3% in the three months to April, the highest in 2013 so far. Similar rates of pay growth were signalled in the private and public sectors.
- 8. Report on Jobs | Recruitment Industry Survey 7 Feature PMI employment trends KPMG LLP, a UK limited liability partnership, is a subsidiary of KPMG Europe LLP and operates from 22 offices across the UK with over 12,000 partners and staff. The UK firm recorded a turnover of £1.8 billion in the year ended September 2012. KPMG is a global network of professional firms providing Audit, Tax, and Advisory services. We operate in 156 countries and have 152,000 professionals working in member firms around the world. The independent member firms of the KPMG network are affiliated with KPMG International Cooperative (“KPMG International”), a Swiss entity. KPMG International provides no client services. The REC is the professional body representing the UK’s £24.6 billion private recruitment and staffingindustrywithmorethan8,000recruitment agencies and 6,000 recruitment consultants in membership. There are more than 1 million temporary workers registered with UK agencies who are deployed in industry, commerce and the public services every day. Markit is a specialist compiler of business surveys and economic indices, including the Purchasing Managers’ Index® (PMI® ) series, which is now available for 32 countries and key regions including the Eurozone. For more information e-mail economics@markit.com or call +44 1491 461000. Recruitment Industry Survey The monthly survey features original research data collected via questionnaire by Markit from a panel of 400 UK recruitment and employment consultancies. In 2010/11, some 1,049,333 people were employed in either temporary or contract work through consultancies and 604,193 people were placed in permanent positions through consultancies. Monthly survey data were first collected in October 1997 and are collected in the end of each month, with respondents asked to specify the direction of change in a number of survey variables. Markit do not revise underlying survey data after first publication, but seasonal adjustment factors may be revised from time to time as appropriate which will affect the seasonally adjusted data series. The intellectual property rights to these data are owned by Markit Economics Limited. Any unauthorised use, including but not limited to copying, distributing, transmitting or otherwise of any data appearing is not permitted without Markit’s prior consent. The publication or release of any of these data prior to the general release time is an infringement of Markit Economics Limited’s intellectual property rights. Markit shall not have any liability, duty or obligation for or relating to the content or information (“data”) contained herein, any errors, inaccuracies, omissions or delays in the data, or for any actions taken in reliance thereon. In no event shall Markit be liable for any special, incidental, or consequential damages, arising out of the use of the data. Purchasing Managers’ Index® and PMI® are registered trade marks of Markit Economics Limited. Markit and the Markit logo are registered trade marks of Markit Group Limited. Upturn in services hiring boost private sector employment Latest Purchasing Managers’ Index (PMI) data from Markit/ CIPS illustrate a pick-up in jobs growth across the UK private sector during June. The overall rate of employment growth was the fastest in over five-and-a-half years. However, trends varied by sector. The fastest rate of expansion in staffing levels was signalled by service providers, with the latest rise being the most marked since August 2007. Recruitment of new staff was principally linked by service providers to increased business volumes. Some companies took on new employees in line with growing confidence over future economic conditions. Construction firms meanwhile reported an increase in employment for the first time in four months. Although modest, the rate of hiring was the sharpest since last September. Manufacturers however indicated broadly stagnant staffing levels during June, following a slight increase in the previous month. All Intellectual Property Rights owned by Markit Economics Limited PMI employment by sector 30 35 40 45 50 55 60 65 1998 2000 2002 2004 2006 2008 2010 2012 Manufacturing Services Construction Markit/CIPS PMI Employment Index, sa, 50 = no change Source: Markit