1. The Journal of Applied Business Research – Spring 2005 Volume 21, Number 2
Segmentation Based
On Media Consumption:
A Better Way To Plan Integrated
Marketing Communications Media
Kurt Schimmel, (E-mail: schimmel@rmu.edu), Robert Morris University
Jeananne Nicholls, Strategic planning and technology consultant
ABSTRACT
This paper provides an example of utilizing survey data to develop the initial media and method
(Advertising, PR, Interactive, Word of mouth) mix. Utilizing K-Means Cluster analysis and
discriminant analysis to profile the clusters three segments were identified based on media
consumption. Differences in the segments were also found to exist regarding the perceptions of
the benefits and concerns regarding e-commerce. This indicated that in addition to different
media/method mixes, different message strategies are also appropriate for the segments. The
segments were then profiled utilizing Multiple Correspondence Analysis to determine the
relationship between the segments and the demographic variables and also between the segments
and shopping behavior
INTRODUCTION
T he concept that synergistically utilizing a media mix of advertising, public relations, interactive
communications and word of mouth (WOM) to maximize the impact of a marketing communications
campaign to reach consumers with the right message, in the right media, is intuitively logical and
accepted by both academics and practitioners. Integrating media increases synergies in delivering messages as
demonstrated by Naik and Raman (2003). The need to develop better media planning methods that maximize synergy
and increase efficiencies while decreasing overspending has been noted in recent literature ( Hoeffler 2003; Schultz
2002). This article addresses this need. It presents an exploratory study that presents a consumer centric method for
developing media plans.
No research exists addressing how this mix should be developed. What is the optimal communications
method mix to reach the e-commerce consumer? How should that mix be determined? These are two key questions
facing marketing managers and advertisers for e-tailers. If the right message is placed in the wrong media, or if the
message is conveyed through the wrong method, it will miss the target audience wasting the marketing
communications budget.
While there is a body of research that examines differing methods to compare advertising media (Woodside
and Soni, 1990; Woodside, 1994) and theoretical work on how to utilize the communications methods synergistically
(Bond & Kirshenbaum, 1998; Ephron, 2000), there is no work that proposes how to determine the appropriate mix
across message delivery formats (Advertising, Public Relations etc.).
This paper demonstrates how the common database marketing technique of behavioral-based, post-hoc
market segmentation is applied to media consumption and guides the integrated marketing communications planner.
Segmentation based on media use has the benefit of allowing a greater degree of message targeting with customized
23
2. The Journal of Applied Business Research – Spring 2005 Volume 21, Number 2
messages being developed for each segment. It also allows for more efficient message delivery targeting the specific
niches.
“TRADITIONAL” MEDIA MIX METHODS
The traditional model of media planning taught in text books (for examples see Donnelly 1996, Rossiter and
Percy 1997, Sissors and Bumba 1995, Taylor 1993) addresses advertising media purchases and does not address the
selection of method delivery for the messages. The focus is on utilizing the ARF model’s stages to evaluate media.
These stages are: vehicle distribution; vehicle exposure, advertising exposure, advertising perception, advertising
communication and sales response. This model has been expanded for interactive web media and includes vehicle
distribution, vehicle exposure, advertising exposure, persuasion, leads, sales, profits, customer loyalty, and finally
return on investment (Harvey, 1997). The practical result of this model results in translating consumer demographic
profiles and measures such as reach & frequency (Leckneby and Hong, 1998), exposure (Abe, 1997), effective
frequency (Broadbent, Spittler and Lynch, 1997), cost per thousand impressions (Lloyd and Clancy, 1991), and gross
rating points (Masterson, 1999) to develop an advertising based media mix only.
Another stream of media planning research that has developed since the introduction of IMC is increasing the
emphasis on “impact” measures as a method for evaluating media. Schultz, Tannenbaum and Lauterborn (1993)
emphasizes return on investment (ROI) as the key measure behind an IMC campaign. Woodside and Soni (1990) and
Woodside (1994), develop a performance grid based on cost per inquiry (CPI) and revenue per inquiry (RPI). These
measures provide a guide for future media purchases and are used to evaluate message delivery methods after the
media plan is implemented. However, they do not provide a guide for the initial IMC media/method delivery plan.
Additionally, research has experimentally examined the impact of specific media on consumer decision
processes (Bruner and Kumar, 2000; Gibson, 1996; Puth, Mostert and Ewing, 1999). These results indicate that the
impact of each media changes with each product category since consumer information searches differ across product
categories.
THE PROBLEM
None of the previously cited research guides tactical utilization and planning across message delivery
methods. That is they do not answer questions such as: when is PR better? When should there be a focus on
interactive advertising? How will the communications methods work together, compliment each other tactically, and
how do these decisions get made? These are the real decisions to be faced prior to developing an IMC campaign that
have, to date, been unanswered by academic research.
Additionally none of the prior research has utilized the consumer’s media consumption habits. They have
used demographic and psychographic profiles of the consumer then matched the media, messages and the methods
based on these broad characteristics. However, none of the methods have queried customers as to their media
consumption habits.
PROPOSED SOLUTION
The concept of segmentation for media planning itself is not new. Recent studies in media planning have
uses segments based on demographic characteristics (Davis and French 1989; Korgaonkar, Silverblatt and O’Leary
2001), media consumption patterns for advertising (Kim, 2002), attitudes toward advertising (Bond and Brace 1997;
Smith & Neijens 2000), and product consumption (Wansink and Park, 2000) to name a few recent studies.
Post hoc segmentation methods are also common within e-commerce to examine flow patterns, shopping
behavior, and web visitation among other techniques. This paper suggests that segmentation based on media
consumption should be utilized to develop the initial message delivery mix in an IMC campaign. After the initial
campaign is started, the application of the Media Vehicle Performance grid (Woodside and Soni, 1990) can be applied
to explore the impact of the communication methods suggested for revising and refining the media plan.
24
3. The Journal of Applied Business Research – Spring 2005 Volume 21, Number 2
The approach we propose applies the tenets of IMC and focuses on understanding the consumer while
providing information in a synergistic manner to maximize the impact and limit the costs. The first step is to
understand the consumer. As part of the initial business plan, research was conducted to determine the viability of the
niche as a target market. Within this initial research, customers were queried to determine what media vehicles (TV,
Newspapers, Radio, Web-based) they consumed for shopping information. The survey also explored which methods
(such as advertising, PR, interactive) had the greatest impact in influencing consumers to shop on-line. Finally the
consumers were asked what were their underlying motivations for shopping online. This data provides the basis for
the initial IMC plan. It identified the media this stores consumers utilize, what methods have the greatest influence
and what message should be sent for the greatest impact. The key idea is that if there are underlying segments that
consume media differently, a media plan that does not address these segments through targeted communications will
place the communications in the wrong media or deliver the wrong message in media. Either of these outcomes
results in wasted promotional budget and resources.
THE COMPANY
The research for the media plan was undertaken for a new niche marketed e-catalog. The
organization had a limited marketing communications budget and needed to “get it right the first time.” Of primary
concern was reaching the consumer with the correct information using the correct media to maximize the return on the
marketing communications investment.
SURVEY METHODOLOGY
The data was collected by a phone survey of 308 respondents in seven cities. These cities were chosen for
the proportionally greater percentage of on-line consumers compared to other regions in the country. The data was
collected over a three day period using a phone bank of professional interviewers and a computer assisted telephone
interviewing system (CATI), which automatically coded the responses into a database.
Data regarding media consumption was collected using a four point semantic differential scale anchored by
“frequently” and “never”. Respondents were asked, “How often to the following encourage you to search for products
on a particular Internet website?” The following, Table One presents a list of message methods (PR, WOM, Internet)
and the specific media (television, radio, magazine newspaper) along with the methods.
Table One
Media and Methods Examined in Survey
The data exploring the perceptions of the
Internet Based Communications benefits and concerns regarding Internet shopping were
Banner ads
E-mail alerts regarding new on-line shopping opportunities
collected as follows: concerns were assessed on a four-
Discussion groups point scale anchored by one “A lot” and four “Not at all.”
Chat-rooms These questions addressed the consumer’s degree of
Keyword searches concern. (How concerned are you about return policies
Traditional Advertising Media
when shopping on-line?) The benefits and attributes were
Television advertisements assessed on a five point scale anchored by one “very
Magazine advertisements important” and five “not at all important.” They
Newspaper advertisements. examined the importance of the attributes to the
Public Relations Media
consumer. (Example: How important is seeing a picture
Articles in newspapers of an item before you purchase it?)
Articles in magazines
News and feature items on television. METHODOLOGY
Word Of Mouth
Recommendations from friends or family members. The purpose of the study is to demonstrate a
methodology to develop an “ideal” marketing communi-
cations mix. The idea was that there are underlying
25
4. The Journal of Applied Business Research – Spring 2005 Volume 21, Number 2
segments based on media consumption. To identify these segments cluster analysis was performed on the data
collected regarding the consumers consumption of media. K-means cluster analysis since the data was interval level
(Chaturvedi, Carroll,Green & Rotondo ,1997). Through an iterative process that sought to identify a managerially
useful cluster solution while minimizing the iteration history a three cluster solution was determined to be best.
Univariate anova’s were examined and mean differences were found among the segments. To further demonstrate the
validity of the segments discriminant analysis was conducted to profile the segments and determine if the segments
were unique enough to develop classificatory functions.
In order to profile the segments Multiple Correspondence Analysis using Homals in SPSS was conducted.
MCA allows the joint representation of contingency table data in perceptual space. It therefore provides an easily
interpreted perceptual map that jointly shows the relationship between the categorical variables not available through
the traditional method of using Chi-Squares on a bi-variate level of analysis. (Hair, Anderson Tatham and Black 1998;
Javalgi Whipple and McManamon, 1992)
Then to test whether differences existed among the segments regarding message content, the primary
benefits and concerns about online shopping were examined using discriminant analysis. This allows for the
examination of the differences at the variable level (the univariate F tests) and as a group (the wilkes lambda for the
function). The following are the results.
RESULTS
Demographics
As Table Two indicates, the respondents mirror the e-commerce literature regarding the profile of the
consumer. They tend to be younger with over 50 percent between 25 and 44; better educated, 58 percent were college
graduates and/or had post graduate education; with a better income, 55 percent reported a household income of at least
$50,000 dollars. The sample diverged from the literature in that there is a 50/50 split based on gender. This 50/50
split was done purposefully at the client’s request. Table Two details the demographic profile of the respondents.
Table Two
Demographics of Respondents
Computer Usage
Age # % Gender # %
Ninety-three percent of e-commerce
18-24 29 9% Male 154 50%
25-34 82 27% Female 154 50% consumers have access to the Internet at home, of
35-44 90 39% which 25 percent have access at home only and 58
45-54 71 23% percent have access at both home and work.
55-64 27 9%
65 up 5 2% Eighty three percent of the respondents
Na 4 1% identify themselves as either frequent or occasional
Education purchasers of products or services on-line. The nine
Highest level attained # % percent that indicate they never purchase products or
services had previously identified themselves as on-line
Less than high School 4 1% consumers. These respondents may subscribe to
High School Graduate 50 16% websites or web-based information systems (services
Some College/Technical School 71 23%
College Graduate/Post Graduate 178 58%
were not defined and this may have led to the
Na 5 2% confusion).
Income
(Household) # % While the majority, 80 percent, of the
respondents placed less than 20 orders within the past year,
Under $30,000 24 8% 47 percent of the respondents spent over $500 dollars in
$30,000-$50,000 68 22% that same period of time. Christmas and birthdays were the
$50,000-$100,000 107 35% occasions for which consumers noted they most frequently
Over $100,000 60 20%
shopped on-line. Data detailing respondents computer
Dk/Na/Rf 49 16%
usage and buying habits is depicted in Table Three.
26
5. The Journal of Applied Business Research – Spring 2005 Volume 21, Number 2
Table Three
E-commerce Access and Behavior
K-Means cluster analysis was conducted on the media
Respondents have access to the internet at… consumption variables to determine if there were underlying
segments that could be efficiently targeted with the media plan.
%
Home 107 35% This approach has been noted as appropriate for market
Work 22 7% segmentation (Chaturvedi, Carroll, Green and Rotondo, 1997;
Both 179 58% Schaffer and Green, 1998). A three cluster solution was chosen
None 0 0 because it had cluster memberships that divided the sample into
How many orders have you placed on-line in the past year? approximately thirds that were internally homogeneous and
externally heterogeneous. The clusters were then validated
% using multiple discriminant analysis. Tables Four through Six
Less than 10 105 47% provide the results of the cluster analysis and the validation of
11-20 73 33%
21-50 27 12% the clusters.
Over 50 19 8%
Cluster Analysis Results
How much money have you spent in on-line purchases?
% Table Four presents the results of the k-means cluster
Less than $100 27 12% analysis. The three cluster solution has 144 members in the first
$101-$500 91 41% group, 83 members in the second group and 81 members of the
$501-$1000 45 20% third. Convergence was achieved at the 13th iteration with a
over $1000 60 27%
minimum distance between the initial cluster centers of 8.367.
*Note there were 224 respondents who answered the This fulfills the criteria for a managerially useful solution (Hair
questions presented in table two. et al. 1998). There are three segments each representing
approximately 1/3 of the respondents and which are also distinct
in their media consumption.
Prior Probabili ties for Groups
Cases Used in Analy sis
Clust er Number of Case Prior Unweighted Weighted
1 .468 144 144.000
2 .269 83 83.000
3 .263 81 81.000
Total 1.000 308 308.000
Table Four
Results of K means Cluster Analysis
Variable Final Cluster Centers
Recommendations 1.77 1.67 2.65
Banner Ads 3.02 2.93 3.80
Articles in Magazines 2.60 1.74 3.05
Articles in Newspapers 3.50 1.88 3.27
Television Ads 2.46 2.06 3.63
Newspaper Ads 3.52 2.01 3.60
Magazine Ads 2.65 1.92 3.24
Chat-rooms 3.73 3.60 4.00
Keyword Search 1.83 2.51 3.16
News Items on TV 2.41 2.04 3.51
E-mail Ads 2.73 2.88 3.70
Discussion Groups 3.65 3.42 3.84
27
6. The Journal of Applied Business Research – Spring 2005 Volume 21, Number 2
a
Iteration History
Change in Cluster Centers
Iterat ion 1 2 3
1 4.282 4.168 4.645
2 .280 .290 .445
3 .134 6.555E-02 .241
4 .107 2.989E-02 .143
5 6.128E-02 2.294E-02 4.706E-02
6 7.566E-02 2.219E-02 6.039E-02
7 7.154E-02 4.404E-02 .000
8 9.856E-02 2.488E-02 8.324E-02
9 .105 2.906E-02 7.341E-02
10 4.948E-02 .000 5.082E-02
11 3.538E-02 4.213E-02 9.923E-02
12 4.322E-02 .000 4.199E-02
13 .000 .000 .000
a. Conv ergence achiev ed due to no or sm all distance
change. The maximum distance by which any center
has changed is .000. The current iterat ion is 13. The
minimum distance between initial centers is 8.367.
Table Five
Discriminant Analysis Validation of Cluster Results
Tests of Equality of Group Means
Wilkes
Lambda F df1 df2 Sig.
Recommendations .808 36.35 2 305 .000
Banner Ads .849 27.06 2 305 .000
Articles in Magazines .688 69.28 2 305 .000
Articles in Newspapers .517 142.73 2 305 .000
Television Ads .602 100.88 2 305 .000
Newspaper Ads .429 202.65 2 305 .000
Magazine Ads .710 62.21 2 305 .000
Chat-rooms .936 10.69 2 305 .000
Keyword Search .853 26.25 2 305 .000
News Items on TV .685 20.22 2 305 .000
E-mail Ads .852 26.44 2 305 .000
Discussion Groups .948 8.34 2 305 .000
In Table Five, the results of the discriminant analysis validating the segments are presented. The results
indicate two highly significant discriminant functions with a Wilk’s lambda of .167 for the first function and a Wilk’s
lambda of .584 for the second and both functions are significant at the P < .000 level. The tests for the equality of
group means resulted in significant differences at the P< .000 level for all media consumption variables, indicating
that there are significant differences between the group means on every variable.
An examination of the validation measures in Table Six reveals that the discriminant functions successfully
classify 92.9% in the cross functional classification of grouped cases, which is a predictive validity for the
discriminant function that is much better than chance.
28
7. The Journal of Applied Business Research – Spring 2005 Volume 21, Number 2
These results indicate that there are three separate segments based on media consumption, which are
internally homogeneous and externally heterogeneous. Descriptions of the three clusters follow, with mean values
presented in parenthesis.
Ei genvalues
Canonical
Function Eigenv alue % of Variance Cumulat iv e % Correlation
1 2.506a 77.9 77.9 .845
2 .712a 22.1 100.0 .645
a. First 2 canonical discriminant f unctions were used in t he
analy sis.
Wi lks' Lambda
Wilks'
Test of Function(s) Lambda Chi-square df Sig.
1 through 2 .167 536.724 24 .000
2 .584 161.011 11 .000
Table Six
Prior Probabili ties for Groups
Cases Used in Analy sis
Clust er Number of Case Prior Unweighted Weighted
1 .468 144 144.000
2 .269 83 83.000
3 .263 81 81.000
Total 1.000 308 308.000
b,c
Classification Results
Predicted Group Membership
Clust er Number of Case 1 2 3 Total
Original Count 1 142 0 2 144
2 3 77 3 83
3 7 0 74 81
% 1 98.6 .0 1.4 100.0
2 3.6 92.8 3.6 100.0
3 8.6 .0 91.4 100.0
Cross-v alidateda Count 1 138 1 5 144
2 4 76 3 83
3 8 1 72 81
% 1 95.8 .7 3.5 100.0
2 4.8 91.6 3.6 100.0
3 9.9 1.2 88.9 100.0
a. Cross v alidation is done only f or those cases in t he analy sis. In cross v alidation, each case is
classif ied by the f unctions deriv ed f rom all cases other than that case.
b. 95.1% of original grouped cases correctly classif ied.
c. 92.9% of cross-v alidated grouped cases correctly classif ied.
29
8. The Journal of Applied Business Research – Spring 2005 Volume 21, Number 2
CLUSTER PROFILES
Cluster One: There were 144 members of Cluster One, which represents 47 percent of the sample. The
information sources that encourage this group to shop for products on a web site were: Recommendation of friends
and family (1.77) followed by keyword searches (1.82) these were frequent to occasional sources of information.
News items or features on television (2.41) and television ads (2.46) were occasional sources of information.
Magazine articles (2.60), magazine ads (2.65) and e-mail alerts regarding new on-line opportunities (2.73) were
situated between occasionally and rarely (leaning more toward rarely) encourage on-line shopping. Banner ads (3.02)
rarely encourage on-line shopping, while articles in newspapers (3.50), newspaper ads (3.52), discussion groups (3.65)
and chat-rooms (3.73) rarely to never encourage on-line shopping.
Cluster Two: With 82 members representing 27 percent of the sample, Cluster Two was the most persuaded
by the media. For Cluster Two the information sources that encourage shopping for products on the web were:
Recommendations of friends and family (1.67), followed by articles in magazines (1.74) and were both used between
frequently and occasionally. Articles in newspapers (1.88), magazine ads (1.92), newspaper ads (2.01), news items or
features on television (2.04), and finally television ads (2.06) all occasionally encourage this segment to shop on the
internet. The Internet based media were the least used by this segment and included keyword searches (2.51), e-mail
alerts regarding new on-line opportunities (2.88), and banner ads (2.93) all rarely encouraging shopping. Finally,
discussion groups (3.42) and chat-rooms rarely to never encouraged shopping.
Cluster Three: This group was the least encouraged to shop on-line by any of the media. There were 81
members representing 26% of the sample. None of the media had a response of less than 2.65 on the four point scale.
Recommendations by friends and family (2.65) occasionally to rarely impacted their on-line shopping. Articles in
magazines (3.05), keyword searches (3.16), magazine ads (3.24),and articles in newspapers (3.27) fell into the
“rarely” category. News items or features on television (3.51), newspaper ads (3.60), television ads (3.63), e-mail ads
(3.80), and discussion groups (3.84) were more closely associated with the “never” category than the “rarely”
category. Chat-rooms (4.00) “never” encouraged on-line shopping for this group.
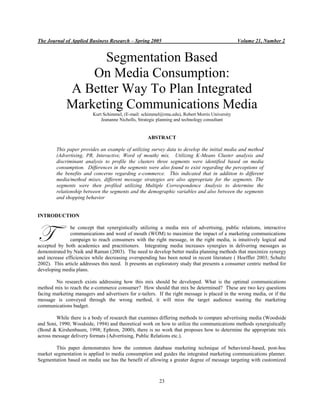
JOINT SPACE PERCEPTUAL MAPS
Joint space perceptual maps were generated by using Multiple Correspondence Analysis (HOMALS) in
SPSS. This was chosen because HOMALS provides a joint space perceptual map among the categorical variables that
is easier to interpret than traditional chi square tables showing the interrelationships among the variables.
Table Seven
Multiple Correspondence Analysis Results
CLUSTERS AND DEMO-
The MCA map represents the following variables and the three clusters.
GRAPHICS
Age Gender Education Income (Household)
18-24 1 Male 2 Less than High School 1 under 30,000 1 The map representing the
25-34 2 Female 1 High School 2 30-50,000 2
clusters and the demographic
35-44 3 Some College/Tech 3 50,-100,000 3
45-54 4 College Graduate 4
variables reveals that Cluster One
Over 100,000 4
55-up 5 was more associated with younger
respondents having a household
income in the 30-50 thousand dollar
range and are either high school graduates or have some colleges or technical school background. Cluster Two was
associated with male college graduates between the ages of 25 and 44 having a household income of over $100,000.
Cluster Three was most closely associated with older (45-64 years old) consumers and was moderately associated
with upper income respondents (it is in the same quadrant based on dimensions).
30
9. The Journal of Applied Business Research – Spring 2005 Volume 21, Number 2
Quantifications
1.5
5.00
2.00
1.0 3.00
1.00
4.00
.5 2.00
2.00
4.00 1.00
EDUCATN
0.0
4.00 3.00
3.00 1.00 1.00 CLUSTERS
Dimension 2
2.00
-.5 1.00 INCOME
2.00
AGE
-1.0 SEX
-1.0 -.5 0.0 .5 1.0 1.5 2.0 2.5
Dimension 1
Table Eight
Multiple Correspondence Analysis Results
The MCA map represents the following variables and the three clusters.
How many orders have you placed on-line in the past year? (Order #)
Less than 10 1
11-20 2
21-50 3
Over 50 4
How much money have you spent in on-line purchases? (Dollramt)
Less than $100 1
$101-$500 2
$501-$1000 3
over $1000 4
CLUSTERS AND SHOPPING
Looking at the quadrants of the perceptual map, we see that Cluster One is associated with the larger dollar
and order amounts, Cluster Two is associated with a smaller number of orders and smaller dollar amounts. Cluster
Three did not have any close neighbors on the joint map.
Message Differences
To determine if there were differences in perceptions regarding the benefits and concerns of shopping on-line
among the clusters, discriminant analysis was performed. The results indicate that there are significant differences
among the clusters with regard to these variables. This indicates that different messages within the marketing
communications mix are appropriate for the previously identified segments based on media consumption.
31
10. The Journal of Applied Business Research – Spring 2005 Volume 21, Number 2
Quantifications
2.0
4.00 3.00
1.5
4.00
3.00
1.0
.5
3.00 2.00
2.00
0.0
2.00
-.5 1.00
Dimension 2
1.00
DOLLRAMT
-1.0
ORDER#
1.00
-1.5 CLUSTERS
-2.5 -2.0 -1.5 -1.0 -.5 0.0 .5 1.0
Dimension 1
Table Nine
Concerns about on-line shopping
Standardized
Item Mean Mean Mean annonical
CL1 CL2 CL3 Wilkes Sig. Coefficients
_____________________________________________________________________________________________________
F1 F2
Concern about using credit cards for 1.53 1.93 1.68 .974 .017 .318 -.500
purchases
Delivery costs 1.63 1.86 1.88 .980 .044 .373 .547
Inconvenience of returning items 1.67 2.04 1.90 .977 .033 .271 -.192
Wait time to receive items ordered 2.06 2.40 2.14 .984 .080 .059 -.676
Inability to see feel touch or try items 2.10 2.42 2.51 .973 .015 .349 .637
May be required to pay extra taxes 2.48 2.32 2.44 .997 .640 -.469 .256
Need to write checks or money order 2.60 2.96 2.93 .983 .074 .415 .101
to send payment
Wi lks' Lambda
Wilks'
Test of Function(s) Lambda Chi-square df Sig.
1 through 2 .907 29.370 14 .009
2 .977 7.001 6 .321
There were significant differences between the clusters regarding the benefits of Internet shopping. Both
discriminant functions were significant. The first function is significant at the .001 level and the second is significant
at the .1 level. There were univariate differences between the clusters on six of the eleven variables assessing the
benefits of shopping on-line.
Differences were found in the following variables: Seeing a picture prior to purchase (P=.094) was most
associated with Cluster One. Direct shipping (P=.031) was considered most important by Cluster Two. Internet
shopping is a more efficient use of time (P=.002) was associated with Cluster Three. The ability to purchase items not
found locally (P=.005) was associated with Cluster One, as was the ability to shop 24 hours a day (P=.006) and
the availability of gift wrapping services (P=.015).
32
11. The Journal of Applied Business Research – Spring 2005 Volume 21, Number 2
Table Ten
Benefits of On-line Shopping
Standardized
Item Mean Mean Mean annonical
CL1 CL2 CL3 Wilkes F. Sig. Coefficients
F1 F2
Seeing a picture prior to purchase * 1.87 2.11 2.02 .985 .094 -.284 .418
Direct shipping * 2.15 2.28 1.91 .978 .031 .408 -.472
Free shipping * 2.16 2.43 2.19 .986 .118 .182 .005
Wider variety to choose from * 2.19 2.42 2.21 .987 .136 .209 .049
More efficient use of time * 2.27 2.61 2.07 .959 .002 .614 -.040
Sales or discounts available * 2.26 2.46 2.36 .992 .282 -.065 .096
Ability to Purchase items not found 2.26 2.70 2.33 .965 .005 .143 .420
locally *
Ability to shop 24 hours a day * 2.38 2.78 2.31 .967 .006 .247 .342
No interaction with salespeople * 3.26 3.31 3.16 .998 .730 .019 -.276
Free gift with purchase * 3.58 3.79 3.58 .993 .333 .070 . 250
Gift wrapping services * 3.79 3.98 4.22 .973 .015 -.671 .440
Wi lks' Lambda
Wilks'
Test of Function(s) Lambda Chi-square df Sig.
1 through 2 .846 50.301 22 .001
2 .942 17.886 10 .057
Differences also exist among the variables addressing the concerns regarding on-line shopping. The first
function is significant at the .05 level, however the second was not significant. The univariate tests revealed
significant differences on six of the seven variables.
There were differences among the clusters regarding the concerns of on-line shopping on the following
variables. Concern about using credit cards for purchases (P=.017), delivery costs (P=.044), inconvenience of
returning items (P=.033), wait time to receive items ordered (P=.080), inability to see feel touch or try items (P=.015),
need to write checks or money orders to send payment (P=.074) were all variables were most strongly associated with
Cluster One.
IMPLICATIONS OF CLUSTER PROFILES
There were three clearly defined segments based on the reported impact of the media in initiating on-line
shopping. The first segment indicated that the recommendations of family and friends and searching the net through
keyword searches are the only information sources that impact their shopping behavior occasionally. This group was
most associated with having placed more orders on-line and also having spent larger amounts of money on-line.
Demographically, this group is younger and has a household income of $35,000-$50,000. Educationally they have
completed high school and have some college or technical school or have completed college.
This segment considered all of the variables addressing the concerns about on-line shopping as more
important than the other segments. They also considered several benefits as more important that the other two
segments. The benefits were the ability to see a picture prior to purchase, to have access to items not found locally,
the ability to shop 24 hours a day; and the availability of gift wrapping services.
The second segment was the most influenced by the media. Seven information sources influenced their on-
line shopping occasionally. These are, in order of importance: recommendations of friends and family, keyword
searches, articles in magazines, articles in newspapers, magazine ads, news or features on television and television
33
12. The Journal of Applied Business Research – Spring 2005 Volume 21, Number 2
ads. This group was middle aged and had household incomes of over $100,000. They tended to have spent less on on-
line purchases than segment one and placed fewer orders on-line. Direct shipping was more important to this segment
than the other segments.
The third segment represented the oldest consumers of the three segments and was not closely associated
with a level of shopping or spending on the Internet. They did not indicate they were influenced by any of the media
sources of information and only rarely influenced by the recommendation of friends and family along with articles in
magazines and keyword searches. This segment indicated the benefit of Internet shopping being a more efficient use
of time was more important to them than the other segments.
RESULTING STRATEGY
Based on these results, it was suggested to the e-tailer to focus its resources on creating positive WOM and
PR. Since these were the most effective at stimulating on-line shopping. A very aggressive, targeted PR campaign was
initiated and targeted niche magazines serving the e-tailer’s niche. Feature stories were also generated for broadcast
media. Advertising was used as a support media after the PR started a buzz within the target audience. On-line media,
such as banner ads and e-mail were used after the public relations buzz created the positive WOM and generated e-tail
store traffic. It was recommended that the flow to the web site be mapped (using cookies) and banners and reciprocal
links be placed along the common paths.
The web page itself had an opt in e-mail program set up. After the e-tailer’s opening, the media were again
evaluated and the mix adjusted based on the CPI and ROI similar to the method suggested by Woodside.
The message strategies also differed across the segments. A core primary message was crafted and utilized
for consistency. The secondary and supporting messages within the ads or PR placements were targeted at the first or
second segment based on the media method being utilized.
LIMITATIONS/FUTURE RESEARCH
As with all studies, there are several limitations to this research. While the study demonstrates how to
develop a data driven IMC campaign, the results can not be generalized across industries or even outside of the e-
tailer’s niche. The purpose was not to develop definitive segments for targeting, rather it was to demonstrate how
customized IMC media and method mixes can be developed.
Another limitation of the study is the number of respondents in the data sample. Future studies should
employ larger data sets. In this case, budgetary constraints precluded the collection of a larger sample size.
Additional studies are needed to explore how to compare the results of the PR and WOM with the advertising
results and determine the increased impact this synergy creates. Research should focus on determining the appropriate
measures to compare WOM and PR to be compared with advertising and what level reach and frequency with the
combined methods are sufficient to generate the desired results for the e-tailer.
CONTRIBUTIONS TO LITERATURE
This paper makes several contributions to the literature. The results demonstrate that customizable IMC
plans can be developed based on media consumption, with targeted media and message strategies flowing from the
segments. The paper also demonstrates that media consumption can be used as a basis for segmentation. The
segments differed not only in media consumption patterns but also regarding the perceptions of the benefits and
concerns of internet shopping. This information was utilized to craft messages within the media. Finally, the research
also presents an overview of a technique to develop the initial message and media mix in an IMC campaign.
34
13. The Journal of Applied Business Research – Spring 2005 Volume 21, Number 2
CONCLUSION
This paper has demonstrated that segmentation based on media consumption is a viable method to develop an
integrated marketing communications campaign. The segments were not only robust and useful for developing media
strategies but differences were also found between the segments regarding potential message content dealing with the
benefits and concerns of internet shopping.
REFERENCES
1. Abe, M., (1997). “A Household-Level Advertising Exposure Model,” Journal of Marketing Research. 34 3
394-405.
2. Bond, G. & I. Brace (1997). “Segmenting by attitudes to TV advertising – eye opener or blind alley?”
Journal of the Market Research Society. 19 3 481-508.
3. Bond, J. & R. Kirshenbaum (1998). Under the Radar an ADWEEK Book, John Wiley and Sons 605 Third
Ave. New York NY 10158-0012.
4. Broadbent, S., J. Z. Spittler & K. Lynch (1997). “Building Better TV Schedules: New Light from single
source data.” Journal of Advertising Research 37, 4 27-31.
5. Bruner, G. and A. Kumar (2000). “Web Commercials and Advertising Hierarchy of Effects Journal of
Advertising Research 40 1/2 35-43.
6. Chaturvedi, A., J.D. Carroll, P. Green & J.A.Rotondo (1997). “A feature-Based Approach to Market
Segmentation Via Overlapping K-Centroids Clustering.” Journal of Marketing Research .34, 3, 370-377.
7. Davis B., W. Donnelly, (1996) Media Planning: Strategy and Imagination, Prentice Hall Upper Saddle River
NJ
8. Erwin E. (2000) “A new media-mix strategy,” Advertising Age vol 71 iss 9 10-13.
9. Gibson, L. (1996). “What can one TV exposure do?” Journal of Advertising Research 36 2 9-19.
10. Hair, J. R. Jr., R. Anderson, R. Tatham and W. Black (1998).Multivariate Data Analysis 5th ed. Prentice Hall
Upper Saddle River NJ
11. Harris, T. (1994) PR gets personal Direct Marketing vol 56 iss 12 29-33.
12. Harvey, B. (1997). “The expanded ARF model: Bridge to the accountable advertising future,” Journal of
Advertising Research .37, 2, 11-21.
13. Hoeffler, S. E. (2003). “Notion of ad overspending lessons with integrated communications” Marketing
News. 37, 34, 30.
14. Hutton, J. G (1996) “Integrated marketing Communications and the Evolution of Marketing Thought”
Journal of Business Research 37 155-162.
15. Javalgi, R., T. Whipple, M. McManamon (1992). “Hospital Image: A Correspondence Analysis Approach”
Journal of Health Care Marketing 12 4 34 -41
16. Kim, C. R. (2002). “Identifying viewer segments for television programs.” Journal of Advertising Research
42 1 51-66.
17. Korgaonkar, P., R. Silverblatt and B. O’Leary (2001). “Web advertising and Hispanics.” Journal of
Consumer Marketing 18 2 134-152.
18. Leckenby, J. and J. Hong (1998). “Using Reach/Frequency for Web Media Planning.” Journal of Advertising
Research 38 1 7-20
19. Lloyd, D. and K. J. Clancy (1991) “CPMs versus CPMIs: Implications for media planning” Journal of
Advertising Research 31 4 34 –45.
20. Masterson, P. (1999) The Wearout phenomenon Marketing Research 11 3 26-31.
21. Moriarity S. (1994). “PR and IMC: The benefits of integration” Public Relations Quarterly vol 39 iss 3 38-
45.
22. Naik, P. and K. Raman (2003) “Understanding the impact of synergy in multimedia communications”
Journal of Marketing Research 40, 4 375.
23. Puth, G., P. Mostert and M. Ewing (1999). “Consumer perceptions of mentioned product and brand attributes
in Magazine advertising” Journal of Product and Brand Management 8 1 38-49.
35
14. The Journal of Applied Business Research – Spring 2005 Volume 21, Number 2
24. Rossiter J. R. and Percy l. (1997). Advertising Communications and Promotions Management McGraw Hill
New York NY.Schaffer, C. and P. E.Greene. (1998). “Cluster-based market segmentation: some further
comparisons of alternative approaches.” Journal of the Market Research Society 40 2 155-163.
25. Schultz, D. and P. Kitchen (1997) Integrated Marketing Communications in U.S. Advertising Agencies: An
exploratory study. Journal of Advertising Research 7-18.
26. Schultz, Don (2003) Outdated approach to planning needs revamping. Marketing News 36 23 6-7.
27. Schultz, D. E., S. Tannenbaum and R. Lauterborn (1993) Integrated Marketing Communications: Putting it
together and making it work Lincolnwood IL NTC Business Books.
28. Sissors, J. and L. Bumba (1996) Advertising Media Planning NTC Business Books Lincolnwood IL 5th ed.
29. Smith, E. and P. C. Neijens (2000) “Segmentation based on affinity for advertising” Journal of Advertising
Research 40 4 35-43.
30. Taylor, J. (1993) How to develop a successful advertising plan Chicago NTC Business Books
31. Wansink, B. and S. B. Park (2000) “Methods and measures that profile heavy users” Journal of Advertising
Research 40 4 61-72.
32. Woodside, A. G. and P.K. Soni (1990) “Performance Analysis of Advertising in Competing Media Vehicles”
Journal of Advertising Research 30 1 53-66.
33. Woodside A. G. (1994). “Modeling linkage-advertising: Going beyond better media comparisons.” Journal
of Advertising Research july aug 22-31
34. Zeff, R. and B. Aronson (1999) Advertising on the Internet 2nd ed. Wiley Computer Publishing 605 Third
Ave. New York NY
36