SlideShare ist ein Scribd-Unternehmen logo
1 von 30
Downloaden Sie, um offline zu lesen
DESIGNING
                                      FOR
                                    CLIMATE


                             Residential Design in the Tropics

                                         Martin Clark
                                        BA GradDipTP

                                  Original Edition 12/10/1993
                                     Revised 26/09/2006

The original of this document was prepared as lecture notes for the Bachelor of Construction
Management course at James Cook University, Department of Civil and Systems
Engineering, 1992. The author was formerly a Lecturer in Architecture and Building at the
Papua New Guinea University of Technology, and at James Cook University of North
Queensland. He is currently the Building and Urban Design Officer at Thuringowa City
Council, NQ.

The contents of this document are the work and opinions of the author and do not necessarily
reflect the policy of the Council.

The above JCUMetSat image reproduced by permission of James Cook University.

Unless otherwise indicated, all other text and images are the work of the author and are
copyright. The material contained in this document may be reproduced in whole or in part for
academic or research purposes, PROVIDED the source is credited in the usual manner. No
part of this document may be published for personal or corporate gain, scanned, or reverse-
engineered, without the prior written agreement of the author.

The author can be contacted at:
troppo19@hotmail.com or
martinc@thuringowa.qld.gov.au
DESIGNING FOR CLIMATE - 1

                                           CLIMATE


This section is based largely on Manual of Tropical Housing and Building : Part 1 Climatic
Design (see references).

Climate may be defined as "an integration in time of the physical states of the atmospheric
environment, characteristic of a certain geographical location". Tropical climates are those
in which heat is the dominant problem, and where, at least for a substantial part of the year,
buildings serve to keep the occupants cool, rather than warm, and the annual mean
temperature is not less than 20°C.

The earth receives almost all its energy from the sun in the form of radiation, and the sun is
the dominant influence on climate. This radiation can be classified as ultra-violet radiation, of
higher frequency and shorter wavelength, which causes photochemical effects, bleaching,
sunburn, etc; visible light radiation, and infra-red radiation of longer wavelength, producing
radiant heat and some photo-chemical effects.

The spectral distribution varies with altitude, due to the filtering effect of the atmosphere. The
intensity of radiation reaching the upper atmosphere can vary ±2% due to variations in the
output of the sun itself, and ±3.5% due to variations in the sun/earth distance.

The earth rotates around the sun in a slightly elliptical orbit, and rotates on its own axis at an
angle to this orbit of 66.5°. Therefore the area of the earth's surface receiving maximum
solar intensity varies throughout the year, as each hemisphere in turn is inclined toward the
sun, and the hours of daylight and darkness also vary. The areas of maximum intensity move
between the Tropic of Cancer and the Tropic of Capricorn each 23.5° north and south of the
equator (e.g. 90° minus 66.5°).

The intensity of sunlight reaching a given point on the surface of the earth is affected by
three factors:

1. The Cosine Law; the intensity reaching an inclined surface is equal to the normal intensity
   multiplied by the cosine of the angle of incidence. This decreases as the light approaches
   the poles.


2. Atmospheric depletion; the absorption of radiation by ozone, vapours and dust particles;
   the lower the solar angle, the longer the path through the atmosphere. Depletion varies by
   a factor of between 0.2 and 0.7.

3. Duration of daylight hours.
The amount of heat absorbed by the earth is balanced by a corresponding heat loss. Without
this loss, the temperature would continue to rise, and the planet would soon cease to be able
to support most forms of life.

This heat loss is produced by three processes:
(1) long-wave re-radiation: about 84% of this is absorbed in the atmosphere, 16% escaping
    to space.
(2) Evaporation: as surface water changes into vapour and mixes with air, surface cooling
    occurs.
(3) Convection: air heated by contact with the surface becomes lighter and rises to the
    upper atmosphere.

These convection currents are one of the causes of winds. The main factor influencing the
direction of principal winds is the Coriolis Effect. This is a phenomenon caused by the
tendency of the atmosphere to 'slip' relative to the rotation of the earth. The resultant of the
thermal force and the Coriolis Effect creates the Trade Winds - the north-east trades in the
northern tropics, the south-east trades in the southern tropics, and the westerlies in the
temperate zones. The location of wind zones changes with the seasons, roughly following
maximum solar heating.

Winds (and weather) can be affected by the interaction of global patterns, and regional
patterns created by the sun's differential heating effect on land, forest, and water, and more
locally, by topography. Human activity can therefore have an effect on climate, both
negatively and positively.

[This paper does not deal with issues of alleged global warming or the “greenhouse effect”.
The author’s attitude on this subject remains sceptical. On a global basis the continual
depletion of forests, and the dumping of combustion gases into the atmosphere, is hardly
likely to be harmless. We cannot continue to consume the current finite sources of energy
and need to develop alternative renewable solutions – rapidly.

 Whether the current perceived global warming trend has been induced by man or is part of a
long-term cyclical pattern remains to be proved. It should be noted that the polar ice caps on
Mars appear to be shrinking – and that cannot be the result of human activity !! ]


                                  CLIMATIC INDICATORS

These are principally temperature, humidity, precipitation, sky condition, solar radiation, and
intensity and direction of winds.

Temperature is usually expressed as a monthly mean, but average monthly maximum and
minimum values may be preferable.

Humidity is the amount of water vapour present in the air. The amount of moisture the air
can hold varies with temperature. Usually the indicator used is relative humidity, which is the
ratio of the actual moisture present to the amount of moisture the air is capable of holding at
the same temperature, expressed as a percentage. RH is established by the use of the wet
and dry bulb hygrometer. This consists of two mercury thermometers side by side. The first
measures the air (dry bulb) temperature (DBT). The second bulb is covered by a wick which
is kept wet. As moisture evaporating gives a cooling effect, the wet bulb temperature (WBT)
will be less than DBT. Evaporation is faster in dry air, producing a more pronounced
difference between WBT and DBT, or wet bulb depression. In the case of 100% RH the
temperatures will be the same, as no evaporation takes place. Given the two values, RH can
be read from a psychrometric chart. Another device for measuring RH is the hygrograph,
which produces a paper plot (or A/D computer file) or RH values over time.

[There are now electronic devices which are capable of measuring humidity, however, the
terminology developed for the older analog devices is retained.]
RH is likely to be at its highest in most climates just before sunrise. The minimum value
usually occurs around 1500 hrs and this is frequently used as the indicator value.

Precipitation, which includes rain, hail and dew, is measured in mm/time units, using a rain
gauge. Data are collated in a form which indicates the pattern of dry and wet seasons. Also
useful are 'ever recorded' maxima and minima, and maxima in any 24 hr period, which will
provide degrees of deviation from average, and prediction factors for flooding.

Building designers also need to know the probability of intense periods of rain being
associated with strong winds, in order to predict the degree of exposure to driving rain.

Sky condition is usually indicated in terms of the degree and frequency of cloud cover, and
may be used in calculations of luminance of daylight factors for building interiors, and also
for decisions on shading devices.

The SI standard for measuring solar radiation is the watt per square metre.(w/m2). Solar
radiation values will be required for estimation of the amount of heat reaching the inside of a
building envelope. A simple sunshine recorder produces a burn track on a cylinder of paper
each time the sun is exposed, but a wide range of more sophisticated devices are now used.

Wind Velocity is measured with anemometers, using propeller type blades or cups. Direction
is recorded by a wind vane. These can be recorded on paper or by computerised A/D
systems. Values (usually meters/second) are taken at (or calculated to) a height of 10
meters in flat open country. Directions are usually grouped into 8 or 16 categories,
corresponding to the 8 cardinal or semi-cardinal compass points, and the 8 tertiary points.

Wind charts or roses are used to plot the force, percentage frequency and direction of winds
for any given location.

In addition to the above, indicators may be required for phenomena which are infrequent,
irregular, but significant, e.g. tropical cyclones.

                                TROPICAL CLIMATE TYPES

It is not possible to define accurately the boundary between climatic zones, as variations are
usually gradual, but it is usually possible to define which zone, or area of transition, a
particular site lies in. In 1953 G.A. Atkinson developed a classification based on two factors,
temperature and humidity, which has since become widely accepted.

Atkinson defined three major zones and three sub-groups:

(1) Warm/humid equatorial; sub-group warm/humid island or trade wind climate.

(2) Hot/dry desert or semi-desert; sub-group hot dry maritime desert.

(3) Composite or monsoon climate; sub-group tropical island climate.

Warm humid climates occur in a belt extending roughly 15° either side of the equator.
There is very little seasonal variation, other than the amount of rain, which is high throughout
the year, and the incidence of gusty winds and electric storms. Mean maximum DBT is
between 27 and 32°C. Night minimum varies between 21 and 27°. RH is usually high at
around 75%, but may vary between 55 and 100%. Sky conditions are fairly cloudy throughout
the year, although luminance can vary considerably. Solar radiation is partly reflected and
partly scattered by cloud and the high humidity. The latter also reduces outgoing radiation.
Wind velocities are generally low. Vegetation grows quickly, and the high humidity
encourages mould, algae and rusting. Mosquitos, usually malarial, and other insects abound.

Warm humid island climates differ from the above in that nighttime temperature minima
may be slightly lower, and humidity is more variable. Skies are more likely to be clear, and
solar radiation stronger and more direct. Winds are frequently constant at 6-7m/s, and
provide relief from temperature and humidity. Salt in the atmosphere encourages corrosion.
The greatest difference is the risk of cyclonic winds, which are frequent, unmitigated, and
destructive. Precipitation may be less, but deluges are similar.

Hot dry desert climates occur in two belts between 15 and 30° N/S. There are two seasons,
one hot, one cooler. DBT maxima range from 43-49°C in the hot season and 27-32° in the
cool. Night mean minima are 24-30° hot, 10-18° cool. RH varies from 10% to 55%.
Precipitation is slight and variable. Flash storms may occur, although droughts of several
years are possible. Sky conditions are normally clear, with limited luminance which may be
further reduced by dust storms. High glare and luminance may be caused by white dust
haze. Solar radiation is strong but long wave re-radiation releases heat at night into the cold
sky. Winds are usually local and turbulent. High day temperatures and rapid night cooling
may cause materials to break up.

In maritime desert climates the DBT maxima are usually lower, but humidity tends to
remain high, due to evaporation from the sea. These climates are generally regarded as
among the most uncomfortable. Kuwait is an example, also the dry tropics region of North
Queensland in a ‘dry’ wet season.

Composite or monsoon climates usually occur in large land masses near the tropics of
Cancer and Capricorn. Approximately 2/3rds of the year is hot/dry, and the other third is
warm/humid. Localities further north and south sometimes have a third season of cool/dry.
Typical DBT values are:

                          hot.dry          warm/humid                cool/dry
Day mean max              32-43            27-32                     up to 27
Night mean max            21-27            24-27                     4-10

RH is 20-55% during dry seasons, and 55-95% during the wet. Monsoon rains can be heavy
and prolonged. Annual rainfall varies between 500-1300mm, with little or no rain during the
dry season.

Sky conditions vary considerably with the seasons; heavily overcast and dull during
monsoons, clear and dark blue during the dry. Glare increases towards the end of the dry
season, due to dust haze. Solar radiation varies accordingly. Winds are hot and dusty during
the dry season, and steady, humid and often strong during the monsoon. Seasonal changes
in RH tend to weaken building materials. Termites are common.

Tropical Upland Climates, i.e. mountain and plateau, around 900-1200m + above sea
level, have a composite climate. DBT maxima and minima vary with altitude, and the range
increases with distance from the equator. Humidity may vary between 45 and 99%. When
the sky is clear, radiation is stronger than at sea level, but radiation loss at night may result in
fog.

                        NORTH QUEENSLAND COASTAL CLIMATE

This has characteristics of the composite climate and of the warm/humid island climate. The
warm/humid period is similar in nature and duration to the composite type, although the
associated period of high rainfall is more variable. The source of rainfall may be the north
west monsoons, but rain is frequently brought by cyclonic or semi-cyclonic activity,
originating in the Solomon Sea and moving south west into the Coral Sea. The remaining
2/3rds of the year may be described as warm/dry. Precipitation tends to be higher north of
Ingham, and humidity slightly higher and less subject to seasonal variation. Solar radiation
values vary between 400 and 600 w/m2, compared to 350-850 for south west Queensland.
Average daily hours of sunshine varies between 6 and 8 for January and 8-9 for July. Wind
data collected at Willis Island (16°8'S/150°E) show a predominance of easterlies and south
east trades. On the coast, these are modified by coastal breezes; on-shore winds tend to
dominate in the afternoons due to differential heating of land and sea masses. These are
fairly constant from the north-east and east, with an overall frequency of 50%, and strength
mainly in the 5-10m/s band.
Centres inland from the coast tend to show higher DBT maxima and minima, lower
precipitation and lower mean RH. Locations such as Mount Isa have more in common with
dry desert climates than other types.

The diagrams below show the general division between arid and humid in Australia.

                Arid                                      Humid


                                      MICROCLIMATE

Variations may occur in the climate of a particular location within a broad climatic zone, due
to local factors such as topography, ground surface conditions and the nature and distribution
of 3-dimensional objects. The term microclimate can be applied to a city or a single shrub,
so the building designer tends to use the term site climate under which to assess the local
variations in climate which have a bearing on design.

For a large project covering an extensive area, it may well be worthwhile to undertake
extensive evaluation of local conditions. On small sites, where there is less scope for
variations in siting and orientation, this exercise will be more limited, but some consideration
of local climatic patterns will always be justified.

Temperature
It is, or should be, common knowledge that temperature tends to decrease with altitude.
During the day, the ground absorbs solar radiation and the air in contact with the ground
reaches the highest temperature. From about 2m a.g.l. the air is stratified in layers of
differing temperatures. However, as the warmest air is also lighter, eddies of air movement
take place. After nightfall, the temperature of the ground drops to below that of the air, and
temperature inversion occurs. Turbulence is absent, and the coldest air remains at ground
level. This may flow and collect in pockets, like a highly viscous liquid. Certain land forms
can produce a concentrated flow, in the form of a katabatic wind.

Sites at, say, 300m above the surrounding area may show very little temperature variation,
relative to the variation at normal ground level. A height of 7-8m a.g.l. may result in a
difference of 5-6° in temperature.

Humidity
Height has a similar effect on humidity. At ground level, during the day, RH rapidly
decreases. If moisture is available in the form of water or rich vegetation, strong evaporation
may increase AH. At night the situation is reversed; as the lowest level cools its RH rapidly
increases, and condensation may occur if the saturation point is reached. The above,
together with the termite problem, explains the development of the traditional stilt house in
the region, and its modern counterpart, the high-set.


Precipitation
When moisture-laden winds come into contact with rising ground, the effect on precipitation
may be considerable. Differences in excess of 300m will produce greater than average
rainfall, and the difference between windward and leeward sides can be as much as 4:1. This
effect is nowhere more significant than in eastern Australia, where rain precipitated on the
Dividing Range, the height of which is insignificant by international standards, has a major
effect. The run-off eastwards can be collected for use on the coastal belt. Water percolating
into the ground is carried along the rock strata westward, into the artesian basins, and can
be tapped many hundreds of kilometres inland from its source, and eastward to the coast.
Towns and cities may also produce climatic effects. The height and density of absorbent
surfaces may cause warm updrafts; dust and pollution may alter local thermal effects, and
heat is vented from a/c systems. The RH is usually lower. Run-off problems are usually
greater, and winds may be lower, or may double, depending on the degree to which urban
forms set up barriers or cause acceleration. Conversely, thick, managed vegetation may
have an effect if it brings the cooler layer boundary lower. The "million trees for Townsville"
policy if pursued, could have an effect on the local climate. Generally, the temperature in
conurbations can be up to 8% higher than that of the surrounding area.

Trees and shading topography will obviously affect the amount of solar radiation reaching the
site; sites sloping towards the equator and west will receive significantly higher radiation.

Air Movement
Natural and man-made barriers affect wind speeds. A long horizontal barrier can reduce the
wind speed by 25 - 50% at a distance of 20 times the height. Wind speed is always lower at
ground level, and with uneven terrain, in addition to normal frictional effects. Cyclones, for
example, rarely penetrate more than 50km inland as a destructive force, but may speed up
again if they move out to sea. The greatest wind speeds occur on the crest of hills, and there
may be a considerable diminution on the leeward side. Valleys have differing effects,
depending on their nature and the wind direction; some may provide shelter, with lower
velocities, others may funnel the wind and intensify the effect. A model of the effects of
topography on wind has yet to be developed, and future research may focus on this. Damage
resulting from cyclones often shows considerable variation; well-constructed buildings can be
completely destroyed, while older dilapidated buildings perhaps only 200m away survive
undamaged.

Large expanses of water may produce coastal breezes which can reduce the temperature by
as much as 10°C, but are likely to increase humidity.

Other local effects may include electric storms, which should be considered for tall buildings
or ridge-top sites. Variations in the electrical properties of the atmosphere may also be
regarded as climate. There is evidence that excessively positively charged air causes
discomfort, whether it is generated by electrical appliances or synthetic fabrics in indoor
environments, or by external climatic conditions. One reason why the aftermath of a
thunderstorm is refreshing is that it restores the balance of charge of the atmosphere to
negative. Air passing over or through water has a similar effect, which is one reason why
fountains and waterfalls are a feature of ornamental gardens from Morocco to Japan. Hot dry
desert winds are often associated with effects ranging from discomfort to lunacy, because of
their high positive charge. It is important to limit excess positive charge in artificial climates,
and/or to reduce it using devices such as ionisers. Some locations seem to suffer
disproportionately from electrical imbalance, e.g. Geneva in Switzerland, which given its
lakeside and mountain location, might be expected to have a good balance.

Hot dry climates usually produce dust storms at some time of the year, and local storms of
the "willy-willy" type may occur, due to hot ground air bursting through the cooler layers, with
a whirlpool action, carrying dust particles with them. There is some evidence (chiefly from
the United States) that they can be caused by large trucks or road trains passing each other
at high speeds on desert roads.

Vegetation
In forming an additional layer between earth and sky, trees and vegetation transfer the point
of contact to a higher level. Apart from the benefit of shade, some radiation is diverted to
photochemical processes, which alters all the values, usually towards greater comfort. In hot
dry climates the effect is usually considerable.

Existing natural vegetation is also useful as an indicator of local climatic conditions, and
should be assessed to see if it confirms or contradicts general climatic data.
Comfort
Human beings can tolerate a fairly wide range of climatic conditions, but comfort in the
climatic sense involves more than just avoiding the extremes of freezing to death and dying
of heat exhaustion. Comfort depends on more than temperature; air temperature, humidity,
radiation and air movement all produce thermal effects. Most climatic comfort indicators are
objective, i.e. they can be measured, and acceptable ranges established quantitatively.
Noise comfort indicators can be established quantitatively, at least with regard to pain
thresholds and levels of exposure causing long-term damage. Subjective indicators are
however no less important; sub-damage noise, space, visual interest, colour, defensibility,
and sensory deprivation and overload all have an effect.

Body Heat
Heat is continuously produced by the body due to metabolism, or the processes of food
conversion and tissue building. Additional heat is produced by muscular activity, which varies
from 70 watts while sleeping to 1100 watts for maximum heavy manual work. Of all the heat
produced, 20% is utilised, and 80% must be dissipated, in order to maintain deep body
temperature at 37°C. Any heat gained from the environment and from solar radiation must
also be dissipated. The body can lose heat by convection, radiation and evaporation, and to
a lesser extent by conduction.

Convection is produced when heat is transferred from the body to the air adjacent to the skin
or clothing, which rises and is replaced by cooler air. Radiant heat loss depends on the
temperature of the body surface and the temperature of opposing surfaces. Evaporative heat
loss depends on the rate of evaporation which depends on the humidity of the air.
Evaporation takes place in the lungs and on the skin as perspiration.

Vasomotor adjustments continually balance temperature by varying the flow of blood to the
skin surface. If normal adjustments are insufficient sweating will occur in hot climates and
shivering (which causes a rapid increase in metabolic heat production) in cold ones. Some
aclimatisation occurs with movement between climates.

In temperate climates, it is rarely difficult to dissipate surplus heat; the most common
problem is the prevention of excessive heat loss.

In hot climates, as air temperature approaches skin temperature convective heat loss
gradually diminishes. When air temperature equals or exceeds skin temperature, heat loss
will still take place by evaporation, even at RH around 90%, provided some air movement is
present, as this will remove the fully saturated air from around the body. If this air movement
is not present, and RH is near 100%, heat loss by evaporation will not take place, and if the
condition is prolonged, heat stroke will occur. It is very rare for this condition to occur in
natural environments, as even in the warmest and most humid climates, maximum RH
usually occurs in the morning and evening, whereas maximum temperature occurs in the
mid-afternoon, when RH is usually at its lowest. However, it is easy to produce hazardous
effects in badly designed and managed buildings.

Another significant factor is clothing; a person wearing cotton underwear and a business suit
(or its equivalent) will require a temperature about 9° lower than the naked body. Age, sex,
body type and diet also influence the range of acceptable temperatures. Where radiant heat
is concerned, the different skin colours show no net advantage. Dark skin absorbs heat much
more readily than light skin, but is also much more able to emit heat. The advantage of dark
skin is that it contains a greater amount of melanin, which protects against the damaging
effects of ultra-violet rays.

Even under conditions which do not threaten life, considerable loss of efficiency may be
experienced. It is also evident that some methods of providing comfort may induce stress,
such as unvarying air conditioning or high air velocities produced by mechanical air pumping.

Indicators of effective temperature have been developed which attempt to reduce all the
variables to a single scale. None of these has been found to be applicable in all situations.
The bioclimatic chart below shows the result of studies by Olgyay in Australia, and identifies
a comfort zone of value combinations which have been found to be acceptable.


The comfort zone can be pushed up by the presence of air movement, but lowered by higher
levels of radiation. The results were obtained from a study of men in sedentary occupations,
wearing 1 clo of clothing (suit, cotton underwear) in a warm climate.

Other Factors
Building designers must also give consideration to the selection of materials, particularly with
regard to thermal performance. This topic is discussed further below.
DESIGNING FOR CLIMATE - 2
                                         VENTILATION

There are a number of design configurations which make use of air movement to assist
climate control in buildings.

The greatest pressure on the windward side of a building is generated when the elevation is
at right angles to the wind direction. It follows that a wind incidence of 45° would reduce the
pressure, and hence the indoor velocity, by 50%. However, this is not necessarily the case. If
large openings are placed on the leeward side, a greater velocity of air flow and less
attenuation will be achieved, producing a broader area of negative pressure on the outlet
side, and hence increased internal airflow due to the suction effect. This is often referred to
as the Venturi Effect.


                                             a<b

This effect will probably only occur if there are large openings on the downwind side. If more
conventional openings exist, it will probably be better to set the building at right angles to the
prevailing wind, but the benefit of negative pressure will probably be enhanced if the
downwind openings are larger than on the side facing the wind. If there is a conflict between
the optimum orientation for sunshading, and the direction of the prevailing wind, it is probably
preferable to give priority to orientation relative to the sun.

The positioning of windows, the nature of elevations, the disposition of internal divisions, and
the position of external obstructions all affect the passage of air through enclosed spaces.


If buildings are laid out on a regular grid, the benefit of wind may be lost altogether. If
buildings are staggered, and preferably spaced at least 50m apart, then the flow of air may
be maintained, and the wind shadow reduced.
The following diagrams illustrate the effect of various configurations and types of obstruction
on the internal flow of air. Note that the objective is to produce maximum flow through the
area at body height, rather than across the floor or over the ceiling.

A. An obstruction set at a distance from the window is likely to produce a more even spread
of air movement through the room.


B. A barrier such as a tree may cause acceleration of air underneath it, with a wider band of
moving air beyond.


C. The combination of a tree and a hedge, for example, may have the effect of reversing the
flow of air.


D. External obstructions may also be used to re-direct the flow of air, where the main
windows do not face the flow of air.
E. This can also be effected by the way the windows open.


F. Louvres are a useful way of maximising the flow of air through openings, and are
generally more efficient than casement windows in this respect. However, louvres (and other
windows for that matter) usually have to be closed if there is wind-driven rain. A number of
louvre types have been evaluated to determine whether the system can be used to admit a
flow of air, but at the same time exclude rain. Of the types shown below (C being the
conventional louvre) only D showed any capacity to keep out rain - at the cost of significantly
reducing airflow.


The flow of air through windows is also affected by the nature and position of sunshading. A
hood projecting outwards from above the window will tend to direct the flow of air downwards.
This can be corrected by leaving a gap between the inner edge of the screen and the wall
above the window.

G. Airflow through a building may be promoted through the use of high-level vents facing
downwind – sometimes referred to as the Bernoulli Effect. Air passing over the roof creates
a negative pressure zone on the leeward slope of the roof. If this zone is open to the interior
of the building, the difference in pressure will cause air to be drawn from the interior.
The same phenomenon provides ‘lift’ above the rear of an aircraft wing.

This type of device can be used in situations where airflow is absent at ground level due to
obstructions or the density of development, and the airflow is ‘skimming’ at roof level.
Convective airflow will also occur if there is a temperature differential, but the pressure
differential is likely to be the most effective.

Target Winds

Since the most uncomfortable weather usually occurs on summer afternoons, the “target
winds” for the Townsville region are the north-easterlies, being the most reliable winds at this
time (60% probability). The Wind Roses below (generated by Ecotect) indicate the situation
for the region.
A north-easterly wind at 30km per hour (black shading) represents around 8m per second.

It should be noted that these wind speeds, probabilities and directions are based on average
readings at the weather station located at Townsville airport. The values are fairly reliable for
the coastal plains, but may be varied further inland by obstructions and topography. In the
Upper Ross (Rasmussen, Keslo) for example, the north-easterlies tend to be more northerly,
due to the airflow being ‘turned’ by the Mount Louisa range, and the effect of Mount Stuart.
DESIGNING FOR CLIMATE - 3

                                        SUNSHADING

Buildings should generally be designed using materials which limit the transfer of heat from
solar radiation into the building.

There is an advantage in using low thermal capacity, lightweight materials, which, although
they absorb heat readily, also lose heat rapidly, so that living spaces cool down after sunset.
Masonry block walls should if possible be shielded from the sun because although they gain
heat slowly, they may act as a store of heat during the night. Insulation in the roof space of
lightweight structures may also be counter-productive, in that although it reduces solar gain,
it also prevents the dissipation of heat from within the building, including that generated by
people, cooking, etc. High level ventilators combined with high or 'cathedral' ceilings will
help maintain convection heat loss. Roof ventilators are also effective in venting warm air.

Tall buildings can be designed to make use of the 'stack effect', whereby warm - and hence
lighter - air is encouraged to rise in an internal multi-storey 'chimney', venting at roof level
and drawing air in from below. This works well with buildings of three or more storeys, but is
unlikely to be significant in a conventional domestic building.

Orientation should generally be east-west to present the smallest faces of the building
towards the lower angle sun.

                                          WINDOWS

Windows allow a view of the outside world, and provide natural ventilation and light. They
are also a major source of solar heat gain and glare if subject to direct sunlight.
Consideration must be given to the positioning of windows, relative to the path of the sun
throughout the year. Various methods can be employed to calculate the position of the sun
throughout the year. Calculations may be made, and most textbooks on climatic design
outline the method. A number of textbooks also provide solar protractors, in the form of a
plastic film which can be placed directly onto plans and elevations. Computer programs are
available which calculate the bearing and angle of the sun given latitude and longitude of the
site, and time zone. These values can then be used to calculate the effect of the sun on
windows, and allows for the detailed design of sunshading.

The diagram below illustrates the path of the sun at different times of the year in the southern
hemisphere. It is possible in tropical and sub-tropical zones that the worst problem arises
during the spring and autumn, when the solar angle is more oblique. It should also be noted
that in the tropical summer, the sun will at some time shine on all the elevations of a building.
The table below shows solar angle and bearing for Townsville for December and June. The
angles shown are the solar altitude angle which is the vertical angle at the point of
observation between the horizon plane and the line connecting the sun with the observer,
and the solar azimuth angle (bearing) which is the angle at the point of observation
measured on a horizontal plane between the northerly direction and a point on the horizon
circle, where it is intersected by the arc of a vertical circle, going through the zenith and the
sun's position.

The table below gives values for Townsville calculated using my software package,
Sunpath. The values can be used to design sunshading devices using drawings, as in the
diagram following.

Data for Townsville                              Data for Townsville
Latitude 19.25 S.                                Latitude 19.25 S.
Longitude 146.77 E.                              Longitude 146.77 E.
Hours ahead of GMT = 10                          Hours ahead of GMT = 10
Date : 22nd Jan                                  Date : 22nd Jun
Sunrise 5    54 Sunset 18                 52     Sunrise 6    49 Sunset 17                 39

*****       Sun Positions           *****        *****        Sun Positions           *****

Time      Altitude      Bearing                  Time      Altitude      Bearing
 6          1.14        110.67                    6        -10.72         68.71
 7         14.57        106.32                    7          2.27         64.16
 For additional locations and                     buy a copy of my software !
 Values …
16         39.29        259.66                   16              20.38             305.41
17         25.43        256.55                   17               8.35             298.51
18         11.77        252.85                   18              -4.40             293.33


Sunshading devices can also be designed using various forms of solarscope, such as the
simple design below. This allows 'point' sun positions to be projected onto a model of a
building (or a single elevation).

More sophisticated (and expensive) devices can provide a dynamic sunpath across a model.
This task is now largely undertaken using computer software, such as AutoCAD or Ecotect.
Development of a sunpath model using AutoCAD would require skills in 3D modelling and a
mastery of sun path geometry. Ecotect on the other hand has a built-in model-building tool
along with solar and weather data for most locations including Townsville, and data on the
thermal properties of common materials. The learning curve remains fairly steep, and some
designers still prefer a sunpath calculator together with experimentation using model
elevations, as a means to arrive at a satisfactory design.


The sunshading device shown below excludes all direct sunlight, but admits some reflected
light which is directed up to the ceiling.


If the ground outside is reflective (eg paving or grass), this can cause glare. The device
above would permit through movement of air, and allow a view of the outside space. The
device below would exclude all sunlight, at the expense of obstructing the view and reducing
ventilation. A traditional form of louvred window has glass louvres at the top, a fixed glass
panel centre, and opaque (usually steel or timber) louvres at the bottom. The two sets of
louvres can be manipulated to control airflow, and the lower set will largely exclude heat gain
reflected from external ground.
The solution illustrated above is seldom necessary, even for a window facing directly west.
An adjustable version would be preferable. It is not usually necessary to exclude early
morning sun (eg the first 15°) on the grounds of solar gain alone. Few buildings have an
unobstructed horizon, and external features can be used to limit direct sunlight and at the
same time allow a view of the outside space.


As an adjunct to or replacement of sunshade devices, tinted glass may be considered. This
should preferably be incorporated in the glass rather than applied as a film. The first level of
tinting makes a noticeable difference, and the best (and most expensive) ‘Green Glass’
reduces solar gain to a negligible level. Tinting may now be required under the Building Code
– see below.

Overhangs will also assist in protecting windows from solar gain, and provide a fixing point
for screens, or window hoods can be added individually. If space and cost permits,
verandahs on all or the most exposed elevations are the best option.
DESIGNING FOR CLIMATE - 4

           THE 'STACK' EFFECT, ‘COOL POOLS’ AND ELEVATED FLOORS

Ventilation is concerned with the supply of fresh air, and, in hot climates, the promotion of
convective cooling, by the movement of air at a relatively slow rate. The motive force can be
either thermal or dynamic (wind), the latter being discussed above.

The stack effect relies on thermal forces, set up by density difference (caused by
temperature differences), between the outdoor and indoor air, and air at a lower level relative
to air at a higher level. It can occur adjacent to an open window, where warmer air may flow
out of the top part of the window, and cooler air may be drawn in at the bottom. Floor-to-
ceiling windows with fixed lights in the middle and louvres at the top and bottom, are
designed to exploit this potential. The principle is the same as for wind generation, and of
course wind can be used to assist the effect.

Special provision can be made for the effect by the installation of ventilating shafts. The
higher the shaft, the greater the cross-sectional area, and the greater the temperature
difference, the greater the motive force, and therefore the more air will be moved.

The motive force is the 'stack' pressure multiplied by the area (Newtons x area in m2). The
formula is:
Ps = 0.042 x h x T
Where Ps = stack pressure in N/m2
        h = height of stack in m
        T = temperature difference in ºC
(the constant is N/m3ºC)
Such shafts are used for internal ventilation in cooler climates where the temperature
difference in winter is fairly large;


The same principle can be used in tropical buildings to promote vertical air movement;


The volume of air passing up through the central well can be drawn in at the bottom corner of
the wall of each room facing the well, and discharged through openings at the top of the
same wall. Arrangements such as that shown above can provide a comfortable even
temperature without the use of air-conditioning, providing the well or shaft is large enough
and high enough, and the intakes and exits are designed to maximise the effect of prevailing
winds.

It is sometimes suggested that the traditional Queenslander house style, with cathedral
ceilings of up to 4m, is intended to use this phenomenon, but in most cases the opening at
the top and the height of the stack is insufficient to promote any significant cooling through
the stack effect alone. Any benefit probably derives from the Bernoulli Effect described
above.

                                       COOL POOLS

Evaporative cooling produced by the passage of air over water has been utilised since
earliest times, using ponds, lakes, fountains, etc. or more ingenious devices such as air
scoops in which a porous clay water pot is placed so that the passing air comes into contact
with a continual supply of water droplets. This is the basic method used in the modern
evaporative cooling system, except that the water is now dripped through a screen
suspended in the air flow. Evaporative cooling is less effective when the air is very humid,
and most effective when the moving air is hot and dry.

However, cool pools, if large enough, can have a significant effect, and may not in fact have
to contain water to work. If moving air can be funnelled through a space which is out of the
direct sun, it will lose some of its heat before reaching the building. Verandahs can act as
simple cool pools as well as shading devices.

In some large institutional buildings, use has been made of the mass of the structure and the
landscaping around it to channel moving air along a path which increases its velocity,
removes heat gain from the sun, and produces evaporative cooling. A good example is the
Baha'i Temple at Bahapur, outside New Delhi, India. This is a complex concrete shell
structure which is a place of assembly, but does not utilise air-conditioning, even though a
hot dry wind blows through the area for a significant period during the year. The wind is
funnelled over embankments, and, in the case of the prevailing wind, over standing water
which is below natural ground level. It then passes through the openings around the base of
the dome, and rises up through the interior.


'Cool pool' effects can of course be enhanced with mechanical assistance, producing a
reasonable trade-off against conventional air-conditioning systems.

Swimming pools may be located on the windward side of dwellings to provide a ‘cool pool’
airflow. There will be a trade-off here between the need to cool airflow and the need to limit
water loss by evaporation. A pool cover will diminish the effect but reduce loss by
evaporation. Providing shade-cloth or sails above the pool may represent a reasonable
compromise.

                      ELEVATED FLOOR OR SLAB-ON-GROUND?

This issue remains controversial. Traditional tropical designers favour dwellings elevated off
the ground, either low-set (1m) or high-set (2m or more). The justification for this includes:
• A building on the ground is a ‘Bluff body’. The wind must flow round it or over it. There
    may be dead zones of unmoving or slowly rotating air adjacent to walls. With an elevated
    house, the air can pass under the floor as well.
• The living areas of the house are at ground level, where the air is hottest. As noted
    above, air temperature decreases with height.
•   In an urban situation, where the density of building is more than 28%, there is a tendency
    for natural airflow at ground level to diminish, and eventually to disappear altogether. Al
    things being equal, if a house is elevated it will have better access to cooling breezes.
•   Uninsulated floors open to the airflow may be cold in the early morning during cooler
    months, but cold is more of a novelty than a problem in the tropics.

The argument for slab-on-ground is that the floor has a temperature-stabilising effect. If
shielded from the sun in the hotter months, it will remain cooler than the surrounding
environment. It may absorb and retain heat during the cooler months when the solar angle is
lower, but that is assumed to be beneficial. The same argument is used to promote the
benefit of internal mass walls. The argument may be valid for temperate and even sub-
tropical environments, where cold can be a problem, but its value is doubtful here

Slab-on-ground construction is favoured over elevated floors in energy efficiency software,
including the most recent “Second Generation” software. This issue is discussed in more
detail in Part 7 below.
DESIGNING FOR CLIMATE - 5

                                    RESIDENTIAL LOTS

In recent years, there has been a trend in North Queensland housing away from traditional
building forms in favour of houses more suitable for temperate climates, e.g. slab-on-ground,
high thermal capacity enclosures (masonry exposed to the sun), full height windows, lack of
overhangs, etc. In spite of the decline in average household size, houses have tended to
become larger, while lots are getting smaller. The result has been a growing problem of hot
boxes” and “heat islands”, where spaces between buildings are impervious to winds, and a
positive feedback loop is created in which there is greater dependence on air-conditioning,
which vents to the outside, thereby making the situation worse.

Designers who are aware of these problems frequently complain that in any typical
residential subdivision, it is usual that less than 30% of lots represent a site which they are
able to provide a suitable design for.

Lot designers and buyers should consider:
• Solar orientation: the development of lots which allow dwellings to be built with optimum
    orientation for solar control and sunshading, and which allow dwellings to be built with
    roofs oriented to optimise use of photovoltaic and solar water heating facilities.
• The direction of natural airflow, particularly summer afternoon winds from the NE and
    ENE (these are the “target winds" in North Queensland, in that they are the most
    commonly occurring winds at the time when they are most needed).
• Local micro-climate and topographic effects (if any) of the site which modify standard
    characteristics
• The need to maintain, as far as practicable, air-permeability in the resulting built
    environment, with a preferred overall ratio of buildings to open space of 30% or less
• Minimisation of areas where wind shadow (air-flow skimming) will take place
• A street pattern which enhances rather than detracts from air-permeability
• Adaptation of the layout to utilise parks, drainage and other reserves to maintain air-
    permeability
• Avoidance of concentrations of small lots, fencing or other barriers perpendicular to
    target winds
• Assessment across the site of circumstances where down-wind distance from one barrier
    to the next is less than 7 times the height of the up-wind barrier.
• Possibility of off-setting parallel side boundaries to reduce wind-shadow effects (covered
    above)
• Use of building envelope plans and landscape plans to enhance climate-response
• Avoidance of 'build-to-boundary' features unless attached development is proposed.
• Use of attenuation distances rather than solid fencing for acoustic protection

EXAMPLES: Orientation


On the above plan, the lots marked A are within +/- 15° of north, and are capable of
containing a dwelling with an optimal solar aspect. Lots marked B are oriented east-west, but
are wide enough to provide for appropriate orientation. Lots marked X have an adverse
orientation, and provide little scope for adaptation.

Airflow and Barriers


Research confirms (Su San Lee below) that long horizontal barriers perpendicular to airflow,
such as solid fencing or continuous building lines, attenuates airflow for a horizontal distance
of seven times the height of the barrier. Where a second barrier occurs, airflow continues to
'skim' and does not return to the unimpeded pattern for the same seven-times-height
distance.
DESIGNING FOR CLIMATE – 6
         RECENT DEVELOPMENTS IN THURINGOWA, NORTH QUEENSLAND:
                         THE PLANNING SCHEME

The first IPA (Integrated Planning Act) Planning Scheme for the City of Thuringowa was
gazetted on 10th October 2003 and came into effect on 20th October 2003.

The Scheme, which is largely performance- rather than prescription-based, requires that
climate is considered for all forms of development, and in particular, residential
development. It contains performance criteria for climate-response in the design and
assessment of mixed residential, multi-unit and duplex dwellings, as well as single dwellings
constructed on lots less than 450m2. An innovative feature of the Scheme is the introduction
of climate-responsive design for residential lots. The Scheme is supported by Planning
Scheme Policies on Climate-Responsive Design for these forms of development, which
incorporate most of the principles outlined in this paper. The measures complement
Amendment 12 of the Building Code of Australia, which introduces energy-efficiency
requirements for residential building, and differing requirements according to Climate Zone.

In Queensland, the Scheme won the Planning Institute of Australia Award for 2003 in the
category of Urban Planning, and the Climate-Responsive Design Policies won Merit Awards
in the same category.

In 2004 the Scheme won the PIA National Award for excellence in Urban Planning.

The Planning Scheme Policy “Climate-responsive Design for Residential Lots” was the work
of this author.

The Planning Scheme Policy “Climate-Responsive Design for Housing” was the work of
Buckley Vann Consultants – Architect Caroline Stalker.

During 2003, the Council ran a Climate-Responsive Design Competition, in association with
the Housing Industry Association, and Australian Institute of Architects Queensland Division.
One of the purposes of the competition was to provide input for the development of Planning
Scheme Policies. Details of the winning entries are attached to the CRD Policy on Housing
as an Appendix “Housing Exemplars”.

Copies of the Planning Scheme, Policies, and the housing exemplars are available from the
Council’s website – see references.
DESIGNING FOR CLIMATE – 7

             CLIMATE - RESPONSE AND THE CONSTRUCTION INDUSTRY

The climate-responsive design principles outlined above tend to support the more traditional
“Queenslander” form of dwelling design, comprising elevated floors, lightweight frame and
‘free run’ ventilation. This type of dwelling is still being built. There are local designers,
architects and builders producing excellent examples of adapted traditional design. However,
most new dwellings constructed in the region are slab-on-ground, in a style more typical of
temperate- rather than tropical-climate development.


The aerial photograph above shows part of the Douglas suburb of Townsville. Ross River is
at the top (north), and James Cook University lies below the bottom of the image.

The area on the right was constructed around 20-30 years ago. Here the houses are mostly
2-storey ‘highsets’. Plot ratio (the ratio between the house area and the lot area) is around
25-30%. There is mature vegetation cover, and reasonable exposure to target winds from the
north-east, which in this location is enhanced by the river corridor.

On the left is the first stage of Delfin’s Riverside development. The house footprints are
larger, while the average lot size is smaller. The dwellings are mostly single storey, slab-on-
ground, with plot ratios much closer to the maximum of 50%. There are rows of small lots
with houses that are very close to each other, and back yard open space which in many
cases will have little or no access to the target winds. Because of the density of
development, the air will be skimming over the top. There is evidence here (confirmed by the
observations of residents) that ‘heat islands’ exist – pockets of space where the air doesn’t
move, and the resulting ambient heat is being raised by the exhaust from air-conditioning. It
should also be noted that in the older traditional area, roof colours are light, comprising
reflective unpainted zincalume or light colorbond. In the newer area there are more dark-
coloured (heat absorbing) roof surfaces.

The early stages of Delfin’s Willow Gardens development in Thuringowa was the subject of
Su San Lee’s PhD study. This established that this form of development is significantly
lacking in passive climate-response. In the course of time, Councillors in Thuringowa began
to receive complaints from residents about the heat island effect, and noise problems due to
houses being very close to each other. It was this feedback (supported by warnings from
design practitioners) which was the catalyst for the Council requiring climate-response to be
addressed in the new Planning Scheme.
It should be noted that the above implies no criticism of Delfin alone. The same situation is
occurring in many new developments in the region, and there are many reasons why this is
the case. Some derive from lack of consideration of climate-response at lot-development
stage, followed by inappropriate design of subsequent dwellings. Other reasons include the
circumstances prevailing in the construction industry, the current relatively low cost of
electricity in Queensland combined with much reduced cost of air-conditioning systems, and
the nature and level of demand in the housing market.

The nature of the market
The Townsville urban region remains one of fastest growing areas outside the south-east
corner of the State. Around 2000 houses are being built each year. The population of the
region is fairly mobile, with around a 10% p.a. turnover. There are new arrivals from ‘down
south’ who are unfamiliar with the climate, and tend to select house styles that are familiar,
but not well adapted to the local conditions.

The construction Industry and house prices
Due to pressure of demand, the rising cost of construction, the pressure on the construction
industry and shortage of skilled construction tradespersons, the cost of housing has risen
dramatically during the past 2-3 years. It is easier, and therefore cheaper, to build masonry,
slab-on-ground dwellings with conventional trussed roof frames, in a limited range of options.
Houses designed for the specific residential lot and responsive to climate and other
constraints of the lot, will cost more. Climate-response requires design and construction skills
which are in short supply. CAD/CAM (computer-aided design and manufacturing) can
produce considerable varieties in roof form and wall framing, and can reproduce traditional
forms, but at a cost in design time and resetting of assembly jigs.

Construction materials and techniques
Up until the 1970s the most common construction form was lightweight framing, using Mostly
“Maryborough” hardwood. This material is very durable; it seems to gain strength with age,
and has good resistance to insect attack. Equivalent hardwoods are available, but are
expensive, more difficult to work, and the logging of hardwoods is now generally deprecated.
Preservative-treated machine-graded pine can be used, but is still expensive, and many
practitioners (including the author) do not consider it to be a reliable substitute. Manufactured
structural timber such as “Glulam” is available but not widely used. In the experience of the
author, plywood box structural sections are easy to produce and have a high strength to
weight ratio, but are also expensive, with an added cost that engineering certification is
difficult to obtain.

Steel on the other hand has known structural characteristics and sections are dimensionally
accurate and stable. Steel is currently the only common substitute for conventional timber
framing, in the form of trussed roofs and stud walling.

Architects are now tending to favour the use of hot-formed RHS (rectangular hollow section)
to provide the primary framing for framed houses, as a portal frame system. The primary
framing if exposed is acceptable as it is in effect pre-finished. Frames are generally cut,
welded and finished off-site, with limited on-site working required. The method allows the
retention of features such as raked or cathedral ceilings and minimal wasted space in roof
voids. Although not commonly used for residential construction in the past, portal frame
systems are probably the most economical way of enclosing space.

An alternative, cheaper framing solution is to use cold-formed steel portal frame (eg ‘C’
sections) with secondary framing provided by ‘top hat’ rails – basically the form used for
Class 10 structures (sheds and the like) over about 15m2 in area. The author has assisted in
the construction of two ‘starter’ homes built using this type of construction. They are 74m2 in
area, extendable (verandahs, bedrooms), constructed by contractors to lock-up (with slab,
windows/external doors, insulation) for $25,000 each in 2004. Internal fit-out and finish,
including onsite wastewater system, is expected to be completed for a further $20 - 25,000
each. as owner/builder projects. Design details are available as a separate document from
the author’s website.
Concrete block construction remains the most common. There is nothing particularly wrong
with block in the tropics – provided it can be shielded from the sun. It is expensive to shield
all exposed walls with verandah, and with the trend to smaller lots and larger dwellings there
is rarely enough room.

Exposed block will absorb heat from the sun and re-radiate it into the interior space; in the
worst cases, continually for months. The original draft of the BCA Energy Code in 2003
contained measures that would outlaw the use of standard concrete block for external walls
in the tropics, for this reason. For obvious reasons, this was impracticable, and the measure
has been ‘deferred’. At the time of writing, there is no concrete block which has the required
insulation properties AND is also capable of the required structural performance in cyclonic
areas.

‘Free-run’ or air-conditioning?
In earlier times, it was common for dwellings to be designed for passive climate-response.
Air-conditioning was expensive, and power supplies more uncertain. However, most houses
still had at least one room air-conditioner (often in the main bedroom) for those times when it
was hot and humid, and there was no wind. This is still the case with ‘free-run’ dwellings.
However, most new houses in the region are now constructed with air-conditioning.
Installations are more energy efficient, costs are lower, power supplies are a little more
reliable, and the cost of reticulated power in Queensland is still relatively low. The BCA
Energy Code ensures that there is a least some provision for the structure to be energy-
efficient. More recent (and more dense) residential development does not have the same
level of exposure to cooling breezes, and the breezes themselves also seem to carry more
dust and pollution. The question is – how long will cheap power last?

This region is very well supplied with solar energy, but the rate of take-up for solar water-
heating has been minimal. The reason is that with the low cost of power, it took too long for
the additional cost to be recovered. The use of reticulated power for water heating is capable
of being measured through the off-peak tariff system. The figures are substantial, and as a
result, solar- or gas-assisted water heating is now mandatory for new dwellings.

It is counter-productive if savings in energy usage from more efficient water-heating is
swallowed up by greater use of air-conditioning. The deemed-to-satisfy and energy-rating
provisions in the BCA may reduce the worst practices, but do little to encourage passive
climate-response.

Energy efficiency software
Energy Rating systems such as NatHers and Bers have been in general use for assessing
energy efficiency in housing for a number of years. Most of the rating systems use the
energy rating engine CHENATH, developed by CSIRO. Most systems were based on closed
dwellings, and did not perform well in the assessment of the type of ‘free-run’ dwelling
common in the tropics. Attempts by legislators to encourage the use of energy rating systems
in the tropics were criticised by practitioners. As a result, in 2005 State and Federal agencies
and the CSIRO commenced a program to develop a “Second Generation” of energy rating
software, piloted by the Association of Building Sustainability Assessors, which inter alia
would address the objections of tropical designers. The pilot program was based on NatHers,
and the new product was NatHERS/AccuRate. Since most of the development was via the
CHENATH engine, the changes would follow through to the other products using this. I
participated in the pilot program, and my views on the outcome follow.

The new system is better than the old. The software is better at handling shading and the
properties of materials, and can take into account the benefit of natural ventilation. However,
there remain a number of anomalies which deter me from using NatHERS/AccuRate as a
primary tool for climate-responsive design:
• The system will only produce a Star Rating (1 – 10) for combined heating and cooling
    loads. It should be possible to assess rating on cooling loads alone, since these are the
    most important in the tropics. The inclusion of heating load issues is counter-productive,
in that measures for heating (which are seldom, if ever required) are prejudicial to the
    more important cooling measures.
•   There still seems to be a built-in assumption that the dwelling is ‘closed’. All ventilation
    devices must be designated as capable of being closed, in order (presumably) for air-
    conditioning to work.
•   While the inclusion of wind speed, direction and probability is potentially beneficial, it is
    easy for assessors to ‘fake’ their value, eg by assuming air movement which is precluded
    by the form of development.
•   The system will give a much higher rating for slab-on-ground than for the same building
    with an elevated floor – 5 or 6 Stars compared to 2. This appears to be ‘hard-wired’ into
    the engine, and runs contrary to empirical evidence in this region.
•   The engine cannot model some features known to be of value in tropical design, such as
    Bernoulli devices (high-level vents which operate under differential pressure produced by
    natural airflow). These will be assessed as operating under convective forces only.
•   In the case of NatHERS/AccuRate at least, modelling of the building is descriptive rather
    than graphical, and time-consuming and prone to error for even conventional dwellings.
    The software is unlikely to be efficient in modelling a complex tropical-style design.

Design Guides,          “Sustainability     Assessment”      Systems,     SmartHousing       and
Affordability:

AMCORD and the Queensland Residential Design Guidelines
Readers are advised not to use the principles outlined in AMCORD (Australian Model Code
for Residential Development). Earlier editions were seriously counter-productive where
tropical design was involved. The latest version is better, but it appears AMCORD is no
longer being updated. Some of the principles are incorporated in the “Your Home” Technical
Manual. Amcord was replaced in Queensland by the Queensland Residential Design
Guidelines, but it appears this is no longer being maintained either.

Generally, design guides are only useful if they specifically relate to tropical design, and
preferably, written by practitioners with experience in tropical design.

“Sustainability Assessment” Systems
A number of these are currently being promoted, and seek to assess dwellings against “triple
bottom line”, life cycle, environmental issues and the like. Most originate from ’down south’
and contain values which, again, are counter-productive if used in the tropics. In one system
a 200m2 house on a 400m2 lot is given a positive value, whereas experience in the tropics
shows that this type of dwelling is very likely to be a problem, particularly if surrounded by
other similar properties. Again – not recommended unless tropical design issues are
addressed.

Smart Housing
This is an initiative of the Queensland Department of Housing, and contains
recommendations for a whole range of issues relating to dwellings, such as adaptability,
internal layout which will allow for disability (eg wider corridors, lever door-handles), security
and the like. The basic ‘list’ adds very little to the total cost of the dwelling, and should
therefore be considered by even the most cash-strapped customer.

Affordability
In 2004 the Queensland Department of Housing issued an ominous report predicting major
problems with housing affordability – predictions which are turning out to be accurate. There
have recently been a number of exemplars for “sustainable dwellings” where the cost per
square metre is double that of the main housing stock. Sustainability and climate-response
have no value if the bulk of clients cannot afford the cost.
Climate-Responsive Design is about Principles, not Rules

Climate-Responsive Design includes principles such as east-west orientation, not placing
habitable areas or amenity spaces on the western side, but it must be recognised that these
are principles, not rules. Sites will have specific features or constraints which are more
important than the principles. For example:
• The western side might have a major view, eg river, hills, etc. In this case, the view wins,
    and the CRD issues must be solved another way. The western elevation needs to be
    protected, but some consideration can be given to what exists on the western boundary
    or beyond it, eg dense vegetation or a two-storey building .
• The north-east airflow is considered paramount, but if there is a major highway in close
    proximity on the north-east side, it might be better not to capture the airflow directly.
• There is little point in aiming to capture airflow directly through doors and windows if the
    airflow is skimming over the top of the building. In this case, Bernoulli vents should be
    considered.
References
Koenigsberger, Ingersoll, Mayhew and Szokolay, Manual of Tropical Housing and Building –
Part 1 Climatic Design, Longman London 1974. [Part 1 was the only part published, and is
largely the work of Steven Szokolay] (Steven was one of the judges for the Design
Competition mentioned above.) The book has been in print for some time, but in the opinion
of this author has not yet been surpassed.

Su San Lee, PhD Thesis, Natural Ventilation and Medium Density House Forms in the
Tropics, 1998, Institute of Tropical Architecture, James Cook University.

Recommended:
Australian Greenhouse Office Canberra 2001, Your Home – Design for Lifestyle and the
Future – Technical Manual. This document is in the opinion of the author the best available
at the moment. Copies are available from the Greenhouse Office, the Greenhouse website,
and possibly through Government Bookshops and branches of the Housing Industry
Association.
www.greenhouse.gov.au

HIA GreenSmart Program. This is based in part on the above, and is an accreditation
scheme for designers and other construction professionals who can advise on and apply
principles of energy-efficient and climate-responsive design. The author is an accredited
Greensmart professional.
hia.com.au/hia/channel/Builder/region/National/classification/Greensmart.aspx

The Townsville House by Townsville architect Felix Riedweg. Excellent but inexpensive
resource for the design of houses in the Townsville region. ISBN 0-646-4335-4, or purchase
direct via
felix@riedweg.com.au.

Smart Housing Queensland. Sustainable Design resource - Department of Housing.
www.housing.qld.gov.au/initiatives/smarthousing/index.htm

Affordable Housing Queensland. Affordable housing issues - Department of Housing.
www.housing.qld.gov.au/initiatives/affordable/index.htm

Square One Research. Home of Ecotect, and a resource for climate-responsive design.
www.squ1.com

Thuringowa Planning Scheme. Scheme and Policies incorporating climate-responsive
design.
www.thuringowa.qld.gov.au/council/departments/planning/

Martin Clark’s website. Contains the current copy of this document and other useful
resources.
http://people.aapt.net.au/jclark19/


                                                                               Martin Clark
                                                                               30/09/2006

Weitere ähnliche Inhalte

Was ist angesagt?

Lecture 3 - climate and architecture
Lecture 3 - climate and architectureLecture 3 - climate and architecture
Lecture 3 - climate and architectureYosef Yemane
 
Macroclimate microclimate
Macroclimate microclimateMacroclimate microclimate
Macroclimate microclimateIDEAS, Nagpur
 
B.Arch (NATA & JEE) 2014
B.Arch (NATA & JEE) 2014B.Arch (NATA & JEE) 2014
B.Arch (NATA & JEE) 2014Anindita Roy
 
Tropical Climate
Tropical ClimateTropical Climate
Tropical ClimateAaqib Iqbal
 
Human thermal comfort
Human thermal comfortHuman thermal comfort
Human thermal comfortKAPIL WADKAR
 
Designing for different climatic zones in India
Designing for different climatic zones in IndiaDesigning for different climatic zones in India
Designing for different climatic zones in IndiaGwahyulo Semy
 
Neighbourhood Design Report
Neighbourhood Design ReportNeighbourhood Design Report
Neighbourhood Design ReportAsadullah Malik
 
Lecture 2 climatic zones
Lecture 2   climatic zonesLecture 2   climatic zones
Lecture 2 climatic zonesBekark
 
Comfort in buildings
Comfort in buildingsComfort in buildings
Comfort in buildingsJasmine John
 
Building material for different climate activity
Building material for different climate activityBuilding material for different climate activity
Building material for different climate activityAmrata Yadav
 
Ventilation - Air movement
Ventilation - Air movementVentilation - Air movement
Ventilation - Air movementIDEAS, Nagpur
 
natural ventilation case study
natural ventilation case studynatural ventilation case study
natural ventilation case studyMADHUKANT SINGH
 
Climatology in architecture
Climatology in architectureClimatology in architecture
Climatology in architectureSadanand Kumar
 
Vernacular architecture of india
Vernacular architecture of   indiaVernacular architecture of   india
Vernacular architecture of indiaAr. TANIA BERA
 
Mud in architecture
Mud in architectureMud in architecture
Mud in architecturejinaljain34
 

Was ist angesagt? (20)

Lecture 3 - climate and architecture
Lecture 3 - climate and architectureLecture 3 - climate and architecture
Lecture 3 - climate and architecture
 
Macroclimate microclimate
Macroclimate microclimateMacroclimate microclimate
Macroclimate microclimate
 
B.Arch (NATA & JEE) 2014
B.Arch (NATA & JEE) 2014B.Arch (NATA & JEE) 2014
B.Arch (NATA & JEE) 2014
 
Thermal comfort in buildings
Thermal comfort in buildingsThermal comfort in buildings
Thermal comfort in buildings
 
Tropical Climate
Tropical ClimateTropical Climate
Tropical Climate
 
Human thermal comfort
Human thermal comfortHuman thermal comfort
Human thermal comfort
 
Designing for different climatic zones in India
Designing for different climatic zones in IndiaDesigning for different climatic zones in India
Designing for different climatic zones in India
 
Neighbourhood Design Report
Neighbourhood Design ReportNeighbourhood Design Report
Neighbourhood Design Report
 
Macro and micro climate
Macro and micro climateMacro and micro climate
Macro and micro climate
 
Lecture 2 climatic zones
Lecture 2   climatic zonesLecture 2   climatic zones
Lecture 2 climatic zones
 
Climatology
ClimatologyClimatology
Climatology
 
Comfort in buildings
Comfort in buildingsComfort in buildings
Comfort in buildings
 
Building material for different climate activity
Building material for different climate activityBuilding material for different climate activity
Building material for different climate activity
 
Ventilation - Air movement
Ventilation - Air movementVentilation - Air movement
Ventilation - Air movement
 
Site climate
Site climateSite climate
Site climate
 
natural ventilation case study
natural ventilation case studynatural ventilation case study
natural ventilation case study
 
Hot and dry climate
Hot and dry climateHot and dry climate
Hot and dry climate
 
Climatology in architecture
Climatology in architectureClimatology in architecture
Climatology in architecture
 
Vernacular architecture of india
Vernacular architecture of   indiaVernacular architecture of   india
Vernacular architecture of india
 
Mud in architecture
Mud in architectureMud in architecture
Mud in architecture
 

Andere mochten auch

Reglamento de Tesina - Psicología Universidad Columbia
Reglamento de Tesina - Psicología Universidad ColumbiaReglamento de Tesina - Psicología Universidad Columbia
Reglamento de Tesina - Psicología Universidad ColumbiaUniversidadColumbia
 
SPI Finestre e Persiane - Catalogo 2013
SPI Finestre e Persiane - Catalogo 2013SPI Finestre e Persiane - Catalogo 2013
SPI Finestre e Persiane - Catalogo 2013spifinestre
 
Landscape Planning for Climatic Adaptation
Landscape Planning for Climatic AdaptationLandscape Planning for Climatic Adaptation
Landscape Planning for Climatic AdaptationImad Kayyali
 
Ibm cloud service
Ibm cloud serviceIbm cloud service
Ibm cloud servicejayyoon86
 
Clip presentation 97 2003
Clip presentation 97 2003Clip presentation 97 2003
Clip presentation 97 2003maheshghone
 
Keynote - Rapid 2008
Keynote - Rapid 2008Keynote - Rapid 2008
Keynote - Rapid 2008ToddGrimm
 
James marshall math blog
James marshall math blogJames marshall math blog
James marshall math blog40475044
 
ฉันเหมือนใคร2003
ฉันเหมือนใคร2003ฉันเหมือนใคร2003
ฉันเหมือนใคร2003018311144
 
Keynote address - AMUG 2011 - Miami, Florida
Keynote address - AMUG 2011 - Miami, FloridaKeynote address - AMUG 2011 - Miami, Florida
Keynote address - AMUG 2011 - Miami, FloridaToddGrimm
 
Viagem a parnaiba
Viagem a parnaibaViagem a parnaiba
Viagem a parnaibademervalm
 
Responsabilidad legal .....
Responsabilidad legal .....Responsabilidad legal .....
Responsabilidad legal .....fkarina
 
ฉันเหมือนใคร
ฉันเหมือนใครฉันเหมือนใคร
ฉันเหมือนใคร018311144
 

Andere mochten auch (20)

Reglamento de Tesina - Psicología Universidad Columbia
Reglamento de Tesina - Psicología Universidad ColumbiaReglamento de Tesina - Psicología Universidad Columbia
Reglamento de Tesina - Psicología Universidad Columbia
 
SPI Finestre e Persiane - Catalogo 2013
SPI Finestre e Persiane - Catalogo 2013SPI Finestre e Persiane - Catalogo 2013
SPI Finestre e Persiane - Catalogo 2013
 
Tesina 2
Tesina 2Tesina 2
Tesina 2
 
Landscape Planning for Climatic Adaptation
Landscape Planning for Climatic AdaptationLandscape Planning for Climatic Adaptation
Landscape Planning for Climatic Adaptation
 
Aplicações web realtime
Aplicações web realtimeAplicações web realtime
Aplicações web realtime
 
global warming
global warmingglobal warming
global warming
 
Ibm cloud service
Ibm cloud serviceIbm cloud service
Ibm cloud service
 
Saturno
SaturnoSaturno
Saturno
 
Clip presentation 97 2003
Clip presentation 97 2003Clip presentation 97 2003
Clip presentation 97 2003
 
Keynote - Rapid 2008
Keynote - Rapid 2008Keynote - Rapid 2008
Keynote - Rapid 2008
 
James marshall math blog
James marshall math blogJames marshall math blog
James marshall math blog
 
ฉันเหมือนใคร2003
ฉันเหมือนใคร2003ฉันเหมือนใคร2003
ฉันเหมือนใคร2003
 
Od pod
Od podOd pod
Od pod
 
Keynote address - AMUG 2011 - Miami, Florida
Keynote address - AMUG 2011 - Miami, FloridaKeynote address - AMUG 2011 - Miami, Florida
Keynote address - AMUG 2011 - Miami, Florida
 
Viagem a parnaiba
Viagem a parnaibaViagem a parnaiba
Viagem a parnaiba
 
Responsabilidad legal .....
Responsabilidad legal .....Responsabilidad legal .....
Responsabilidad legal .....
 
Saturno
SaturnoSaturno
Saturno
 
Didactisch atelier 2
Didactisch atelier 2Didactisch atelier 2
Didactisch atelier 2
 
Class Management
Class ManagementClass Management
Class Management
 
ฉันเหมือนใคร
ฉันเหมือนใครฉันเหมือนใคร
ฉันเหมือนใคร
 

Ähnlich wie Residential Design Guide for Tropical Climates

Lec 1 climate & its components
Lec 1 climate & its componentsLec 1 climate & its components
Lec 1 climate & its componentsMahnoor Khawaja
 
passive design strategies in composite & warm-humid climates.
passive design strategies in composite & warm-humid climates.passive design strategies in composite & warm-humid climates.
passive design strategies in composite & warm-humid climates.Janmejoy Gupta
 
Climatologyarchitecture 140625050042-phpapp02
Climatologyarchitecture 140625050042-phpapp02Climatologyarchitecture 140625050042-phpapp02
Climatologyarchitecture 140625050042-phpapp02Ruchi Karn
 
Predicting Weather and Climate ( Including humanitarian response and Solutions )
Predicting Weather and Climate ( Including humanitarian response and Solutions )Predicting Weather and Climate ( Including humanitarian response and Solutions )
Predicting Weather and Climate ( Including humanitarian response and Solutions )Fiaz Bhuiyan
 
Weather and Climate
Weather and ClimateWeather and Climate
Weather and Climatetcooper66
 
What difference between weather and climate?
What difference between weather and climate?What difference between weather and climate?
What difference between weather and climate?Aadil Shaikh
 
Climate presentation
Climate presentationClimate presentation
Climate presentationAngy Silva
 
Climate change prediction
Climate change predictionClimate change prediction
Climate change predictioncdenef
 
climate and its types
climate and its typesclimate and its types
climate and its typessahil saifi
 
2 Introduction To Tropical Cyclones
2 Introduction To Tropical Cyclones2 Introduction To Tropical Cyclones
2 Introduction To Tropical CyclonesEcumene
 
2 introduction-to-hurricanes-1227475599659639-9
2 introduction-to-hurricanes-1227475599659639-92 introduction-to-hurricanes-1227475599659639-9
2 introduction-to-hurricanes-1227475599659639-9Moses Lutta
 
Climatology Intro.pptx
Climatology Intro.pptxClimatology Intro.pptx
Climatology Intro.pptxHarish Gupta
 
HT MOD I PPT..pptx
HT MOD I PPT..pptxHT MOD I PPT..pptx
HT MOD I PPT..pptxAlthafMk2
 

Ähnlich wie Residential Design Guide for Tropical Climates (20)

Climate vs Weather
Climate vs WeatherClimate vs Weather
Climate vs Weather
 
Lec 1 climate & its components
Lec 1 climate & its componentsLec 1 climate & its components
Lec 1 climate & its components
 
passive design strategies in composite & warm-humid climates.
passive design strategies in composite & warm-humid climates.passive design strategies in composite & warm-humid climates.
passive design strategies in composite & warm-humid climates.
 
Climatologyarchitecture 140625050042-phpapp02
Climatologyarchitecture 140625050042-phpapp02Climatologyarchitecture 140625050042-phpapp02
Climatologyarchitecture 140625050042-phpapp02
 
Predicting Weather and Climate ( Including humanitarian response and Solutions )
Predicting Weather and Climate ( Including humanitarian response and Solutions )Predicting Weather and Climate ( Including humanitarian response and Solutions )
Predicting Weather and Climate ( Including humanitarian response and Solutions )
 
Elements of climate and weather
Elements of climate and weatherElements of climate and weather
Elements of climate and weather
 
Weather and Climate
Weather and ClimateWeather and Climate
Weather and Climate
 
What difference between weather and climate?
What difference between weather and climate?What difference between weather and climate?
What difference between weather and climate?
 
Climate presentation
Climate presentationClimate presentation
Climate presentation
 
Climate change prediction
Climate change predictionClimate change prediction
Climate change prediction
 
Climate change and variability/ Abiodun Adeola
Climate change and variability/ Abiodun AdeolaClimate change and variability/ Abiodun Adeola
Climate change and variability/ Abiodun Adeola
 
Global warming
Global warmingGlobal warming
Global warming
 
Capter 5 Climate of Ethiopia and the Horn GeES 1011.pdf
Capter 5 Climate of Ethiopia and the Horn GeES 1011.pdfCapter 5 Climate of Ethiopia and the Horn GeES 1011.pdf
Capter 5 Climate of Ethiopia and the Horn GeES 1011.pdf
 
climate and its types
climate and its typesclimate and its types
climate and its types
 
Elements of climate
Elements of climateElements of climate
Elements of climate
 
Climate
ClimateClimate
Climate
 
2 Introduction To Tropical Cyclones
2 Introduction To Tropical Cyclones2 Introduction To Tropical Cyclones
2 Introduction To Tropical Cyclones
 
2 introduction-to-hurricanes-1227475599659639-9
2 introduction-to-hurricanes-1227475599659639-92 introduction-to-hurricanes-1227475599659639-9
2 introduction-to-hurricanes-1227475599659639-9
 
Climatology Intro.pptx
Climatology Intro.pptxClimatology Intro.pptx
Climatology Intro.pptx
 
HT MOD I PPT..pptx
HT MOD I PPT..pptxHT MOD I PPT..pptx
HT MOD I PPT..pptx
 

Kürzlich hochgeladen

AMERICAN LANGUAGE HUB_Level2_Student'sBook_Answerkey.pdf
AMERICAN LANGUAGE HUB_Level2_Student'sBook_Answerkey.pdfAMERICAN LANGUAGE HUB_Level2_Student'sBook_Answerkey.pdf
AMERICAN LANGUAGE HUB_Level2_Student'sBook_Answerkey.pdfphamnguyenenglishnb
 
Choosing the Right CBSE School A Comprehensive Guide for Parents
Choosing the Right CBSE School A Comprehensive Guide for ParentsChoosing the Right CBSE School A Comprehensive Guide for Parents
Choosing the Right CBSE School A Comprehensive Guide for Parentsnavabharathschool99
 
ANG SEKTOR NG agrikultura.pptx QUARTER 4
ANG SEKTOR NG agrikultura.pptx QUARTER 4ANG SEKTOR NG agrikultura.pptx QUARTER 4
ANG SEKTOR NG agrikultura.pptx QUARTER 4MiaBumagat1
 
call girls in Kamla Market (DELHI) 🔝 >༒9953330565🔝 genuine Escort Service 🔝✔️✔️
call girls in Kamla Market (DELHI) 🔝 >༒9953330565🔝 genuine Escort Service 🔝✔️✔️call girls in Kamla Market (DELHI) 🔝 >༒9953330565🔝 genuine Escort Service 🔝✔️✔️
call girls in Kamla Market (DELHI) 🔝 >༒9953330565🔝 genuine Escort Service 🔝✔️✔️9953056974 Low Rate Call Girls In Saket, Delhi NCR
 
GRADE 4 - SUMMATIVE TEST QUARTER 4 ALL SUBJECTS
GRADE 4 - SUMMATIVE TEST QUARTER 4 ALL SUBJECTSGRADE 4 - SUMMATIVE TEST QUARTER 4 ALL SUBJECTS
GRADE 4 - SUMMATIVE TEST QUARTER 4 ALL SUBJECTSJoshuaGantuangco2
 
Like-prefer-love -hate+verb+ing & silent letters & citizenship text.pdf
Like-prefer-love -hate+verb+ing & silent letters & citizenship text.pdfLike-prefer-love -hate+verb+ing & silent letters & citizenship text.pdf
Like-prefer-love -hate+verb+ing & silent letters & citizenship text.pdfMr Bounab Samir
 
Procuring digital preservation CAN be quick and painless with our new dynamic...
Procuring digital preservation CAN be quick and painless with our new dynamic...Procuring digital preservation CAN be quick and painless with our new dynamic...
Procuring digital preservation CAN be quick and painless with our new dynamic...Jisc
 
ACC 2024 Chronicles. Cardiology. Exam.pdf
ACC 2024 Chronicles. Cardiology. Exam.pdfACC 2024 Chronicles. Cardiology. Exam.pdf
ACC 2024 Chronicles. Cardiology. Exam.pdfSpandanaRallapalli
 
THEORIES OF ORGANIZATION-PUBLIC ADMINISTRATION
THEORIES OF ORGANIZATION-PUBLIC ADMINISTRATIONTHEORIES OF ORGANIZATION-PUBLIC ADMINISTRATION
THEORIES OF ORGANIZATION-PUBLIC ADMINISTRATIONHumphrey A Beña
 
Earth Day Presentation wow hello nice great
Earth Day Presentation wow hello nice greatEarth Day Presentation wow hello nice great
Earth Day Presentation wow hello nice greatYousafMalik24
 
MULTIDISCIPLINRY NATURE OF THE ENVIRONMENTAL STUDIES.pptx
MULTIDISCIPLINRY NATURE OF THE ENVIRONMENTAL STUDIES.pptxMULTIDISCIPLINRY NATURE OF THE ENVIRONMENTAL STUDIES.pptx
MULTIDISCIPLINRY NATURE OF THE ENVIRONMENTAL STUDIES.pptxAnupkumar Sharma
 
HỌC TỐT TIẾNG ANH 11 THEO CHƯƠNG TRÌNH GLOBAL SUCCESS ĐÁP ÁN CHI TIẾT - CẢ NĂ...
HỌC TỐT TIẾNG ANH 11 THEO CHƯƠNG TRÌNH GLOBAL SUCCESS ĐÁP ÁN CHI TIẾT - CẢ NĂ...HỌC TỐT TIẾNG ANH 11 THEO CHƯƠNG TRÌNH GLOBAL SUCCESS ĐÁP ÁN CHI TIẾT - CẢ NĂ...
HỌC TỐT TIẾNG ANH 11 THEO CHƯƠNG TRÌNH GLOBAL SUCCESS ĐÁP ÁN CHI TIẾT - CẢ NĂ...Nguyen Thanh Tu Collection
 
Judging the Relevance and worth of ideas part 2.pptx
Judging the Relevance  and worth of ideas part 2.pptxJudging the Relevance  and worth of ideas part 2.pptx
Judging the Relevance and worth of ideas part 2.pptxSherlyMaeNeri
 
How to Add Barcode on PDF Report in Odoo 17
How to Add Barcode on PDF Report in Odoo 17How to Add Barcode on PDF Report in Odoo 17
How to Add Barcode on PDF Report in Odoo 17Celine George
 
What is Model Inheritance in Odoo 17 ERP
What is Model Inheritance in Odoo 17 ERPWhat is Model Inheritance in Odoo 17 ERP
What is Model Inheritance in Odoo 17 ERPCeline George
 
INTRODUCTION TO CATHOLIC CHRISTOLOGY.pptx
INTRODUCTION TO CATHOLIC CHRISTOLOGY.pptxINTRODUCTION TO CATHOLIC CHRISTOLOGY.pptx
INTRODUCTION TO CATHOLIC CHRISTOLOGY.pptxHumphrey A Beña
 

Kürzlich hochgeladen (20)

AMERICAN LANGUAGE HUB_Level2_Student'sBook_Answerkey.pdf
AMERICAN LANGUAGE HUB_Level2_Student'sBook_Answerkey.pdfAMERICAN LANGUAGE HUB_Level2_Student'sBook_Answerkey.pdf
AMERICAN LANGUAGE HUB_Level2_Student'sBook_Answerkey.pdf
 
Choosing the Right CBSE School A Comprehensive Guide for Parents
Choosing the Right CBSE School A Comprehensive Guide for ParentsChoosing the Right CBSE School A Comprehensive Guide for Parents
Choosing the Right CBSE School A Comprehensive Guide for Parents
 
Model Call Girl in Tilak Nagar Delhi reach out to us at 🔝9953056974🔝
Model Call Girl in Tilak Nagar Delhi reach out to us at 🔝9953056974🔝Model Call Girl in Tilak Nagar Delhi reach out to us at 🔝9953056974🔝
Model Call Girl in Tilak Nagar Delhi reach out to us at 🔝9953056974🔝
 
ANG SEKTOR NG agrikultura.pptx QUARTER 4
ANG SEKTOR NG agrikultura.pptx QUARTER 4ANG SEKTOR NG agrikultura.pptx QUARTER 4
ANG SEKTOR NG agrikultura.pptx QUARTER 4
 
call girls in Kamla Market (DELHI) 🔝 >༒9953330565🔝 genuine Escort Service 🔝✔️✔️
call girls in Kamla Market (DELHI) 🔝 >༒9953330565🔝 genuine Escort Service 🔝✔️✔️call girls in Kamla Market (DELHI) 🔝 >༒9953330565🔝 genuine Escort Service 🔝✔️✔️
call girls in Kamla Market (DELHI) 🔝 >༒9953330565🔝 genuine Escort Service 🔝✔️✔️
 
GRADE 4 - SUMMATIVE TEST QUARTER 4 ALL SUBJECTS
GRADE 4 - SUMMATIVE TEST QUARTER 4 ALL SUBJECTSGRADE 4 - SUMMATIVE TEST QUARTER 4 ALL SUBJECTS
GRADE 4 - SUMMATIVE TEST QUARTER 4 ALL SUBJECTS
 
Like-prefer-love -hate+verb+ing & silent letters & citizenship text.pdf
Like-prefer-love -hate+verb+ing & silent letters & citizenship text.pdfLike-prefer-love -hate+verb+ing & silent letters & citizenship text.pdf
Like-prefer-love -hate+verb+ing & silent letters & citizenship text.pdf
 
Procuring digital preservation CAN be quick and painless with our new dynamic...
Procuring digital preservation CAN be quick and painless with our new dynamic...Procuring digital preservation CAN be quick and painless with our new dynamic...
Procuring digital preservation CAN be quick and painless with our new dynamic...
 
Raw materials used in Herbal Cosmetics.pptx
Raw materials used in Herbal Cosmetics.pptxRaw materials used in Herbal Cosmetics.pptx
Raw materials used in Herbal Cosmetics.pptx
 
ACC 2024 Chronicles. Cardiology. Exam.pdf
ACC 2024 Chronicles. Cardiology. Exam.pdfACC 2024 Chronicles. Cardiology. Exam.pdf
ACC 2024 Chronicles. Cardiology. Exam.pdf
 
THEORIES OF ORGANIZATION-PUBLIC ADMINISTRATION
THEORIES OF ORGANIZATION-PUBLIC ADMINISTRATIONTHEORIES OF ORGANIZATION-PUBLIC ADMINISTRATION
THEORIES OF ORGANIZATION-PUBLIC ADMINISTRATION
 
Earth Day Presentation wow hello nice great
Earth Day Presentation wow hello nice greatEarth Day Presentation wow hello nice great
Earth Day Presentation wow hello nice great
 
MULTIDISCIPLINRY NATURE OF THE ENVIRONMENTAL STUDIES.pptx
MULTIDISCIPLINRY NATURE OF THE ENVIRONMENTAL STUDIES.pptxMULTIDISCIPLINRY NATURE OF THE ENVIRONMENTAL STUDIES.pptx
MULTIDISCIPLINRY NATURE OF THE ENVIRONMENTAL STUDIES.pptx
 
HỌC TỐT TIẾNG ANH 11 THEO CHƯƠNG TRÌNH GLOBAL SUCCESS ĐÁP ÁN CHI TIẾT - CẢ NĂ...
HỌC TỐT TIẾNG ANH 11 THEO CHƯƠNG TRÌNH GLOBAL SUCCESS ĐÁP ÁN CHI TIẾT - CẢ NĂ...HỌC TỐT TIẾNG ANH 11 THEO CHƯƠNG TRÌNH GLOBAL SUCCESS ĐÁP ÁN CHI TIẾT - CẢ NĂ...
HỌC TỐT TIẾNG ANH 11 THEO CHƯƠNG TRÌNH GLOBAL SUCCESS ĐÁP ÁN CHI TIẾT - CẢ NĂ...
 
Judging the Relevance and worth of ideas part 2.pptx
Judging the Relevance  and worth of ideas part 2.pptxJudging the Relevance  and worth of ideas part 2.pptx
Judging the Relevance and worth of ideas part 2.pptx
 
How to Add Barcode on PDF Report in Odoo 17
How to Add Barcode on PDF Report in Odoo 17How to Add Barcode on PDF Report in Odoo 17
How to Add Barcode on PDF Report in Odoo 17
 
LEFT_ON_C'N_ PRELIMS_EL_DORADO_2024.pptx
LEFT_ON_C'N_ PRELIMS_EL_DORADO_2024.pptxLEFT_ON_C'N_ PRELIMS_EL_DORADO_2024.pptx
LEFT_ON_C'N_ PRELIMS_EL_DORADO_2024.pptx
 
What is Model Inheritance in Odoo 17 ERP
What is Model Inheritance in Odoo 17 ERPWhat is Model Inheritance in Odoo 17 ERP
What is Model Inheritance in Odoo 17 ERP
 
INTRODUCTION TO CATHOLIC CHRISTOLOGY.pptx
INTRODUCTION TO CATHOLIC CHRISTOLOGY.pptxINTRODUCTION TO CATHOLIC CHRISTOLOGY.pptx
INTRODUCTION TO CATHOLIC CHRISTOLOGY.pptx
 
OS-operating systems- ch04 (Threads) ...
OS-operating systems- ch04 (Threads) ...OS-operating systems- ch04 (Threads) ...
OS-operating systems- ch04 (Threads) ...
 

Residential Design Guide for Tropical Climates

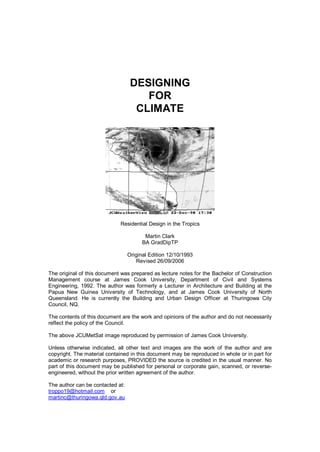
  • 1. DESIGNING FOR CLIMATE Residential Design in the Tropics Martin Clark BA GradDipTP Original Edition 12/10/1993 Revised 26/09/2006 The original of this document was prepared as lecture notes for the Bachelor of Construction Management course at James Cook University, Department of Civil and Systems Engineering, 1992. The author was formerly a Lecturer in Architecture and Building at the Papua New Guinea University of Technology, and at James Cook University of North Queensland. He is currently the Building and Urban Design Officer at Thuringowa City Council, NQ. The contents of this document are the work and opinions of the author and do not necessarily reflect the policy of the Council. The above JCUMetSat image reproduced by permission of James Cook University. Unless otherwise indicated, all other text and images are the work of the author and are copyright. The material contained in this document may be reproduced in whole or in part for academic or research purposes, PROVIDED the source is credited in the usual manner. No part of this document may be published for personal or corporate gain, scanned, or reverse- engineered, without the prior written agreement of the author. The author can be contacted at: troppo19@hotmail.com or martinc@thuringowa.qld.gov.au
  • 2. DESIGNING FOR CLIMATE - 1 CLIMATE This section is based largely on Manual of Tropical Housing and Building : Part 1 Climatic Design (see references). Climate may be defined as "an integration in time of the physical states of the atmospheric environment, characteristic of a certain geographical location". Tropical climates are those in which heat is the dominant problem, and where, at least for a substantial part of the year, buildings serve to keep the occupants cool, rather than warm, and the annual mean temperature is not less than 20°C. The earth receives almost all its energy from the sun in the form of radiation, and the sun is the dominant influence on climate. This radiation can be classified as ultra-violet radiation, of higher frequency and shorter wavelength, which causes photochemical effects, bleaching, sunburn, etc; visible light radiation, and infra-red radiation of longer wavelength, producing radiant heat and some photo-chemical effects. The spectral distribution varies with altitude, due to the filtering effect of the atmosphere. The intensity of radiation reaching the upper atmosphere can vary ±2% due to variations in the output of the sun itself, and ±3.5% due to variations in the sun/earth distance. The earth rotates around the sun in a slightly elliptical orbit, and rotates on its own axis at an angle to this orbit of 66.5°. Therefore the area of the earth's surface receiving maximum solar intensity varies throughout the year, as each hemisphere in turn is inclined toward the sun, and the hours of daylight and darkness also vary. The areas of maximum intensity move between the Tropic of Cancer and the Tropic of Capricorn each 23.5° north and south of the equator (e.g. 90° minus 66.5°). The intensity of sunlight reaching a given point on the surface of the earth is affected by three factors: 1. The Cosine Law; the intensity reaching an inclined surface is equal to the normal intensity multiplied by the cosine of the angle of incidence. This decreases as the light approaches the poles. 2. Atmospheric depletion; the absorption of radiation by ozone, vapours and dust particles; the lower the solar angle, the longer the path through the atmosphere. Depletion varies by a factor of between 0.2 and 0.7. 3. Duration of daylight hours.
  • 3. The amount of heat absorbed by the earth is balanced by a corresponding heat loss. Without this loss, the temperature would continue to rise, and the planet would soon cease to be able to support most forms of life. This heat loss is produced by three processes: (1) long-wave re-radiation: about 84% of this is absorbed in the atmosphere, 16% escaping to space. (2) Evaporation: as surface water changes into vapour and mixes with air, surface cooling occurs. (3) Convection: air heated by contact with the surface becomes lighter and rises to the upper atmosphere. These convection currents are one of the causes of winds. The main factor influencing the direction of principal winds is the Coriolis Effect. This is a phenomenon caused by the tendency of the atmosphere to 'slip' relative to the rotation of the earth. The resultant of the thermal force and the Coriolis Effect creates the Trade Winds - the north-east trades in the northern tropics, the south-east trades in the southern tropics, and the westerlies in the temperate zones. The location of wind zones changes with the seasons, roughly following maximum solar heating. Winds (and weather) can be affected by the interaction of global patterns, and regional patterns created by the sun's differential heating effect on land, forest, and water, and more locally, by topography. Human activity can therefore have an effect on climate, both negatively and positively. [This paper does not deal with issues of alleged global warming or the “greenhouse effect”. The author’s attitude on this subject remains sceptical. On a global basis the continual depletion of forests, and the dumping of combustion gases into the atmosphere, is hardly likely to be harmless. We cannot continue to consume the current finite sources of energy and need to develop alternative renewable solutions – rapidly. Whether the current perceived global warming trend has been induced by man or is part of a long-term cyclical pattern remains to be proved. It should be noted that the polar ice caps on Mars appear to be shrinking – and that cannot be the result of human activity !! ] CLIMATIC INDICATORS These are principally temperature, humidity, precipitation, sky condition, solar radiation, and intensity and direction of winds. Temperature is usually expressed as a monthly mean, but average monthly maximum and minimum values may be preferable. Humidity is the amount of water vapour present in the air. The amount of moisture the air can hold varies with temperature. Usually the indicator used is relative humidity, which is the ratio of the actual moisture present to the amount of moisture the air is capable of holding at the same temperature, expressed as a percentage. RH is established by the use of the wet and dry bulb hygrometer. This consists of two mercury thermometers side by side. The first measures the air (dry bulb) temperature (DBT). The second bulb is covered by a wick which is kept wet. As moisture evaporating gives a cooling effect, the wet bulb temperature (WBT) will be less than DBT. Evaporation is faster in dry air, producing a more pronounced difference between WBT and DBT, or wet bulb depression. In the case of 100% RH the temperatures will be the same, as no evaporation takes place. Given the two values, RH can be read from a psychrometric chart. Another device for measuring RH is the hygrograph, which produces a paper plot (or A/D computer file) or RH values over time. [There are now electronic devices which are capable of measuring humidity, however, the terminology developed for the older analog devices is retained.]
  • 4. RH is likely to be at its highest in most climates just before sunrise. The minimum value usually occurs around 1500 hrs and this is frequently used as the indicator value. Precipitation, which includes rain, hail and dew, is measured in mm/time units, using a rain gauge. Data are collated in a form which indicates the pattern of dry and wet seasons. Also useful are 'ever recorded' maxima and minima, and maxima in any 24 hr period, which will provide degrees of deviation from average, and prediction factors for flooding. Building designers also need to know the probability of intense periods of rain being associated with strong winds, in order to predict the degree of exposure to driving rain. Sky condition is usually indicated in terms of the degree and frequency of cloud cover, and may be used in calculations of luminance of daylight factors for building interiors, and also for decisions on shading devices. The SI standard for measuring solar radiation is the watt per square metre.(w/m2). Solar radiation values will be required for estimation of the amount of heat reaching the inside of a building envelope. A simple sunshine recorder produces a burn track on a cylinder of paper each time the sun is exposed, but a wide range of more sophisticated devices are now used. Wind Velocity is measured with anemometers, using propeller type blades or cups. Direction is recorded by a wind vane. These can be recorded on paper or by computerised A/D systems. Values (usually meters/second) are taken at (or calculated to) a height of 10 meters in flat open country. Directions are usually grouped into 8 or 16 categories, corresponding to the 8 cardinal or semi-cardinal compass points, and the 8 tertiary points. Wind charts or roses are used to plot the force, percentage frequency and direction of winds for any given location. In addition to the above, indicators may be required for phenomena which are infrequent, irregular, but significant, e.g. tropical cyclones. TROPICAL CLIMATE TYPES It is not possible to define accurately the boundary between climatic zones, as variations are usually gradual, but it is usually possible to define which zone, or area of transition, a particular site lies in. In 1953 G.A. Atkinson developed a classification based on two factors, temperature and humidity, which has since become widely accepted. Atkinson defined three major zones and three sub-groups: (1) Warm/humid equatorial; sub-group warm/humid island or trade wind climate. (2) Hot/dry desert or semi-desert; sub-group hot dry maritime desert. (3) Composite or monsoon climate; sub-group tropical island climate. Warm humid climates occur in a belt extending roughly 15° either side of the equator. There is very little seasonal variation, other than the amount of rain, which is high throughout the year, and the incidence of gusty winds and electric storms. Mean maximum DBT is between 27 and 32°C. Night minimum varies between 21 and 27°. RH is usually high at around 75%, but may vary between 55 and 100%. Sky conditions are fairly cloudy throughout the year, although luminance can vary considerably. Solar radiation is partly reflected and partly scattered by cloud and the high humidity. The latter also reduces outgoing radiation. Wind velocities are generally low. Vegetation grows quickly, and the high humidity encourages mould, algae and rusting. Mosquitos, usually malarial, and other insects abound. Warm humid island climates differ from the above in that nighttime temperature minima may be slightly lower, and humidity is more variable. Skies are more likely to be clear, and solar radiation stronger and more direct. Winds are frequently constant at 6-7m/s, and
  • 5. provide relief from temperature and humidity. Salt in the atmosphere encourages corrosion. The greatest difference is the risk of cyclonic winds, which are frequent, unmitigated, and destructive. Precipitation may be less, but deluges are similar. Hot dry desert climates occur in two belts between 15 and 30° N/S. There are two seasons, one hot, one cooler. DBT maxima range from 43-49°C in the hot season and 27-32° in the cool. Night mean minima are 24-30° hot, 10-18° cool. RH varies from 10% to 55%. Precipitation is slight and variable. Flash storms may occur, although droughts of several years are possible. Sky conditions are normally clear, with limited luminance which may be further reduced by dust storms. High glare and luminance may be caused by white dust haze. Solar radiation is strong but long wave re-radiation releases heat at night into the cold sky. Winds are usually local and turbulent. High day temperatures and rapid night cooling may cause materials to break up. In maritime desert climates the DBT maxima are usually lower, but humidity tends to remain high, due to evaporation from the sea. These climates are generally regarded as among the most uncomfortable. Kuwait is an example, also the dry tropics region of North Queensland in a ‘dry’ wet season. Composite or monsoon climates usually occur in large land masses near the tropics of Cancer and Capricorn. Approximately 2/3rds of the year is hot/dry, and the other third is warm/humid. Localities further north and south sometimes have a third season of cool/dry. Typical DBT values are: hot.dry warm/humid cool/dry Day mean max 32-43 27-32 up to 27 Night mean max 21-27 24-27 4-10 RH is 20-55% during dry seasons, and 55-95% during the wet. Monsoon rains can be heavy and prolonged. Annual rainfall varies between 500-1300mm, with little or no rain during the dry season. Sky conditions vary considerably with the seasons; heavily overcast and dull during monsoons, clear and dark blue during the dry. Glare increases towards the end of the dry season, due to dust haze. Solar radiation varies accordingly. Winds are hot and dusty during the dry season, and steady, humid and often strong during the monsoon. Seasonal changes in RH tend to weaken building materials. Termites are common. Tropical Upland Climates, i.e. mountain and plateau, around 900-1200m + above sea level, have a composite climate. DBT maxima and minima vary with altitude, and the range increases with distance from the equator. Humidity may vary between 45 and 99%. When the sky is clear, radiation is stronger than at sea level, but radiation loss at night may result in fog. NORTH QUEENSLAND COASTAL CLIMATE This has characteristics of the composite climate and of the warm/humid island climate. The warm/humid period is similar in nature and duration to the composite type, although the associated period of high rainfall is more variable. The source of rainfall may be the north west monsoons, but rain is frequently brought by cyclonic or semi-cyclonic activity, originating in the Solomon Sea and moving south west into the Coral Sea. The remaining 2/3rds of the year may be described as warm/dry. Precipitation tends to be higher north of Ingham, and humidity slightly higher and less subject to seasonal variation. Solar radiation values vary between 400 and 600 w/m2, compared to 350-850 for south west Queensland. Average daily hours of sunshine varies between 6 and 8 for January and 8-9 for July. Wind data collected at Willis Island (16°8'S/150°E) show a predominance of easterlies and south east trades. On the coast, these are modified by coastal breezes; on-shore winds tend to dominate in the afternoons due to differential heating of land and sea masses. These are fairly constant from the north-east and east, with an overall frequency of 50%, and strength mainly in the 5-10m/s band.
  • 6. Centres inland from the coast tend to show higher DBT maxima and minima, lower precipitation and lower mean RH. Locations such as Mount Isa have more in common with dry desert climates than other types. The diagrams below show the general division between arid and humid in Australia. Arid Humid MICROCLIMATE Variations may occur in the climate of a particular location within a broad climatic zone, due to local factors such as topography, ground surface conditions and the nature and distribution of 3-dimensional objects. The term microclimate can be applied to a city or a single shrub, so the building designer tends to use the term site climate under which to assess the local variations in climate which have a bearing on design. For a large project covering an extensive area, it may well be worthwhile to undertake extensive evaluation of local conditions. On small sites, where there is less scope for variations in siting and orientation, this exercise will be more limited, but some consideration of local climatic patterns will always be justified. Temperature It is, or should be, common knowledge that temperature tends to decrease with altitude. During the day, the ground absorbs solar radiation and the air in contact with the ground reaches the highest temperature. From about 2m a.g.l. the air is stratified in layers of differing temperatures. However, as the warmest air is also lighter, eddies of air movement take place. After nightfall, the temperature of the ground drops to below that of the air, and temperature inversion occurs. Turbulence is absent, and the coldest air remains at ground level. This may flow and collect in pockets, like a highly viscous liquid. Certain land forms can produce a concentrated flow, in the form of a katabatic wind. Sites at, say, 300m above the surrounding area may show very little temperature variation, relative to the variation at normal ground level. A height of 7-8m a.g.l. may result in a difference of 5-6° in temperature. Humidity Height has a similar effect on humidity. At ground level, during the day, RH rapidly decreases. If moisture is available in the form of water or rich vegetation, strong evaporation may increase AH. At night the situation is reversed; as the lowest level cools its RH rapidly increases, and condensation may occur if the saturation point is reached. The above, together with the termite problem, explains the development of the traditional stilt house in the region, and its modern counterpart, the high-set. Precipitation When moisture-laden winds come into contact with rising ground, the effect on precipitation may be considerable. Differences in excess of 300m will produce greater than average rainfall, and the difference between windward and leeward sides can be as much as 4:1. This effect is nowhere more significant than in eastern Australia, where rain precipitated on the Dividing Range, the height of which is insignificant by international standards, has a major effect. The run-off eastwards can be collected for use on the coastal belt. Water percolating into the ground is carried along the rock strata westward, into the artesian basins, and can be tapped many hundreds of kilometres inland from its source, and eastward to the coast.
  • 7. Towns and cities may also produce climatic effects. The height and density of absorbent surfaces may cause warm updrafts; dust and pollution may alter local thermal effects, and heat is vented from a/c systems. The RH is usually lower. Run-off problems are usually greater, and winds may be lower, or may double, depending on the degree to which urban forms set up barriers or cause acceleration. Conversely, thick, managed vegetation may have an effect if it brings the cooler layer boundary lower. The "million trees for Townsville" policy if pursued, could have an effect on the local climate. Generally, the temperature in conurbations can be up to 8% higher than that of the surrounding area. Trees and shading topography will obviously affect the amount of solar radiation reaching the site; sites sloping towards the equator and west will receive significantly higher radiation. Air Movement Natural and man-made barriers affect wind speeds. A long horizontal barrier can reduce the wind speed by 25 - 50% at a distance of 20 times the height. Wind speed is always lower at ground level, and with uneven terrain, in addition to normal frictional effects. Cyclones, for example, rarely penetrate more than 50km inland as a destructive force, but may speed up again if they move out to sea. The greatest wind speeds occur on the crest of hills, and there may be a considerable diminution on the leeward side. Valleys have differing effects, depending on their nature and the wind direction; some may provide shelter, with lower velocities, others may funnel the wind and intensify the effect. A model of the effects of topography on wind has yet to be developed, and future research may focus on this. Damage resulting from cyclones often shows considerable variation; well-constructed buildings can be completely destroyed, while older dilapidated buildings perhaps only 200m away survive undamaged. Large expanses of water may produce coastal breezes which can reduce the temperature by as much as 10°C, but are likely to increase humidity. Other local effects may include electric storms, which should be considered for tall buildings or ridge-top sites. Variations in the electrical properties of the atmosphere may also be regarded as climate. There is evidence that excessively positively charged air causes discomfort, whether it is generated by electrical appliances or synthetic fabrics in indoor environments, or by external climatic conditions. One reason why the aftermath of a thunderstorm is refreshing is that it restores the balance of charge of the atmosphere to negative. Air passing over or through water has a similar effect, which is one reason why fountains and waterfalls are a feature of ornamental gardens from Morocco to Japan. Hot dry desert winds are often associated with effects ranging from discomfort to lunacy, because of their high positive charge. It is important to limit excess positive charge in artificial climates, and/or to reduce it using devices such as ionisers. Some locations seem to suffer disproportionately from electrical imbalance, e.g. Geneva in Switzerland, which given its lakeside and mountain location, might be expected to have a good balance. Hot dry climates usually produce dust storms at some time of the year, and local storms of the "willy-willy" type may occur, due to hot ground air bursting through the cooler layers, with a whirlpool action, carrying dust particles with them. There is some evidence (chiefly from the United States) that they can be caused by large trucks or road trains passing each other at high speeds on desert roads. Vegetation In forming an additional layer between earth and sky, trees and vegetation transfer the point of contact to a higher level. Apart from the benefit of shade, some radiation is diverted to photochemical processes, which alters all the values, usually towards greater comfort. In hot dry climates the effect is usually considerable. Existing natural vegetation is also useful as an indicator of local climatic conditions, and should be assessed to see if it confirms or contradicts general climatic data.
  • 8. Comfort Human beings can tolerate a fairly wide range of climatic conditions, but comfort in the climatic sense involves more than just avoiding the extremes of freezing to death and dying of heat exhaustion. Comfort depends on more than temperature; air temperature, humidity, radiation and air movement all produce thermal effects. Most climatic comfort indicators are objective, i.e. they can be measured, and acceptable ranges established quantitatively. Noise comfort indicators can be established quantitatively, at least with regard to pain thresholds and levels of exposure causing long-term damage. Subjective indicators are however no less important; sub-damage noise, space, visual interest, colour, defensibility, and sensory deprivation and overload all have an effect. Body Heat Heat is continuously produced by the body due to metabolism, or the processes of food conversion and tissue building. Additional heat is produced by muscular activity, which varies from 70 watts while sleeping to 1100 watts for maximum heavy manual work. Of all the heat produced, 20% is utilised, and 80% must be dissipated, in order to maintain deep body temperature at 37°C. Any heat gained from the environment and from solar radiation must also be dissipated. The body can lose heat by convection, radiation and evaporation, and to a lesser extent by conduction. Convection is produced when heat is transferred from the body to the air adjacent to the skin or clothing, which rises and is replaced by cooler air. Radiant heat loss depends on the temperature of the body surface and the temperature of opposing surfaces. Evaporative heat loss depends on the rate of evaporation which depends on the humidity of the air. Evaporation takes place in the lungs and on the skin as perspiration. Vasomotor adjustments continually balance temperature by varying the flow of blood to the skin surface. If normal adjustments are insufficient sweating will occur in hot climates and shivering (which causes a rapid increase in metabolic heat production) in cold ones. Some aclimatisation occurs with movement between climates. In temperate climates, it is rarely difficult to dissipate surplus heat; the most common problem is the prevention of excessive heat loss. In hot climates, as air temperature approaches skin temperature convective heat loss gradually diminishes. When air temperature equals or exceeds skin temperature, heat loss will still take place by evaporation, even at RH around 90%, provided some air movement is present, as this will remove the fully saturated air from around the body. If this air movement is not present, and RH is near 100%, heat loss by evaporation will not take place, and if the condition is prolonged, heat stroke will occur. It is very rare for this condition to occur in natural environments, as even in the warmest and most humid climates, maximum RH usually occurs in the morning and evening, whereas maximum temperature occurs in the mid-afternoon, when RH is usually at its lowest. However, it is easy to produce hazardous effects in badly designed and managed buildings. Another significant factor is clothing; a person wearing cotton underwear and a business suit (or its equivalent) will require a temperature about 9° lower than the naked body. Age, sex, body type and diet also influence the range of acceptable temperatures. Where radiant heat is concerned, the different skin colours show no net advantage. Dark skin absorbs heat much more readily than light skin, but is also much more able to emit heat. The advantage of dark skin is that it contains a greater amount of melanin, which protects against the damaging effects of ultra-violet rays. Even under conditions which do not threaten life, considerable loss of efficiency may be experienced. It is also evident that some methods of providing comfort may induce stress, such as unvarying air conditioning or high air velocities produced by mechanical air pumping. Indicators of effective temperature have been developed which attempt to reduce all the variables to a single scale. None of these has been found to be applicable in all situations.
  • 9. The bioclimatic chart below shows the result of studies by Olgyay in Australia, and identifies a comfort zone of value combinations which have been found to be acceptable. The comfort zone can be pushed up by the presence of air movement, but lowered by higher levels of radiation. The results were obtained from a study of men in sedentary occupations, wearing 1 clo of clothing (suit, cotton underwear) in a warm climate. Other Factors Building designers must also give consideration to the selection of materials, particularly with regard to thermal performance. This topic is discussed further below.
  • 10. DESIGNING FOR CLIMATE - 2 VENTILATION There are a number of design configurations which make use of air movement to assist climate control in buildings. The greatest pressure on the windward side of a building is generated when the elevation is at right angles to the wind direction. It follows that a wind incidence of 45° would reduce the pressure, and hence the indoor velocity, by 50%. However, this is not necessarily the case. If large openings are placed on the leeward side, a greater velocity of air flow and less attenuation will be achieved, producing a broader area of negative pressure on the outlet side, and hence increased internal airflow due to the suction effect. This is often referred to as the Venturi Effect. a<b This effect will probably only occur if there are large openings on the downwind side. If more conventional openings exist, it will probably be better to set the building at right angles to the prevailing wind, but the benefit of negative pressure will probably be enhanced if the downwind openings are larger than on the side facing the wind. If there is a conflict between the optimum orientation for sunshading, and the direction of the prevailing wind, it is probably preferable to give priority to orientation relative to the sun. The positioning of windows, the nature of elevations, the disposition of internal divisions, and the position of external obstructions all affect the passage of air through enclosed spaces. If buildings are laid out on a regular grid, the benefit of wind may be lost altogether. If buildings are staggered, and preferably spaced at least 50m apart, then the flow of air may be maintained, and the wind shadow reduced.
  • 11. The following diagrams illustrate the effect of various configurations and types of obstruction on the internal flow of air. Note that the objective is to produce maximum flow through the area at body height, rather than across the floor or over the ceiling. A. An obstruction set at a distance from the window is likely to produce a more even spread of air movement through the room. B. A barrier such as a tree may cause acceleration of air underneath it, with a wider band of moving air beyond. C. The combination of a tree and a hedge, for example, may have the effect of reversing the flow of air. D. External obstructions may also be used to re-direct the flow of air, where the main windows do not face the flow of air.
  • 12. E. This can also be effected by the way the windows open. F. Louvres are a useful way of maximising the flow of air through openings, and are generally more efficient than casement windows in this respect. However, louvres (and other windows for that matter) usually have to be closed if there is wind-driven rain. A number of louvre types have been evaluated to determine whether the system can be used to admit a flow of air, but at the same time exclude rain. Of the types shown below (C being the conventional louvre) only D showed any capacity to keep out rain - at the cost of significantly reducing airflow. The flow of air through windows is also affected by the nature and position of sunshading. A hood projecting outwards from above the window will tend to direct the flow of air downwards. This can be corrected by leaving a gap between the inner edge of the screen and the wall above the window. G. Airflow through a building may be promoted through the use of high-level vents facing downwind – sometimes referred to as the Bernoulli Effect. Air passing over the roof creates a negative pressure zone on the leeward slope of the roof. If this zone is open to the interior of the building, the difference in pressure will cause air to be drawn from the interior.
  • 13. The same phenomenon provides ‘lift’ above the rear of an aircraft wing. This type of device can be used in situations where airflow is absent at ground level due to obstructions or the density of development, and the airflow is ‘skimming’ at roof level. Convective airflow will also occur if there is a temperature differential, but the pressure differential is likely to be the most effective. Target Winds Since the most uncomfortable weather usually occurs on summer afternoons, the “target winds” for the Townsville region are the north-easterlies, being the most reliable winds at this time (60% probability). The Wind Roses below (generated by Ecotect) indicate the situation for the region.
  • 14. A north-easterly wind at 30km per hour (black shading) represents around 8m per second. It should be noted that these wind speeds, probabilities and directions are based on average readings at the weather station located at Townsville airport. The values are fairly reliable for the coastal plains, but may be varied further inland by obstructions and topography. In the Upper Ross (Rasmussen, Keslo) for example, the north-easterlies tend to be more northerly, due to the airflow being ‘turned’ by the Mount Louisa range, and the effect of Mount Stuart.
  • 15. DESIGNING FOR CLIMATE - 3 SUNSHADING Buildings should generally be designed using materials which limit the transfer of heat from solar radiation into the building. There is an advantage in using low thermal capacity, lightweight materials, which, although they absorb heat readily, also lose heat rapidly, so that living spaces cool down after sunset. Masonry block walls should if possible be shielded from the sun because although they gain heat slowly, they may act as a store of heat during the night. Insulation in the roof space of lightweight structures may also be counter-productive, in that although it reduces solar gain, it also prevents the dissipation of heat from within the building, including that generated by people, cooking, etc. High level ventilators combined with high or 'cathedral' ceilings will help maintain convection heat loss. Roof ventilators are also effective in venting warm air. Tall buildings can be designed to make use of the 'stack effect', whereby warm - and hence lighter - air is encouraged to rise in an internal multi-storey 'chimney', venting at roof level and drawing air in from below. This works well with buildings of three or more storeys, but is unlikely to be significant in a conventional domestic building. Orientation should generally be east-west to present the smallest faces of the building towards the lower angle sun. WINDOWS Windows allow a view of the outside world, and provide natural ventilation and light. They are also a major source of solar heat gain and glare if subject to direct sunlight. Consideration must be given to the positioning of windows, relative to the path of the sun throughout the year. Various methods can be employed to calculate the position of the sun throughout the year. Calculations may be made, and most textbooks on climatic design outline the method. A number of textbooks also provide solar protractors, in the form of a plastic film which can be placed directly onto plans and elevations. Computer programs are available which calculate the bearing and angle of the sun given latitude and longitude of the site, and time zone. These values can then be used to calculate the effect of the sun on windows, and allows for the detailed design of sunshading. The diagram below illustrates the path of the sun at different times of the year in the southern hemisphere. It is possible in tropical and sub-tropical zones that the worst problem arises during the spring and autumn, when the solar angle is more oblique. It should also be noted that in the tropical summer, the sun will at some time shine on all the elevations of a building.
  • 16. The table below shows solar angle and bearing for Townsville for December and June. The angles shown are the solar altitude angle which is the vertical angle at the point of observation between the horizon plane and the line connecting the sun with the observer, and the solar azimuth angle (bearing) which is the angle at the point of observation measured on a horizontal plane between the northerly direction and a point on the horizon circle, where it is intersected by the arc of a vertical circle, going through the zenith and the sun's position. The table below gives values for Townsville calculated using my software package, Sunpath. The values can be used to design sunshading devices using drawings, as in the diagram following. Data for Townsville Data for Townsville Latitude 19.25 S. Latitude 19.25 S. Longitude 146.77 E. Longitude 146.77 E. Hours ahead of GMT = 10 Hours ahead of GMT = 10 Date : 22nd Jan Date : 22nd Jun Sunrise 5 54 Sunset 18 52 Sunrise 6 49 Sunset 17 39 ***** Sun Positions ***** ***** Sun Positions ***** Time Altitude Bearing Time Altitude Bearing 6 1.14 110.67 6 -10.72 68.71 7 14.57 106.32 7 2.27 64.16 For additional locations and buy a copy of my software ! Values … 16 39.29 259.66 16 20.38 305.41 17 25.43 256.55 17 8.35 298.51 18 11.77 252.85 18 -4.40 293.33 Sunshading devices can also be designed using various forms of solarscope, such as the simple design below. This allows 'point' sun positions to be projected onto a model of a building (or a single elevation). More sophisticated (and expensive) devices can provide a dynamic sunpath across a model. This task is now largely undertaken using computer software, such as AutoCAD or Ecotect.
  • 17. Development of a sunpath model using AutoCAD would require skills in 3D modelling and a mastery of sun path geometry. Ecotect on the other hand has a built-in model-building tool along with solar and weather data for most locations including Townsville, and data on the thermal properties of common materials. The learning curve remains fairly steep, and some designers still prefer a sunpath calculator together with experimentation using model elevations, as a means to arrive at a satisfactory design. The sunshading device shown below excludes all direct sunlight, but admits some reflected light which is directed up to the ceiling. If the ground outside is reflective (eg paving or grass), this can cause glare. The device above would permit through movement of air, and allow a view of the outside space. The device below would exclude all sunlight, at the expense of obstructing the view and reducing ventilation. A traditional form of louvred window has glass louvres at the top, a fixed glass panel centre, and opaque (usually steel or timber) louvres at the bottom. The two sets of louvres can be manipulated to control airflow, and the lower set will largely exclude heat gain reflected from external ground.
  • 18. The solution illustrated above is seldom necessary, even for a window facing directly west. An adjustable version would be preferable. It is not usually necessary to exclude early morning sun (eg the first 15°) on the grounds of solar gain alone. Few buildings have an unobstructed horizon, and external features can be used to limit direct sunlight and at the same time allow a view of the outside space. As an adjunct to or replacement of sunshade devices, tinted glass may be considered. This should preferably be incorporated in the glass rather than applied as a film. The first level of tinting makes a noticeable difference, and the best (and most expensive) ‘Green Glass’ reduces solar gain to a negligible level. Tinting may now be required under the Building Code – see below. Overhangs will also assist in protecting windows from solar gain, and provide a fixing point for screens, or window hoods can be added individually. If space and cost permits, verandahs on all or the most exposed elevations are the best option.
  • 19. DESIGNING FOR CLIMATE - 4 THE 'STACK' EFFECT, ‘COOL POOLS’ AND ELEVATED FLOORS Ventilation is concerned with the supply of fresh air, and, in hot climates, the promotion of convective cooling, by the movement of air at a relatively slow rate. The motive force can be either thermal or dynamic (wind), the latter being discussed above. The stack effect relies on thermal forces, set up by density difference (caused by temperature differences), between the outdoor and indoor air, and air at a lower level relative to air at a higher level. It can occur adjacent to an open window, where warmer air may flow out of the top part of the window, and cooler air may be drawn in at the bottom. Floor-to- ceiling windows with fixed lights in the middle and louvres at the top and bottom, are designed to exploit this potential. The principle is the same as for wind generation, and of course wind can be used to assist the effect. Special provision can be made for the effect by the installation of ventilating shafts. The higher the shaft, the greater the cross-sectional area, and the greater the temperature difference, the greater the motive force, and therefore the more air will be moved. The motive force is the 'stack' pressure multiplied by the area (Newtons x area in m2). The formula is: Ps = 0.042 x h x T Where Ps = stack pressure in N/m2 h = height of stack in m T = temperature difference in ºC (the constant is N/m3ºC) Such shafts are used for internal ventilation in cooler climates where the temperature difference in winter is fairly large; The same principle can be used in tropical buildings to promote vertical air movement; The volume of air passing up through the central well can be drawn in at the bottom corner of the wall of each room facing the well, and discharged through openings at the top of the same wall. Arrangements such as that shown above can provide a comfortable even temperature without the use of air-conditioning, providing the well or shaft is large enough and high enough, and the intakes and exits are designed to maximise the effect of prevailing winds. It is sometimes suggested that the traditional Queenslander house style, with cathedral ceilings of up to 4m, is intended to use this phenomenon, but in most cases the opening at the top and the height of the stack is insufficient to promote any significant cooling through
  • 20. the stack effect alone. Any benefit probably derives from the Bernoulli Effect described above. COOL POOLS Evaporative cooling produced by the passage of air over water has been utilised since earliest times, using ponds, lakes, fountains, etc. or more ingenious devices such as air scoops in which a porous clay water pot is placed so that the passing air comes into contact with a continual supply of water droplets. This is the basic method used in the modern evaporative cooling system, except that the water is now dripped through a screen suspended in the air flow. Evaporative cooling is less effective when the air is very humid, and most effective when the moving air is hot and dry. However, cool pools, if large enough, can have a significant effect, and may not in fact have to contain water to work. If moving air can be funnelled through a space which is out of the direct sun, it will lose some of its heat before reaching the building. Verandahs can act as simple cool pools as well as shading devices. In some large institutional buildings, use has been made of the mass of the structure and the landscaping around it to channel moving air along a path which increases its velocity, removes heat gain from the sun, and produces evaporative cooling. A good example is the Baha'i Temple at Bahapur, outside New Delhi, India. This is a complex concrete shell structure which is a place of assembly, but does not utilise air-conditioning, even though a hot dry wind blows through the area for a significant period during the year. The wind is funnelled over embankments, and, in the case of the prevailing wind, over standing water which is below natural ground level. It then passes through the openings around the base of the dome, and rises up through the interior. 'Cool pool' effects can of course be enhanced with mechanical assistance, producing a reasonable trade-off against conventional air-conditioning systems. Swimming pools may be located on the windward side of dwellings to provide a ‘cool pool’ airflow. There will be a trade-off here between the need to cool airflow and the need to limit water loss by evaporation. A pool cover will diminish the effect but reduce loss by evaporation. Providing shade-cloth or sails above the pool may represent a reasonable compromise. ELEVATED FLOOR OR SLAB-ON-GROUND? This issue remains controversial. Traditional tropical designers favour dwellings elevated off the ground, either low-set (1m) or high-set (2m or more). The justification for this includes: • A building on the ground is a ‘Bluff body’. The wind must flow round it or over it. There may be dead zones of unmoving or slowly rotating air adjacent to walls. With an elevated house, the air can pass under the floor as well. • The living areas of the house are at ground level, where the air is hottest. As noted above, air temperature decreases with height.
  • 21. In an urban situation, where the density of building is more than 28%, there is a tendency for natural airflow at ground level to diminish, and eventually to disappear altogether. Al things being equal, if a house is elevated it will have better access to cooling breezes. • Uninsulated floors open to the airflow may be cold in the early morning during cooler months, but cold is more of a novelty than a problem in the tropics. The argument for slab-on-ground is that the floor has a temperature-stabilising effect. If shielded from the sun in the hotter months, it will remain cooler than the surrounding environment. It may absorb and retain heat during the cooler months when the solar angle is lower, but that is assumed to be beneficial. The same argument is used to promote the benefit of internal mass walls. The argument may be valid for temperate and even sub- tropical environments, where cold can be a problem, but its value is doubtful here Slab-on-ground construction is favoured over elevated floors in energy efficiency software, including the most recent “Second Generation” software. This issue is discussed in more detail in Part 7 below.
  • 22. DESIGNING FOR CLIMATE - 5 RESIDENTIAL LOTS In recent years, there has been a trend in North Queensland housing away from traditional building forms in favour of houses more suitable for temperate climates, e.g. slab-on-ground, high thermal capacity enclosures (masonry exposed to the sun), full height windows, lack of overhangs, etc. In spite of the decline in average household size, houses have tended to become larger, while lots are getting smaller. The result has been a growing problem of hot boxes” and “heat islands”, where spaces between buildings are impervious to winds, and a positive feedback loop is created in which there is greater dependence on air-conditioning, which vents to the outside, thereby making the situation worse. Designers who are aware of these problems frequently complain that in any typical residential subdivision, it is usual that less than 30% of lots represent a site which they are able to provide a suitable design for. Lot designers and buyers should consider: • Solar orientation: the development of lots which allow dwellings to be built with optimum orientation for solar control and sunshading, and which allow dwellings to be built with roofs oriented to optimise use of photovoltaic and solar water heating facilities. • The direction of natural airflow, particularly summer afternoon winds from the NE and ENE (these are the “target winds" in North Queensland, in that they are the most commonly occurring winds at the time when they are most needed). • Local micro-climate and topographic effects (if any) of the site which modify standard characteristics • The need to maintain, as far as practicable, air-permeability in the resulting built environment, with a preferred overall ratio of buildings to open space of 30% or less • Minimisation of areas where wind shadow (air-flow skimming) will take place • A street pattern which enhances rather than detracts from air-permeability • Adaptation of the layout to utilise parks, drainage and other reserves to maintain air- permeability • Avoidance of concentrations of small lots, fencing or other barriers perpendicular to target winds • Assessment across the site of circumstances where down-wind distance from one barrier to the next is less than 7 times the height of the up-wind barrier. • Possibility of off-setting parallel side boundaries to reduce wind-shadow effects (covered above) • Use of building envelope plans and landscape plans to enhance climate-response • Avoidance of 'build-to-boundary' features unless attached development is proposed. • Use of attenuation distances rather than solid fencing for acoustic protection EXAMPLES: Orientation On the above plan, the lots marked A are within +/- 15° of north, and are capable of containing a dwelling with an optimal solar aspect. Lots marked B are oriented east-west, but
  • 23. are wide enough to provide for appropriate orientation. Lots marked X have an adverse orientation, and provide little scope for adaptation. Airflow and Barriers Research confirms (Su San Lee below) that long horizontal barriers perpendicular to airflow, such as solid fencing or continuous building lines, attenuates airflow for a horizontal distance of seven times the height of the barrier. Where a second barrier occurs, airflow continues to 'skim' and does not return to the unimpeded pattern for the same seven-times-height distance.
  • 24. DESIGNING FOR CLIMATE – 6 RECENT DEVELOPMENTS IN THURINGOWA, NORTH QUEENSLAND: THE PLANNING SCHEME The first IPA (Integrated Planning Act) Planning Scheme for the City of Thuringowa was gazetted on 10th October 2003 and came into effect on 20th October 2003. The Scheme, which is largely performance- rather than prescription-based, requires that climate is considered for all forms of development, and in particular, residential development. It contains performance criteria for climate-response in the design and assessment of mixed residential, multi-unit and duplex dwellings, as well as single dwellings constructed on lots less than 450m2. An innovative feature of the Scheme is the introduction of climate-responsive design for residential lots. The Scheme is supported by Planning Scheme Policies on Climate-Responsive Design for these forms of development, which incorporate most of the principles outlined in this paper. The measures complement Amendment 12 of the Building Code of Australia, which introduces energy-efficiency requirements for residential building, and differing requirements according to Climate Zone. In Queensland, the Scheme won the Planning Institute of Australia Award for 2003 in the category of Urban Planning, and the Climate-Responsive Design Policies won Merit Awards in the same category. In 2004 the Scheme won the PIA National Award for excellence in Urban Planning. The Planning Scheme Policy “Climate-responsive Design for Residential Lots” was the work of this author. The Planning Scheme Policy “Climate-Responsive Design for Housing” was the work of Buckley Vann Consultants – Architect Caroline Stalker. During 2003, the Council ran a Climate-Responsive Design Competition, in association with the Housing Industry Association, and Australian Institute of Architects Queensland Division. One of the purposes of the competition was to provide input for the development of Planning Scheme Policies. Details of the winning entries are attached to the CRD Policy on Housing as an Appendix “Housing Exemplars”. Copies of the Planning Scheme, Policies, and the housing exemplars are available from the Council’s website – see references.
  • 25. DESIGNING FOR CLIMATE – 7 CLIMATE - RESPONSE AND THE CONSTRUCTION INDUSTRY The climate-responsive design principles outlined above tend to support the more traditional “Queenslander” form of dwelling design, comprising elevated floors, lightweight frame and ‘free run’ ventilation. This type of dwelling is still being built. There are local designers, architects and builders producing excellent examples of adapted traditional design. However, most new dwellings constructed in the region are slab-on-ground, in a style more typical of temperate- rather than tropical-climate development. The aerial photograph above shows part of the Douglas suburb of Townsville. Ross River is at the top (north), and James Cook University lies below the bottom of the image. The area on the right was constructed around 20-30 years ago. Here the houses are mostly 2-storey ‘highsets’. Plot ratio (the ratio between the house area and the lot area) is around 25-30%. There is mature vegetation cover, and reasonable exposure to target winds from the north-east, which in this location is enhanced by the river corridor. On the left is the first stage of Delfin’s Riverside development. The house footprints are larger, while the average lot size is smaller. The dwellings are mostly single storey, slab-on- ground, with plot ratios much closer to the maximum of 50%. There are rows of small lots with houses that are very close to each other, and back yard open space which in many cases will have little or no access to the target winds. Because of the density of development, the air will be skimming over the top. There is evidence here (confirmed by the observations of residents) that ‘heat islands’ exist – pockets of space where the air doesn’t move, and the resulting ambient heat is being raised by the exhaust from air-conditioning. It should also be noted that in the older traditional area, roof colours are light, comprising reflective unpainted zincalume or light colorbond. In the newer area there are more dark- coloured (heat absorbing) roof surfaces. The early stages of Delfin’s Willow Gardens development in Thuringowa was the subject of Su San Lee’s PhD study. This established that this form of development is significantly lacking in passive climate-response. In the course of time, Councillors in Thuringowa began to receive complaints from residents about the heat island effect, and noise problems due to houses being very close to each other. It was this feedback (supported by warnings from design practitioners) which was the catalyst for the Council requiring climate-response to be addressed in the new Planning Scheme.
  • 26. It should be noted that the above implies no criticism of Delfin alone. The same situation is occurring in many new developments in the region, and there are many reasons why this is the case. Some derive from lack of consideration of climate-response at lot-development stage, followed by inappropriate design of subsequent dwellings. Other reasons include the circumstances prevailing in the construction industry, the current relatively low cost of electricity in Queensland combined with much reduced cost of air-conditioning systems, and the nature and level of demand in the housing market. The nature of the market The Townsville urban region remains one of fastest growing areas outside the south-east corner of the State. Around 2000 houses are being built each year. The population of the region is fairly mobile, with around a 10% p.a. turnover. There are new arrivals from ‘down south’ who are unfamiliar with the climate, and tend to select house styles that are familiar, but not well adapted to the local conditions. The construction Industry and house prices Due to pressure of demand, the rising cost of construction, the pressure on the construction industry and shortage of skilled construction tradespersons, the cost of housing has risen dramatically during the past 2-3 years. It is easier, and therefore cheaper, to build masonry, slab-on-ground dwellings with conventional trussed roof frames, in a limited range of options. Houses designed for the specific residential lot and responsive to climate and other constraints of the lot, will cost more. Climate-response requires design and construction skills which are in short supply. CAD/CAM (computer-aided design and manufacturing) can produce considerable varieties in roof form and wall framing, and can reproduce traditional forms, but at a cost in design time and resetting of assembly jigs. Construction materials and techniques Up until the 1970s the most common construction form was lightweight framing, using Mostly “Maryborough” hardwood. This material is very durable; it seems to gain strength with age, and has good resistance to insect attack. Equivalent hardwoods are available, but are expensive, more difficult to work, and the logging of hardwoods is now generally deprecated. Preservative-treated machine-graded pine can be used, but is still expensive, and many practitioners (including the author) do not consider it to be a reliable substitute. Manufactured structural timber such as “Glulam” is available but not widely used. In the experience of the author, plywood box structural sections are easy to produce and have a high strength to weight ratio, but are also expensive, with an added cost that engineering certification is difficult to obtain. Steel on the other hand has known structural characteristics and sections are dimensionally accurate and stable. Steel is currently the only common substitute for conventional timber framing, in the form of trussed roofs and stud walling. Architects are now tending to favour the use of hot-formed RHS (rectangular hollow section) to provide the primary framing for framed houses, as a portal frame system. The primary framing if exposed is acceptable as it is in effect pre-finished. Frames are generally cut, welded and finished off-site, with limited on-site working required. The method allows the retention of features such as raked or cathedral ceilings and minimal wasted space in roof voids. Although not commonly used for residential construction in the past, portal frame systems are probably the most economical way of enclosing space. An alternative, cheaper framing solution is to use cold-formed steel portal frame (eg ‘C’ sections) with secondary framing provided by ‘top hat’ rails – basically the form used for Class 10 structures (sheds and the like) over about 15m2 in area. The author has assisted in the construction of two ‘starter’ homes built using this type of construction. They are 74m2 in area, extendable (verandahs, bedrooms), constructed by contractors to lock-up (with slab, windows/external doors, insulation) for $25,000 each in 2004. Internal fit-out and finish, including onsite wastewater system, is expected to be completed for a further $20 - 25,000 each. as owner/builder projects. Design details are available as a separate document from the author’s website.
  • 27. Concrete block construction remains the most common. There is nothing particularly wrong with block in the tropics – provided it can be shielded from the sun. It is expensive to shield all exposed walls with verandah, and with the trend to smaller lots and larger dwellings there is rarely enough room. Exposed block will absorb heat from the sun and re-radiate it into the interior space; in the worst cases, continually for months. The original draft of the BCA Energy Code in 2003 contained measures that would outlaw the use of standard concrete block for external walls in the tropics, for this reason. For obvious reasons, this was impracticable, and the measure has been ‘deferred’. At the time of writing, there is no concrete block which has the required insulation properties AND is also capable of the required structural performance in cyclonic areas. ‘Free-run’ or air-conditioning? In earlier times, it was common for dwellings to be designed for passive climate-response. Air-conditioning was expensive, and power supplies more uncertain. However, most houses still had at least one room air-conditioner (often in the main bedroom) for those times when it was hot and humid, and there was no wind. This is still the case with ‘free-run’ dwellings. However, most new houses in the region are now constructed with air-conditioning. Installations are more energy efficient, costs are lower, power supplies are a little more reliable, and the cost of reticulated power in Queensland is still relatively low. The BCA Energy Code ensures that there is a least some provision for the structure to be energy- efficient. More recent (and more dense) residential development does not have the same level of exposure to cooling breezes, and the breezes themselves also seem to carry more dust and pollution. The question is – how long will cheap power last? This region is very well supplied with solar energy, but the rate of take-up for solar water- heating has been minimal. The reason is that with the low cost of power, it took too long for the additional cost to be recovered. The use of reticulated power for water heating is capable of being measured through the off-peak tariff system. The figures are substantial, and as a result, solar- or gas-assisted water heating is now mandatory for new dwellings. It is counter-productive if savings in energy usage from more efficient water-heating is swallowed up by greater use of air-conditioning. The deemed-to-satisfy and energy-rating provisions in the BCA may reduce the worst practices, but do little to encourage passive climate-response. Energy efficiency software Energy Rating systems such as NatHers and Bers have been in general use for assessing energy efficiency in housing for a number of years. Most of the rating systems use the energy rating engine CHENATH, developed by CSIRO. Most systems were based on closed dwellings, and did not perform well in the assessment of the type of ‘free-run’ dwelling common in the tropics. Attempts by legislators to encourage the use of energy rating systems in the tropics were criticised by practitioners. As a result, in 2005 State and Federal agencies and the CSIRO commenced a program to develop a “Second Generation” of energy rating software, piloted by the Association of Building Sustainability Assessors, which inter alia would address the objections of tropical designers. The pilot program was based on NatHers, and the new product was NatHERS/AccuRate. Since most of the development was via the CHENATH engine, the changes would follow through to the other products using this. I participated in the pilot program, and my views on the outcome follow. The new system is better than the old. The software is better at handling shading and the properties of materials, and can take into account the benefit of natural ventilation. However, there remain a number of anomalies which deter me from using NatHERS/AccuRate as a primary tool for climate-responsive design: • The system will only produce a Star Rating (1 – 10) for combined heating and cooling loads. It should be possible to assess rating on cooling loads alone, since these are the most important in the tropics. The inclusion of heating load issues is counter-productive,
  • 28. in that measures for heating (which are seldom, if ever required) are prejudicial to the more important cooling measures. • There still seems to be a built-in assumption that the dwelling is ‘closed’. All ventilation devices must be designated as capable of being closed, in order (presumably) for air- conditioning to work. • While the inclusion of wind speed, direction and probability is potentially beneficial, it is easy for assessors to ‘fake’ their value, eg by assuming air movement which is precluded by the form of development. • The system will give a much higher rating for slab-on-ground than for the same building with an elevated floor – 5 or 6 Stars compared to 2. This appears to be ‘hard-wired’ into the engine, and runs contrary to empirical evidence in this region. • The engine cannot model some features known to be of value in tropical design, such as Bernoulli devices (high-level vents which operate under differential pressure produced by natural airflow). These will be assessed as operating under convective forces only. • In the case of NatHERS/AccuRate at least, modelling of the building is descriptive rather than graphical, and time-consuming and prone to error for even conventional dwellings. The software is unlikely to be efficient in modelling a complex tropical-style design. Design Guides, “Sustainability Assessment” Systems, SmartHousing and Affordability: AMCORD and the Queensland Residential Design Guidelines Readers are advised not to use the principles outlined in AMCORD (Australian Model Code for Residential Development). Earlier editions were seriously counter-productive where tropical design was involved. The latest version is better, but it appears AMCORD is no longer being updated. Some of the principles are incorporated in the “Your Home” Technical Manual. Amcord was replaced in Queensland by the Queensland Residential Design Guidelines, but it appears this is no longer being maintained either. Generally, design guides are only useful if they specifically relate to tropical design, and preferably, written by practitioners with experience in tropical design. “Sustainability Assessment” Systems A number of these are currently being promoted, and seek to assess dwellings against “triple bottom line”, life cycle, environmental issues and the like. Most originate from ’down south’ and contain values which, again, are counter-productive if used in the tropics. In one system a 200m2 house on a 400m2 lot is given a positive value, whereas experience in the tropics shows that this type of dwelling is very likely to be a problem, particularly if surrounded by other similar properties. Again – not recommended unless tropical design issues are addressed. Smart Housing This is an initiative of the Queensland Department of Housing, and contains recommendations for a whole range of issues relating to dwellings, such as adaptability, internal layout which will allow for disability (eg wider corridors, lever door-handles), security and the like. The basic ‘list’ adds very little to the total cost of the dwelling, and should therefore be considered by even the most cash-strapped customer. Affordability In 2004 the Queensland Department of Housing issued an ominous report predicting major problems with housing affordability – predictions which are turning out to be accurate. There have recently been a number of exemplars for “sustainable dwellings” where the cost per square metre is double that of the main housing stock. Sustainability and climate-response have no value if the bulk of clients cannot afford the cost.
  • 29. Climate-Responsive Design is about Principles, not Rules Climate-Responsive Design includes principles such as east-west orientation, not placing habitable areas or amenity spaces on the western side, but it must be recognised that these are principles, not rules. Sites will have specific features or constraints which are more important than the principles. For example: • The western side might have a major view, eg river, hills, etc. In this case, the view wins, and the CRD issues must be solved another way. The western elevation needs to be protected, but some consideration can be given to what exists on the western boundary or beyond it, eg dense vegetation or a two-storey building . • The north-east airflow is considered paramount, but if there is a major highway in close proximity on the north-east side, it might be better not to capture the airflow directly. • There is little point in aiming to capture airflow directly through doors and windows if the airflow is skimming over the top of the building. In this case, Bernoulli vents should be considered.
  • 30. References Koenigsberger, Ingersoll, Mayhew and Szokolay, Manual of Tropical Housing and Building – Part 1 Climatic Design, Longman London 1974. [Part 1 was the only part published, and is largely the work of Steven Szokolay] (Steven was one of the judges for the Design Competition mentioned above.) The book has been in print for some time, but in the opinion of this author has not yet been surpassed. Su San Lee, PhD Thesis, Natural Ventilation and Medium Density House Forms in the Tropics, 1998, Institute of Tropical Architecture, James Cook University. Recommended: Australian Greenhouse Office Canberra 2001, Your Home – Design for Lifestyle and the Future – Technical Manual. This document is in the opinion of the author the best available at the moment. Copies are available from the Greenhouse Office, the Greenhouse website, and possibly through Government Bookshops and branches of the Housing Industry Association. www.greenhouse.gov.au HIA GreenSmart Program. This is based in part on the above, and is an accreditation scheme for designers and other construction professionals who can advise on and apply principles of energy-efficient and climate-responsive design. The author is an accredited Greensmart professional. hia.com.au/hia/channel/Builder/region/National/classification/Greensmart.aspx The Townsville House by Townsville architect Felix Riedweg. Excellent but inexpensive resource for the design of houses in the Townsville region. ISBN 0-646-4335-4, or purchase direct via felix@riedweg.com.au. Smart Housing Queensland. Sustainable Design resource - Department of Housing. www.housing.qld.gov.au/initiatives/smarthousing/index.htm Affordable Housing Queensland. Affordable housing issues - Department of Housing. www.housing.qld.gov.au/initiatives/affordable/index.htm Square One Research. Home of Ecotect, and a resource for climate-responsive design. www.squ1.com Thuringowa Planning Scheme. Scheme and Policies incorporating climate-responsive design. www.thuringowa.qld.gov.au/council/departments/planning/ Martin Clark’s website. Contains the current copy of this document and other useful resources. http://people.aapt.net.au/jclark19/ Martin Clark 30/09/2006