GIADMI Portfolio Poster 1

The document describes the development and testing of the Generalized Intuitional versus Analytical Decision Making Index (GIADMI). It aims to develop brief scales to measure individual preferences for intuitive or analytical decision making styles. 51 students completed a questionnaire including the original 13-item GIADMI scale. Factor analysis revealed two factors corresponding to analytical and intuitive decision making. The final scales consisted of 3 items for analytical thinking and 6 for intuitive thinking. The scales showed good reliability and some evidence of construct validity, though further refinement is needed for the analytical scale. The study provides a new tool to efficiently measure individual differences in intuitive versus analytical decision making.
Recommended

Recommended
More Related Content
What's hot
What's hot (19)
Similar to GIADMI Portfolio Poster 1
Similar to GIADMI Portfolio Poster 1 (20)
GIADMI Portfolio Poster 1
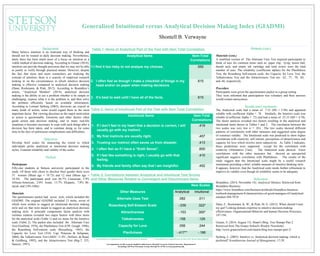
- 1. Generalized Intuitional versus Analytical Decision Making Index (GIADMI) Shontell B. Verwayne Background Many believe intuition is an irrational way of thinking and should not be trusted in daily decision making. Nevertheless, lately there has been much more of a focus on intuition as a viable method of decision making. According to Grauer (2014), intuition can provide thought processes that we may not be able to justify or verify through practical means. However, despite the fact that more and more researchers are studying the concept of intuition, there is a scarcity of empirical research looking in on the circumstances in which intuitive decision making is effective compared to analytical decision making (Dane, Rockmann, & Pratt, 2012). According to Boundless’s article, “Analytical Mindset” (2014), analytical decision making is the ability to see a problem whether it be simple or challenging, express what it is the problem is, and then solve the problem efficiently based on available information. According to Lennart Sjöberg (2003), decisions are crucial in many kinds of action; some would regard them as the most important factor. But viewing decisions as the major motivation to action is questionable. Emotions and other factors often guide action and decision making, and in many real-life situations it becomes necessary to cope with such things after a decision has been taken, and to continue doing so for some time in the face of unforeseen complications and difficulties. Objectives Develop brief scales for measuring the extent to which individuals prefer analytical or intuitional decision making styles. Examine reliability and validity of the scales. Method Participants Fifty-one students at Stetson university participated in the study. Of those who chose to disclose their gender there were 37 women (Mean age = 19.73) and 12 men (Mean age = 18.54). The participant pool was 66.7% Caucasian, 5.9% African-American, 2.0% Asian, 13.7% Hispanic, 7.8% Bi- racial, and 2.0% Other. Materials The questionnaire packet had seven tests, which included the GIADMI. The original GIADMI included 13 items, seven of which were written to suggest an intuitional decision making style and six that were meant to suggest an analytical decision making style. A principle components factor analysis with varimax rotation revealed two major factors with three items for the analytical scale (Table 1) and six items for the Intuitive scale (Table 2). The packet also included the Alternate Uses Test (Guilford, 1976), the Planfulness Test (CPI, Gough, 1996), the Rosenberg Self-esteem scale (Rosenberg, 1965), the Capacity for Love Test (VIA: Cap, Peterson & Seligman, 2004), the Talkativeness Test (AB5C: I+/IV-, Hofstee, de Raad, & Goldberg, 1992), and the Attractiveness Test (Big-7: 525, Saucier, 1997). Methods (cont.) Materials (cont.) A modified version of The Alternate Uses Test required participants to think of uses for common items such as: paper clip, Q-tip, tennis ball, thumb tack, and empty ink cartridge and total scores were the total number of uses. The reliability (coefficient alphas) for the Planfulness Test, the Rosenberg Self-esteem scale, the Capacity for Love Test, the Talkativeness Test and the Attractiveness Test are: .62, .77, .70, .84, and .66, respectively. Procedure Participants were given the questionnaire packet in a group setting They were informed that participation was voluntary and their answers would remain anonymous. Results and Conclusions The Analytical scale had a mean of 7.33 (SD = 2.94) and appeared reliable with coefficient Alpha = .78. Similarly, the Intuitive scale was reliable (Coefficient Alpha = .72) and had a mean of 25.33 (SD = 4.78). The factor analysis revealed two factors resulting in the analytical and intuitional items shown in Tables 1 and 2. The correlation between the two scales was very low (r = .03). The two scales showed different patterns of correlations with other measures and suggested some degree of construct validity. The Intuitional scale was predicted to show higher correlations with creativity, self esteem, perceptions of attractiveness and capacity for love which involve more subjectivity. As Table 3 indicates, these predictions were supported except for the correlation with creativity (Alternative Uses). The Analytical scale showed lower correlations with the other measures but showed an unexpected significant negative correlation with Planfulness. The results of the study suggest that the Intuitional scale might be a useful research instrument providing a brief, reliable measure of intuitive thinking style. It appears, however, that the Analytical scale needs further refinement to improve its validity even though its reliability seems to be adequate. References Boundless. (2014, November 14). Analytical Mindset. Retrieved from Boundless Business: https://www.boundless.com/business/textbooks/boundless-business- textbook/management-8/characteristics-of-good-managers-63/analytical- mindset-304-7874/ Dane, E., Rockmann, K. W., & Pratt, M. G. (2012). When should I trust my gut? Linking domain expertise to intuitive decision-making effectiveness. Organizational Behavior and human Decision Processes, 187-194. Grauer, S. (2014, August 13). Stuart's Blog: Tree Stumps Part 2. Retrieved from The Grauer School's Weekly Newsletter: http://www.grauerschool.com/stuarts-blog-tree-stumps-part-2/ Sjoberg, L. (2003). Intuitive vs. Analytical decision making: which is preferred? Scandinavian Journal of Management, 17-29. Correspondence on this research should be addressed to: Shontell Verwayne, Stetson University, Department of Psychology 228 West Wisconsin Avenue, DeLand FL 32720, sverwayn@stetson.edu Analytical Items Item-Total Correlations 1.I find it too risky to not analyze my choices. .550 2. I often feel as though I make a checklist of things in my head and/or on paper when making decisions .615 3. It’s best to wait until I have all of the facts. .615 Intuitional Items Item-Total Correlations 1. If I don’t feel in my heart that a decision is correct, I will usually go with my instinct. .419 2. My first instincts are usually right. .457 3. Trusting our instinct often saves us from disaster. .413 4. I often feel as if I have a “Sixth Sense”. .600 5. If I feel like something is right, I usually go with that feeling. .410 6. My friends and family often say that I am insightful. .452 New Scales Other Measures Analytical Intuitional Alternate Uses Test .082 .011 Rosenberg Self-Esteem Scale -.039 .322* Attractiveness -.153 .300* Talkativeness .158 .129 Capacity for Love .056 .244 Planfulness -.417** -.186 Table 1: Items of Analytical Part of the Test with Item Total Correlation Table 2: Items of Intuitional Part of the Test with Item Total Correlation Table 3: Correlations between Analytical and Intuitional Test Scores and Other Measures Related to Convergent and Discriminant Items *. Correlation is significant at the 0.05 level (2-tailed) **. Correlation is significant at the 0.01 level (two-tailed)