Hydropower Sub-Index Analysis Flag Pattern Bearish Trend
•
0 gefällt mir•605 views

This document analyzes the hydropower sub-index using technical analysis methods. It identifies a flag pattern within the hydropower sub-index from 1853.15 on November 30th, 2015 to 2187.62 on January 14th, 2016, representing an increase of 334.47 points over 1.5 months. However, the flag pattern is a short-term continuation pattern that typically precedes a continuation of the initial trend, indicating the hydropower sub-index may be moving into a bearish trend. The document also provides charts showing pivot points and resistance/support levels for interpretation of the hydropower sub-index trend.
Empfohlen

Empfohlen
Weitere ähnliche Inhalte
Andere mochten auch
Andere mochten auch (13)
Ähnlich wie Hydropower Sub-Index Analysis Flag Pattern Bearish Trend
Ähnlich wie Hydropower Sub-Index Analysis Flag Pattern Bearish Trend (20)
Kürzlich hochgeladen
Kürzlich hochgeladen (20)
Hydropower Sub-Index Analysis Flag Pattern Bearish Trend
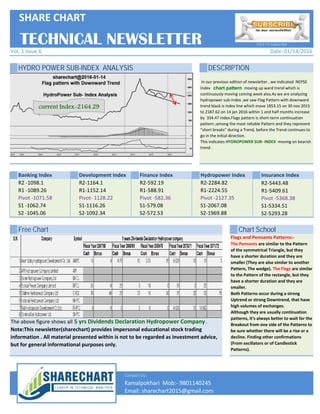
- 1. HYDRO POWER SUB-INDEX ANALYSIS DESCRIPTION Banking Index Development Index Finance Index Hydropower Index Insurance Index SHARE CHART Vol. 1 Issue 6 R2 -1098.1 R1 -1089.26 Pivot -1071.58 S1 -1062.74 S2 -1045.06 R2-1164.1 R1-1152.14 Pivot- 1128.22 S1-1116.26 S2-1092.34 R2-592.19 R1-588.91 Pivot -582.36 S1-579.08 S2-572.53 In our previous edition of newsletter , we indicated NEPSE Index chart pattern moving up ward trend which is continuously moving coming week also.As we are analyzing hydropower sub-index ,we saw Flag Pattern with downward trend black is index line which move 1853.15 on 30 nov 2015 to 2187.62 on 14 jan 2016 within 1 and half months increase by 334.47 index.Flags pattern is short-term continuation pattern ;among the most reliable Pattern and they represent “short breaks” during a Trend, before the Trend continues to go in the initial direction. This indicates HYDROPOWER SUB- INDEX moving on bearish trend . TECHNICAL NEWSLETTER R2-2284.82 R1-2224.55 Pivot -2127.35 S1-2067.08 S2-1969.88 R2-5443.48 R1-5409.61 Pivot -5368.38 S1-5334.51 S2-5293.28 Date: 01/14/2016 Click To Subscribe current Index-2164.29 Free Chart Chart School Contact Us: Email: sharechart2015@gmail.com R2 -1098.1 R1 -1089.26 Pivot -1071.58 S1 -1062.74 S2 -1045.06 R2-1164.1 R1-1152.14 Pivot- 1128.22 S1-1116.26 S2-1092.34 R2-592.19 R1-588.91 Pivot -582.36 S1-579.08 S2-572.53 Kamalpokhari Mob:- 9801140245 The above figure shows all 5 yrs Dividends Declaration Hydropower Company. Note:This newsletter(sharechart) provides impersonal educational stock trading information . All material presented within is not to be regarded as investment advice, but for general informational purposes only. R2-2284.82 R1-2224.55 Pivot -2127.35 S1-2067.08 S2-1969.88 R2-5443.48 R1-5409.61 Pivot -5368.38 S1-5334.51 S2-5293.28 Flags and Pennants Patterns:- The Pennants are similar to the Pattern of the symmetrical Triangle, but they have a shorter duration and they are smaller (They are also similar to another Pattern, The wedge). The Flags are similar to the Pattern of the rectangle, but they have a shorter duration and they are smaller. Both Patterns occur during a strong Uptrend or strong Downtrend, that have high volumes of exchanges. Although they are usually continuation patterns, it’s always better to wait for the Breakout from one side of the Patterns to be sure whether there will be a rise or a decline. Finding other confirmations (From oscillators or of Candlestick Patterns). Email: sharechart2015@gmail.com Kamalpokhari Mob:- 9801140245