1. Seth Nelson | Biological Communications II, Cole
23 April 2015
Mitochondrial DNA and the extent of our relation to our ancestors
The mere mitochondrion, a monomer in the chain of the power house of the cell, is one of
the first organelles that comes to mind when thinking of cellular machinery. Beginning with the
history of the mitochondrial organelle, this paper explores the mitochondrial genome, with
specific focus on the substitution rate in mitochondrial DNA (mtDNA). Unique properties of
mtDNA, such as a high copy number per cell and high sequence divergence, make this molecule
of particular interest. The structure of the mitochondrial molecule, with a coding region and a
noncoding, control region, helps researchers shed light on humanity’s past for both human
evolutionary and forensic applications. Two tenets of mtDNA theory, that mitochondria are
inherited only from the mother and that mitochondrial recombination does not happen, are
challenged with recent evidence, but are found to still hold generally true. Two applications of
mtDNA, namely forensic identity and relationships to ancient ancestors, are explored. Ancient
ancestors from ca. 23,000 or more years ago are no more related to any human living today than
any human today is related to another.
The greater context that knowing the origin of mitochondria provides is vital to truly
understanding their genetics, because what we are currently is a product of all our past
experiences. According to the theory of endosymbiosis, certain organelles of the modern
eukaryotic cell are descendants of prokaryotic cells incorporated into organisms lacking a cell
wall. Mitochondria fit this description. Sadava et al. (2011) discuss the origin of mitochondria
by looking at the early Earth. Increasing oxygen gas levels in the atmosphere were a byproduct
of photosynthesis by cyanobacteria, and many early primordial organisms were not able to
tolerate this newly oxygenated environment. Certain protobacteria were able to tolerate this
oxygenation, likely by reducing oxygen gas to water. A certain protobacterium was incorporated
2. Nelson 2
into the progenitor of Eukarya by phagocytosis, and for whatever reason it was not digested.
This now-new organelle reduced the local oxygen gas level in the cell’s environment by reducing
O2 to H2O, giving this cell a competitive advantage. Eventually, this reduction of oxygen gas
became coupled with ATP production in cellular respiration, forming the modern mitochondrion.
Although mitochondria share an evolutionary history with prokaryotes, modern
mitochondria are very different from modern prokaryotes. The number of genes present in the
mitochondrial genome can vary between organisms; most genomes contain 12 to 20 protein-
coding genes (Andersson et al., 2003), with the extremes being the mitochondria of the
protozoans Plasmodium falciparum and Reclinomonas americana containing two protein-coding
genes and 67 genes, respectively (Lang et al., 1997). For contrast, the smallest nuclear genome
of a free-living organism belongs to the bacteria Mycoplasma genitalium, encoding
approximately 470 proteins (Fraser et al., 1995). Obviously, some genetic material was lost in
the transition from a free-living organism to a cellular organelle, with much of the information
likely being transposed to the nuclear genome of the Eukarya progenitor (Gray et al., 1999).
What makes mitochondria interesting to us is not their origin, but their present properties.
The fact that the mitochondrial genome is a single molecule and has a high copy number and
high sequence divergence makes it a good candidate for research in tracing human lineages
(Kraytsberg et al., 2004). Similar to a prokaryotic nucleoid, the mitochondrial nucleoid is a
circular, double-stranded molecule lacking introns and gene repetitions, and it has very little
intergenic spacer DNA (Klug et al., 2015). The human mitochondrial genome contains 65,569
nucleotide base pairs (bp) (Anderson et al., 1981), with genes encoding two ribosomal RNAs, 22
transfer RNAs, and 13 proteins, with the mtDNA itself having two origins of replication and a
single control region (Pakendorf and Stoneking, 2005). For comparison, the mitochondria of
3. Nelson 3
Reclinomonas americana has a 69,034 nucleotide bp long mitochondrial nucleoid with 67 genes
(Lang et al., 1997), about the same length as humans but with many more genes.
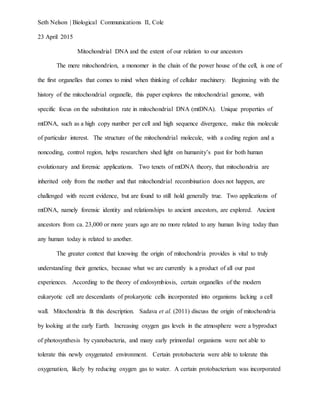
A schematic representation of human mtDNA genome is presented in Figure 1 at the end
of this review, showing the specific genes and their order on the nucleoid. Whereas prokaryotes
have a single nucleoid and eukaryotes have a single nucleus, vertebrates have ca. 2 to 10 mtDNA
molecules for each mitochondrion (Satoh and Kuroiwa, 1991) and plants have 20 to 40 copies
per organelle (Klug et al., 2015). Interestingly, despite the high copy number per cell,
heteroplasmy in mitochondria is virtually non-existent within an individual, likely due to a
‘bottleneck’ effect during either the development of the oocyte or the maturation of the zygote
(Stoneking and Soodyall, 1996).
As one can see in Figure 1, many of the genes code for proteins in the electron transport
chain, such as subunits of NADH dehydrogenase (N1-N6, N4L), cytochrome b, three subunits of
cytochrome oxidase (COI-COIII), and two subunits of F1ATPase (6 and 8). The 22 single letters
correspond to the genes encoding transfer RNAs, using the standard single letter code. Among
all the RNA- and protein-coding genes, there is a control region that does not code for anything.
A structure within the control region termed the displacement-loop (due to the formation of a
loop at this segment during replication, or even a three-stranded molecule of DNA) maintains the
origin of replication for the leading-strand. The lagging strand’s origin of replication is located
well away from the leading strand’s origin, but is dependent on the leading-strand for replication
to start—hence, this region controls replication of the mtDNA molecule (Clayton, 2000). For the
most part, mutations can accumulate there without adverse effects to the mitochondrion and the
organism at large, since no gene products are harmed.
4. Nelson 4
The mutation rate of the mitochondrial molecule can vary depending on the location in
the DNA sequence. There is more selective pressure on DNA segments encoding functional
products, so we will need to find the average mutation rate of non-coding regions and of coding
regions. There are two main ways used to track these mutations, and they are pedigree analysis
and phylogenetic estimates. There are two different types of sites within the control region:
variable and invariable. The variable sites have low selective pressure, so they should give an
accurate estimation of the substitution rate. The mutation rate of the control region according to
pedigree analysis is 0.48 × 10⁻⁶ substitutions per site per year (99.5% CI 0..26-.78), found by
using pooled data from 11 separate studies, with the average rate for the coding region being
0.15 × 10⁻⁶ substitutions per site year (99.5% CI 0.02-0.49) (Howell et al., 2003). The process of
finding the control region sequence was by analyzing the control region sequence and noting
where the sequence differed from the consensus sequence of the control region, and then using
chimpanzees as the outgroup for a reference point.
The average rate of change within variable sites of the control region using phylogenetic
analysis is 𝑣 𝑎𝑣𝑒 = 0.033 × 10⁻⁶ ± 0.006 × 10⁻⁶ substitutions per site per year (Hasegawa et al.,
1993). Hasegawa, et al. found the average substitution rate, 𝑣 𝑎𝑣𝑒, by multiplying the fraction of
variable sites, 𝑓 = 0.24 as assumed by the researchers, in the control region with the sum of the
transition rate, 𝑣𝑆 , and the transversion rate, 𝑣 𝑉 . These are given by 𝑣𝑆 = 2( 𝜋 𝑇 𝜋 𝐶 +
𝜋𝐴 𝜋 𝐺 ) 𝛼; 𝑣 𝑉 = 2( 𝜋 𝑇 + 𝜋 𝐶 )( 𝜋𝐴 + 𝜋 𝐺 ) 𝛽; and 𝑣 𝑎𝑣𝑒 = 𝑓(𝑣𝑆 + 𝑣 𝑉 ), where 𝜋 𝑋 is the frequency of
nucleotide 𝑋, and 𝛼 and 𝛽 are parameters that determine transition rate and transversion rate,
respectively. Hasegawa et al. do not divulge the values of 𝛼 and 𝛽 they used for the equations.
The inherent assumptions in these calculations is that each variable site is equally variable, and
the substitution is due to a Markov process.
5. Nelson 5
Hasegawa et al. also looked into the substitution rate of the third positions of codons
within an 896-bp segment containing parts of the genes for ND4-5 with sequences taken from
seven human mtDNAs (Kocher and Wilson, 1991, as cited by Hasegawa et al., 1993), due to the
low selective pressure in the third position of amino acid codons. These genes code for two
subunits of NADH dehydrogenase (ubiquinone). Using the same analysis as above, they found
the average substitution rate to be 𝑣 𝑎𝑣𝑒 = 0.047 × 10⁻⁶ ± 0.011 × 10⁻⁶ substitutions per site per
year, within the bounds of agreement of the control region mutation rate. This makes sense,
since both the control region and the third position of a codon should have little to no selective
pressure.
There is, however, some selective pressure to maintain a DNA secondary structure within
the control region during replication (Pereira et al., 2008). Pereira et al. explored why there is
heterogeneity in the substitution rate for stretches of the control region, in other words why there
are variable and invariable sites in the control region. Replication is not simply dependent on the
enzymes involved in replication; some secondary DNA structures, such as hairpin or cruciform
structures, can also be recognition sites for transcription factors. Doing statistical analyses on the
number of mutations present on a stretch of mtDNA, they found that one segment, a 93-bp
segment, had a significantly lower density of mutations than its flanking region. To calculate
whether selection was occurring on this segment, they calculated Tajima’s D value for 93-bp
intervals overlapping at 83 bp for the region between positions 15508 and 16510. A value of -
2.182 (P value < 0.01) was found for the same stretch of nucleotides where this previously
mentioned segment was predicted to be. Pereira et al. concluded this segment has thus
undergone negative selection.
6. Nelson 6
This negative selection was acting on this stretch of mtDNA to maintain a secondary
structure, illustrated in Figure 2. Evidence for this secondary structure comes from
compensatory base changes (CBCs), in which two mutations occur in opposite strands to
maintain structural integrity of the secondary structure (Pereira et al., 2008)—these CBCs were
found in this 93-bp segment. Furthermore, they found this structure to be very stable by
calculating its folding energy, which was lower than that of average random sequences. They
used a Z score to quantify that it was indeed significantly lower. Also, this sequence had a lower
free energy than all mitochondrial tRNA molecules except the gene for the cysteine tRNA. A
point to raise is that this is only during replication, i.e., when single-stranded molecules are likely
to undergo mutations, such as interactions with oxygen radicals. A double-stranded molecule,
such as those formed in the stems of this structure, is much more stable and not as likely to
undergo mutation (Pereira et al., 2008).
This selective pressure does not affect the rates found by Howell et al. (2003) and
Hasegawa et al. (1993), because the rates they found were for the variable regions in the control
region, not the regions under selective pressure. When the control region is not taken into
account by phylogenetic analysis, an estimated rate of mutation is 0.017 × 10⁻⁶ substitutions per
site per year (Ingman et al., 2000). Ingman et al. state there are 0.17 substitutions per site
between chimpanzees and modern humans. This rate is estimated from a divergence time of 5
Myr between modern humans and chimpanzees. For ease of reference and comparison, these
values are listed in Table 1 at the end of the paper.
An interesting point when discussing modern human origins is that we must use an
outgroup sequence to find the placement of the root on a phylogenetic tree. Many studies
generally had used chimpanzees as the outgroup (e.g. Ingman et al., 2000; Hasagewa et al.,
7. Nelson 7
1993), but the mtDNA length with which they were comparing was in the non-coding region,
which, as we have previously mentioned, evolves very rapidly—so rapidly, in fact, that
chimpanzee mtDNA may not be a good fit as an outgroup (Stoneking and Soodyall, 1996).
Fortunately, a method by Zischler et al. (1995) worked around this problem. Zischler et al. took
advantage of a migration of nuclear information from the mitochondria to the nucleus (Gray et
al., 1999) and used the mtDNA inserted into the nuclear genome as the outgroup. To do this,
they took nuclear DNA from the head of a sperm cell, which does not contain any mitochondria,
and searched for mtDNA segments within the sequence of the nDNA. There they indeed found
the appropriate sequence, and this was a better outgroup than chimpanzees. In other words, a
more accurate phylogenetic substitution rate could possibly be found in the future using the
transposed mtDNA segment in nDNA as an outgroup.
The next logical question to ask is why the two methods for finding the mutation rates
differ by such a wide margin. After all, the pedigree analysis is nearly three times larger than the
phylogenetic estimate. According to Pääbo (1996), phylogenetic analyses will detect mutations
no matter how fast they are evolving, while pedigree studies will tend to focus on fast-evolving
sites. Even though there is a discrepancy, neither the rate derived from pedigree analysis nor the
rate derived from phylogenetic estimation needs to be considered incorrect, or one correct where
the other is incorrect. They each can be applied to finding dates of differing lengths. For closely
related sequences, having shared a common ancestor within thousands of years, the pedigree
rates would give an accurate date of divergence. For sequences sharing a common ancestor
hundreds of thousands or millions of years ago, the phylogeny rates would give a better estimate
than the pedigree rate. While there is not a single factor that accounts for the disparity in the
8. Nelson 8
rates, both analyses shed more light on how the human mitochondrial genome evolved (Howell
et al., 2003).
An overall assumption in finding the substitution rate in mitochondrial DNA is that
recombination of molecules does not happen. Mitochondria indeed have a functional
recombinase, so it is theoretically possible for mtDNA molecules to recombine (Thyagarajan et
al., 1996). Mitochondria are normally inherited only from the mother. This makes sense since
most of the zygote’s organelles come from the egg. Anything from the sperm is preferentially
destroyed by the oocyte. Recombination between identically maternal mtDNA molecules at
replication forks would be undetectable (Kraytsberg et al., 2004), and thus not an issue that
affects the substitution rate. However, there is at least one case where an individual has inherited
mitochondria both paternally and maternally.
Kraytsberg et al. explore the mtDNA of this individual. This individual has both paternal
and maternal mtDNAs heterologous within the same cell, which thus have an opportunity to
recombine. The researchers explored the DNA with paternal-specific restriction digest
techniques and single-molecule PCR. PCR clones with specific maternal sequences were
scanned for paternal sequences, and these clones had alternating maternal and paternal segments.
This recombination had two structural classes: 1) a short paternal sequence inserted into a
maternal sequence, and 2) a maternal sequence bordered by paternal segments. There are three
distinct hotspots where recombination occurred, all sights related to mitochondrial replication.
In other words, mitochondrial recombination does not occur in a similar mechanism to
chromosomal crossover, where chiasmata can occur virtually anywhere. There was an observed
recombination frequency of ca. 0.7% of the total mtDNA within this individual’s muscle tissue,
but the authors caution that there are still unknowns, such as whether mtDNA from different
9. Nelson 9
sources is segregated into different cells producing mosaic individuals, separate mitochondria
within a cell, or separate nucleoids within the mitochondrial network, and that the frequency of
recombination may have been affected by selective forces on the paternal mitochondrial DNA
(Kraytsberg et al., 2004). However, it has been shown that fertilized maternal zygotes
preferentially eliminate paternal mitochondria (Stoneking and Soodyall, 1996)—in other words,
mitochondrial recombination is the exception and not the rule.
Mitochondria’s intimate relationship with the cell, a high copy number, a lack of
recombination, and a high mutation rate make it useful for human evolution studies (Stoneking
and Soodyall, 1996) and forensic applications (Butler and Levin, 1998). A high copy number
allows researchers to more easily obtain mtDNA for analysis, but also gives several levels in
which to research a population, namely “within a single mitochondrion, within a single cell,
within a particular tissue, within an individual, and within a group of individuals” (Pakendorf
and Stoneking, 1996). Knowing the mutation rate of the mtDNA can let us estimate back in time
when a divergence occurred. The lack of mitochondrial recombination allows us to trust with
certainty a particular substitution rate, since only changes in the nucleotides during replication
will show in analyses of sequences.
MtDNA is not just useful for modern-human origins studies. Butler and Levin (1998)
detail how mitochondrial DNA is useful for forensic studies. There are three main factors that
contribute to mtDNA’s usefulness in forensic applications: high sequence variation between
individuals within the control region, its efficient amplification in PCR with a small amount of
biological material, and its ability to withstand extreme environmental conditions. The high
sequence variation in the coding region is due to low selective pressure on the region since no
protein is coded, and, as we have seen, a high mutation rate. This low selection means everyone
10. Nelson 10
has a genetic “fingerprint” that is unique. There are many sources of mtDNA from a human
body. In addition to the places nDNA is found, such as skin, blood, semen, and saliva, mtDNA
can be found from teeth, bone fragments, and human feces, which often fail to yield nDNA in
sufficient quantities for forensic applications. Due to the high copy number per cell and its
resistance to extreme conditions, it is easier to recover mtDNA from ancient materials for
sequencing. They also mention that due to mtDNA being haploid (as opposed to diploid), it is
easier to sequence than nDNA.
An application the authors highlight is that of positively identifying the Romanov family
of Russian royalty, who had been buried over 70 years at the time of testing. The Romanov’s
bones were found to have an exact mtDNA sequence match between the three daughters of the
Tsarina, the Tsarina herself, and Prince Philip of the UK. Prince Philip’s maternal grandmother
was the Tsarina’s sister. Tsar Nicholas II was identified by comparing the mtDNA sequence of
the bones in the grave with that of the great-great-great granddaughter and the great-great
grandson of the grandmother of Tsar Nicholas II. There was only one heteroplasmic site in an
otherwise exact match. MtDNA from the Tsar’s brother contained the same heteroplasmy. The
bones found in the grave were confirmed, with 98.5% certainty, to be from the Romonovs. They
also used mtDNA to confirm the mtDNA from Anna Anderson Manahan, who had claimed to be
the missing Anastasia, was indeed an impostor.
Forensic investigators using mtDNA will tend to focus on hypervariable region I and
hypervariable region II, which are two regions in the control region of high polymorphism in
human populations. (These are the variable regions analyzed by Hasegawa et al. [1993].)
Investigators thus need to be aware of the substitution rate in the control region, such as knowing
that two sequences separated by a large amount of time will be different because of natural
11. Nelson 11
mutational alteration. This begs the question of what that amount of time is. According to
Piercy et al. (1993), the variability present between unrelated individuals is on average 1.1% in
the control region. From Table 1, the substitution rate for the control region is 0.475 (99.5% CI:
0.265-0.785) × 10-6 substitutions per site per year, and at 1100 sites in the coding region, there
are 5.22 × 10⁻⁴ substitutions per year.
For unrelated individuals, a difference of ca. 12 nucleotides is present within the coding
region (that is 1.1% of 1100). For a single substitution to occur would take ca. 1910 years,
equating to approximately 22,800 years to accumulate 12 nucleotide differences, and, assuming
an average generation time of 20 years for humans (Howell et al., 2003), a separation of 1140
generations is needed to attain the 1.1% difference. The offspring would then be considered
unrelated from the parental generation. The mtDNA substitution rate can thus be used to
positively identify family members, as in the Romanov case, or it can be used to find the bounds
of relation, as in our hypothetical case.
In this attempt to answer the question of how many generations it would take for relatives
to be just as dissimilar as nonrelatives, the mitochondrial evolutionary history needed to be
explored to provide context to the current shape of the mitochondrial genome. The structure of
the mitochondrial genome being split into a coding region and a noncoding, control region
necessitates two substitution rates to accurately portray the state of affairs within mitochondria.
The analysis to find these rates was based on some assumptions, namely that there is little to no
selective pressure in the variable regions of the noncoding segment and that recombination was
not present to skew substitution rates. These assumptions are not always true, as shown by the
individual having both maternal and paternal mtDNA, but the general rule still stands for when
the molecular mechanisms in development work correctly. Finally, using the substitution rate
12. Nelson 12
derived from pedigree analysis, it was shown how mtDNA can be used to identify unknown
remains, and it is also possible to forensically determine that it takes 1,140 generations for
relatives to be so distantly related that they are literally nonrelated. For future research on
phylogenetic analyses, a better outgroup than chimpanzees is that of mtDNA segments
transposed into nDNA. Using this outgroup would return a more accurate substitution rate,
leading to more valid applications of mtDNA’s substitution rate in future work.
13. Nelson 13
Appendix
Figure 1. A schematic layout of human mitochondrial DNA. There are 37 genes coding for
proteins and RNA, along with two origins of replication, one each for the heavy chain (OH) and
the light chain (OL) and the control region. Most of the protein-coding genes are for proteins in
oxidative phosphorylation. The mitochondrial molecule is circular because it is homologous with
bacterial DNA.
From Pakendorf, B., Stoneking, M. 2005. Mitochondrial DNA and human evolution. Annu. Rev.
Genomics Hum. Genet. 6: 165-183.
14. Nelson 14
Figure 2. Schematic representation of a 93-bp sequence in the mitochondrial control region that
forms a stable secondary DNA structure during replication. The stems of this structure have a
very low occurrence of mutations (represented by lighter colors), whereas unpaired nucleotides
have a higher occurrence of mutations (represented by darker colors). The stems have negative
selective pressure to maintain the pairing of the nucleotides in the stem, leading to the lower
substitution rate.
From Pereira, F., Soares, P., Carneiro, J., Pereira, L., Richards, M., Samuels, D., Amorim, A.
2008. Evidence for variable selective pressures at a large secondary structure of the human
mitochondrial DNA control region. Mol. Biol. Evol. 25: 2759-2770.
15. Nelson 15
Table 1. Pedigree analyses tend to give higher estimates of mitochondrial mutation rate than
phylogenetic analyses, and the coding regions have a lower mutation rate than the noncoding
region. All rates are in substitutions per site per million years, with the pedigree analysis
uncertainty being a 99.5% confidence interval and the uncertainty in the phylogenetic analysis
being ± 1 standard error.
a from Howell, N., Smejkal, C.B., Mackey, D.A., Chinnery, P.F., Turnbull, D.M., Herrnstadt, C.
2003. The pedigree rate of sequence divergence in the human mitochondrial genome: There is a
difference between phylogenetic and pedigree rates. Am. J. Hum. Genet. 72: 659–70
b from Hasegawa, M., Di Renzo, A., Kocher, T.D., Wilson, A.C. 1993. Toward a more accurate
time scale for the human mitochondrial DNA tree. J. Mol. Evol. 37: 347-354.
c from Ingman, M., Kaessmann, H., Pääbo, S., Gyllensten, U. 2000. Mitochondrial genome
variation and the origin of modern humans. Nature. 408: 708–13.
Method Noncoding Region Coding Region
Pedigree (Uncertainty) 0.475 (0.265-0.785)a 0.15 (0.02-0.49)a
Phylogenetic (Uncertainty) 0.033 (0.027-0.039)b 0.0170 (--)c
16. Nelson 16
Works Cited
Anderson, S.A., Bankier, A.T., Barrell, B.G., de Bruijn, M.H.L., Coulson, A.R., Drouin, J.,
Eperon, I.C., Nierlich, D.P., Roe, B.A., Sanger, F., Schreir, P.H., Smith, A.J.H., Staden,
R., and Young, I.G. 1981. Sequence and organization of the human mitochondrial
genome. Nature. 290: 457-465.
Andersson, S.G.E., Karlberg, O., Canbäck, B., Kurland, C.G. 2003. On the origin of
mitochondria: a genomic perspective. Phil. Trans. R. Soc. Lond. B 358: 165-179.
Butler, J.M., Levin, B.C. 1998. Forensic applications of mitochondrial DNA. Trends Biotechnol.
16: 158-162.
Clayton, D.A. 2000. Transcription and replication of mitochondrial DNA. Human Reproduction.
15: 11-17.
Fraser, C.M., Gocayne, J.D., White, O., Adams, M.D., Clayton, R.A., Fleischmann, R.D., Bult,
C.J., Kerlavage, A.R., Sutton, G., Kelley, J.M., Fritchman, J.L., Weidman, J.F., Small,
K.V., Sandusky, M., Fuhrmann, J., Nguyen, D., Utterback, T.R., Saudek, D.M., Phillips,
C.A., Merrick, J.M., Tomb, J.-F., Dougherty, B.A., Bott, K.F., Hu, P.-C., Lucier, T.S.,
Peterson, S.N., Smith, H.O., Hutchinson, C.A. III, Venter, J.C. 1995. The minimal gene
complement of Mycoplasma genitalium. Science. 270: 397-403.
Gray, M.W., Burger, G., Lang, B.F. 1999. Mitochondrial evolution. Science. 283: 1476-1481.
Hasegawa, M., Di Renzo, A., Kocher, T.D., Wilson, A.C. 1993. Towrd a more accurate time
scale for the human mitochondrial DNA tree. J. Mol. Evol. 37: 347-354.
Howell, N., Smejkal, C.B., Mackey, D.A., Chinnery, P.F., Turnbull, D.M., Herrnstadt, C. 2003.
The pedigree rate of sequence divergence in the human mitochondrial genome: There is a
difference between phylogenetic and pedigree rates. Am. J. Hum. Genet. 72: 659–70
17. Nelson 17
Ingman, M., Kaessmann, H., Pääbo, S., Gyllensten, U. 2000. Mitochondrial genome variation
and the origin of modern humans. Nature. 408: 708–13.
Klug, W.S., Cummings, M.R., Spencer, C.A., Palladino, M.A. 2015. Concepts of Genetics, 11th
ed. Pearson, Boston, MA, pp. 220-221.
Kocher, T.D., Wilson, A.C. 1991. Sequence evolution of mitochondrial DNA in humans and
chimpanzees: control region and a protein-coding region. Evolution of life: fossils,
molecules, and culture. Springer-Verlag, Tokyo, pp. 391-413.
Kraytsberg, Y., Schwartz, M., Brown, T.A., Ebralidse, K., Kunz, W.S., Clayton, D.A., Vissing,
J., Khrapko, K. 2004. Recombination of human mitochondrial DNA. Science. 304: 981
Lang, B.F., Burger, G., O’Kelly, C.J., Cedergren, R., Golding, G.B., Lemieux, C., Sankoff, D.,
Turmel, M., Gray, M.W. 1997. An ancestral mitochondrial DNA resembling a eubacterial
genome in miniature. Nature. 387: 493-497.
Pääbo, S. 1996. Mutational hotspots in the mitochondrial microcosmos. Am. J. Hum. Genet. 59:
493–96.
Pakendorf, B., Stoneking, M. 2005. Mitochondrial DNA and human evolution. Annu. Rev.
Genomics Hum. Genet. 6: 165-183.
Pereira, F., Soares, P., Carneiro, J., Pereira, L., Richards, M., Samuels, D., Amorim, A. 2008.
Evidence for variable selective pressures at a large secondary structure of the human
mitochondrial DNA control region. Mol. Biol. Evol. 25: 2759-2770.
Piercy, R., Sullivan, K.M., Benson, N. and Gill, P. 1993. The application of mitochondrial DNA
typing to the study of white Caucasian genetic identification. Int. J. Leg. Med. 106: 85-90
Sadava, D., Hillis, D.M., Heller, H.C., Berenbaum, M.R. 2011. Life: The Science of Biology, 9th
ed. Sinauer Assoc., Sunderland, MA, pp. 564-565.
18. Nelson 18
Satoh, M., Kuroiwa, T. 1991. Organization of multiple nucleoids and DNA molecules in
mitochondria of a human cell. Exp. Cell. Res. 196:137-140.
Stoneking, M., Soodyall, H. 1996. Human evolution and the mitochondrial genome. Current
Opinion in Genetics & Development. 6: 731-736.
Thyagarajan, B., Padua, R.A., Campbell, C. 1996. Mammalian mitochondria possess
homologous DNA recombination activity. J. Biol. Chem. 271: 27536–43.
Zischler, H., Geisert, H., Von Haeseler, A., Pääbo, S. 1995. A nuclear ‘fossil’ of the
mitochondrial D-loop and the origin of modern humans. Nature. 378: 489-492.