
Recommended
Recommended
More Related Content
More from SIMULIA
More from SIMULIA (8)
Recently uploaded
Recently uploaded (20)
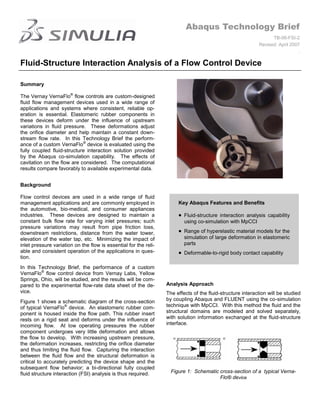
Fluid-Structure Interaction Analysis of a Flow Control Device
- 1. Abaqus Technology Brief TB-06-FSI-2 Revised: April 2007 . Fluid-Structure Interaction Analysis of a Flow Control Device Summary The Vernay VernaFlo® flow controls are custom-designed fluid flow management devices used in a wide range of applications and systems where consistent, reliable op- eration is essential. Elastomeric rubber components in these devices deform under the influence of upstream variations in fluid pressure. These deformations adjust the orifice diameter and help maintain a constant down- stream flow rate. In this Technology Brief the perform- ance of a custom VernaFlo® device is evaluated using the fully coupled fluid-structure interaction solution provided by the Abaqus co-simulation capability. The effects of cavitation on the flow are considered. The computational results compare favorably to available experimental data. Background Flow control devices are used in a wide range of fluid management applications and are commonly employed in Key Abaqus Features and Benefits the automotive, bio-medical, and consumer appliances industries. These devices are designed to maintain a Fluid-structure interaction analysis capability constant bulk flow rate for varying inlet pressures; such using co-simulation with MpCCI pressure variations may result from pipe friction loss, downstream restrictions, distance from the water tower, Range of hyperelastic material models for the elevation of the water tap, etc. Minimizing the impact of simulation of large deformation in elastomeric inlet pressure variation on the flow is essential for the reli- parts able and consistent operation of the applications in ques- Deformable-to-rigid body contact capability tion. In this Technology Brief, the performance of a custom VernaFlo® flow control device from Vernay Labs, Yellow Springs, Ohio, will be studied, and the results will be com- pared to the experimental flow-rate data sheet of the de- Analysis Approach vice. The effects of the fluid-structure interaction will be studied Figure 1 shows a schematic diagram of the cross-section by coupling Abaqus and FLUENT using the co-simulation of typical VernaFlo® device. An elastomeric rubber com- technique with MpCCI. With this method the fluid and the ponent is housed inside the flow path. This rubber insert structural domains are modeled and solved separately, rests on a rigid seat and deforms under the influence of with solution information exchanged at the fluid-structure incoming flow. At low operating pressures the rubber interface. component undergoes very little deformation and allows the flow to develop. With increasing upstream pressure, the deformation increases, restricting the orifice diameter and thus limiting the fluid flow. Capturing the interaction between the fluid flow and the structural deformation is critical to accurately predicting the device shape and the subsequent flow behavior; a bi-directional fully coupled fluid structure interaction (FSI) analysis is thus required. Figure 1: Schematic cross-section of a typical Verna- Flo® device
- 2. 2 Defining the sub-domain models The inherent symmetry in the VernaFlo® device allows an axisymmetric analysis to be performed. The Abaqus sub- domain (Figure 2) includes the rubber component, which is modeled using reduced order hybrid axisymmetric ele- ments. The rubber component presses against a rigid seat which Figure 3: Axisymmetric model of the flow path is modeled using a discrete rigid part. Penalty contact with a friction coefficient of 0.5 is defined between the rubber and the rigid seat. The simulation is completed in Abaqus/Standard and includes the effect of geometrical and material non-linearities. The CFD domain shown in Figure 3 models the flow path, which includes a short upstream section, followed by the section around the rubber component, and ending a long downstream section. The upstream variation in pressure is accounted for using a pressure-inlet boundary condition while the outlet uses a pressure outlet boundary condition with zero gage pressure. To enable local remeshing, the flow path is modeled using triangular elements. The wa- Figure 4: MpCCI interface definitions ter is modeled as an incompressible fluid and turbulence and multi-phase fluid models are employed to enable the simulation of cavitation. The flow equations are solved Addressing Domain pinching issues using the steady-state implicit segregated solvers in FLU- During the analysis, a constant fluid topology is required ENT. in FLUENT. As the rubber component deforms in re- sponse to the upstream fluid pressure, it will come into After the Abaqus and the FLUENT sub-domains have contact with its rigid seat, thus “pinching” the fluid domain been created the fluid-structure interface is defined using completely. Since pinching terminates the coupled analy- MpCCI. A schematic diagram of the interaction defini- sis, a special modeling technique has been used to pre- tions, which include the interaction surfaces and the de- vent such an occurrence. sired solution quantities to be exchanged, is shown in Fig- ure 4. Abaqus receives the fluid pressures from FLUENT As shown in Figure 5, the rigid contact surface in Abaqus and returns the resulting structural deformation to FLU- (dashed line) represents the true location of the rigid seat; ENT. however, the FLUENT wall zone that corresponds to the rigid seat has been slightly offset. The offset helps main- In addition, MpCCI automatically handles the transforma- tain a small, finite clearance at all times during contact tions necessary to account for the difference in axi- between the rubber insert and the rigid seat. While this symmetric conventions used by Abaqus and FLUENT. clearance leads to some localized flow behavior, the over- all impact of this gap on the constriction path and the cor- responding bulk flow behavior was found to be relatively small. Figure 2: Axisymmetric model of the rubber insert Figure 5: Contact offset to avoid domain pinching
- 3. 3 Solution Methodology The analysis is driven by an applied boundary condition on the fluid inlet pressure; specifically, this quantity is ramped up from 0 to 827 kPa (120 psi). During the simu- lation, the pressures acting on the rubber insert in the fluid sub-domain are mapped and transferred to the struc- tural sub-domain in Abaqus via MpCCI. Abaqus then computes the deformations and the resulting stress state in the structure. The interface deformation quantities are then mapped and transferred from the structural sub- domain to the fluid sub-domain in FLUENT via MpCCI. This process of exchanging solution quantities continues incrementally until the analysis completes. Figure 7: Computed bulk flow rate vs. inlet pressure Results and Discussions The main objective of the FSI analysis is to determine the effect of the variation of inlet pressure on the bulk fluid Effect of fluid flow on deformation flow rate through the device. After presenting these re- At any given inlet pressure level, the upstream surface of sults, the effect that each sub-domain has on the coupled the rubber device is subject to a fairly uniform pressure results will be examined. distribution. These forces acting on the leading surface are largely responsible for compressing the device and Global convergence forcing it down on the rigid seat. The pressure drop in the The fluid inlet pressure boundary condition is applied in constriction region contributes to further narrowing of the an incremental fashion; specifically, the pressure is in- flow path and results in a region of very high stresses as creased in fixed increments during the analysis. Global shown in Figure 8. convergence between the two sub-domain solvers is ob- tained by iterating the exchange process several times at Effect of deformations on the fluid flow the given pressure level. At a given deformation state, as shown in Figure 9, the The nature of the convergence for this analysis is appar- cross-section through the constriction path governs the ent from Figure 6, in which the displacement magnitude of flow behavior. As the flow quickens through the narrow the trailing edge of the rubber insert is plotted versus the constriction region the fluid pressure drops significantly, global exchange number. This plot considers the in- resulting in a dramatic drop in the absolute pressure of crease in pressure from 13.8 kPa (2 psi) to 34.5 kPa (5 the liquid; this may lead to cavitation in the fluid. psi). During each pressure increment, the converged so- lution was obtained after five global exchanges. Bulk flow rate vs. Inlet pressure The computed flow rate as a function of inlet pressure is shown in Figure 7. Initially, as the pressure is ramped from zero the flow rate increases. As the inlet pressure approaches 138 kPa (20 psi) the flow is found to stabilize at approximately 2.1 liters/min. Further changes in the inlet pressure do not affect the flow rate significantly. Flow Converged Figure 8: Mises stress in rubber insert at 276 kPa (40 psi) inlet pressure Figure 6: Displacement solution at trailing edge of rubber insert
- 4. 4 Flow Figure 10: Static flow pressure at 138, 414, and 621 kPa Flow Figure 9: Static flow pressure at 276 kPa (40 psi) inlet pressure Fluid-structure coupling effects on the flow rate Figure 11: Mises stress at 138, 414, and 621 kPa inlet Figure 10 shows contour plots of the fluid pressures at pressure (20, 60 and 90 psi) inlet pressure levels of 138, 414, and 621 kPa (20, 60 and 90 psi). The corresponding deformed shapes are shown in Figure 11 with contour plots of Mises stress. With an increase in the inlet pressure the rubber device deforms and experiences increased contact with the rigid seat. Partial contact is observed at 138 kPa, with full con- tact being established at the higher pressure of 621 kPa. The constriction path narrows during the inlet pressure rise resulting in an increased resistance to the fluid flow. Flow However, the increased material stiffness helps maintain the bulk flow rate at a fairly constant level. Figure 12: Volume fraction of vapor at 276 kPa (40 psi) Cavitation inlet pressure As discussed earlier, cavitation effects are observed at higher upstream pressures. Figure 12 shows the vapor region in the flow at an inlet pressure of 276 kPa (40 psi). The phase change is prominent in the downstream region right after the narrowest flow path. As the inlet pressure increases the vapor envelope stretches further down- stream but the vapor region collapses before reaching the outlet. Experimental Validation Finally, the results from the analysis are compared to ex- perimental results. Figure 13 shows a close match of the computational flow rate results to the experimental data. The flow rate increases from 0 to 2.1 liters/min during the initial pressure ramp-up from 0 to 138 kPa (20 psi) and Figure 13: Experimental validation of computation results has near constant flow in the operating pressure range of 138 to 827 kPa (20 to 120 psi). class of problems and successfully demonstrates the capability of Abaqus to perform such advanced coupled Conclusion physics simulations. In this Technology Brief, a fluid structure interaction analysis of the VernaFlo® flow control device using the Acknowledgments Abaqus co-simulation technique for FSI is presented. The Dassault Systèmes SIMULIA Corp. would like to thank results obtained are in good agreement with experimental Jim Bailey at Vernay Labs for providing the model and results. This study highlights the importance of FSI in this experimental data for the Vernay VernaFlo® device; and David Schowalter at Fluent, Inc. for assisting with the cavitation modeling.
- 5. 5 References 1. Vernay VernaFlo® flow devices and related product information can be found at: www.vernay.com. Abaqus References For additional information on the Abaqus capabilities referred to in this brief please see the following Abaqus 6.11 docu- mentation references: Abaqus Users' Guide on Fluid Structure Interaction Using Abaqus and FLUENT, available via Abaqus Answer 2420. Abaqus Analysis User's Manual - “Co-simulation: overview,” Section 16.1.1 FLUENT References 1. For additional information on Fluent Inc. and the FLUENT capabilities shown in the brief see: http://www.fluent.com. MpCCI References 1. For more information on MpCCI and Fraunhofer SCAI see: http://www.scai.fraunhofer.de About SIMULIA SIMULIA is the Dassault Systèmes brand that delivers a scalable portfolio of Realistic Simulation solutions including the Abaqus prod- uct suite for Unified Finite Element Analysis, multiphysics solutions for insight into challenging engineering problems, and lifecycle management solutions for managing simulation data, processes, and intellectual property. By building on established technology, re- spected quality, and superior customer service, SIMULIA makes realistic simulation an integral business practice that improves prod- uct performance, reduces physical prototypes, and drives innovation. Headquartered in Providence, RI, USA, with R&D centers in Providence and in Suresnes, France, SIMULIA provides sales, services, and support through a global network of over 30 regional offices and distributors. For more information, visit www.simulia.com The 3DS logo, SIMULIA, Abaqus and the Abaqus logo are trademarks or registered trademarks of Dassault Systèmes or its subsidiaries, which include ABAQUS, Inc. Other company, product and service names may be trademarks or service marks of others. Copyright © 2007 Dassault Systèmes