SlideShare ist ein Scribd-Unternehmen logo
1 von 21
Notes on China Conference, company visits in Beijing, analyst visits in Hong Kong
7th November 2012 to 10th
of November 2012
Conclusion
Chinese growth is the most important determinant of global GDP growth
US,
14.5%
Euro area, -
9.5%
Japan, 15.2%
UK, -5.2%
Canada, 1.3%Asia Pacific ex
China, 38.3%
China, 39.6%
Latin America,
11.5%
EEMEA, 8.4%
GCC, 6.7%
2012 Nominal GDP Growth (% of World)
US, 17.5%
Euro area, -
1.8%
Japan, 4.0%
UK, 0.7%
Canada, 2.2%
Asia Pacific ex
China, 21.5%China, 38.9%
Latin
America,
13.1%
EEMEA, 10.3%
GCC, 3.4%
2013 Nominal GDP Growth (% of World)
Source: Bloomberg consensus forecasts for real GDP and CPI and Ovi
Page 1 of 21
There are 2,200 companies in Asia, against 1,700 companies in the United States, with greater than
$1bn in market capitalization. This demonstrates the depth of corporate Asia. There are more IPOs in
Asia than in any other part of the world, three out of four IPOs are Asian.
Within China, companies are developing from being national to being regional to being global. This is
starting to happen through mergers and acquisitions of which 30% are natural resources.
The new normal will be that Chinese GDP growth will slow to 6 to 7% because of demographics and
the law of large numbers. In 2013 and 2014, GDP growth is expected to be 8.1% and 7.9% against
7.7% in 2012.
Evolution of China
When I first went to China in 2002, the focus of my conclusions were that we should invest in what
China was short of and avoid competing against China where its low labour costs gave it advantage. In
2012, Chinese labour costs have risen substantially so it can no longer rely on GDP growth based on
foreign direct investment, infrastructure and a manufacturing industry advantaged by low labour
costs.
China has a great sense of its history as a dominant economic power and is fiercely focused on re-
achieving its preeminence. This is why I believe it will take the necessary actions to adapt its regulation
and policies to allow its economy to evolve to the next stage of development. It has always had the huge
contrast between a centralised communist government and an underlying, buoyant, entrepreneurial
micro culture. The perception is that the last 10 years have been a period of consolidation on the
substantial changes achieved in the 90s, in particular to the banking system. The hope, and reasonable
expectation, is that the new leadership will introduce "capitalist" reforms, allowing consumption to
grow as a percentage of GDP and social welfare systems to develop, something which they have not
been successful in achieving in the last couple of years despite the rhetoric. There are clearly huge
Page 2 of 21
problems to address but China has the advantage of a centralised government not hampered by
democracy, which allows it to be more effective, if it can avoid corruption.
The challenges that China faces include:
1. To rebalance its economy from investment to consumption
2. Its income inequality
3. The environment.
A key problem is income inequality - as it is throughout the world. China needs to improve its
investment efficiency and shift from capital intensive to labour intensive investment. Household income
is a small percentage of GDP with corporate profits large. The median income is 30% lower than the
mean income because of income inequality and is $2,500 now. The middle class is growing at 11%
CAGR. China needs to grow its services industries. Corporate profits will be pressured by social
contributions. Fiscal policy needs to redistribute by funding education, health and the pension system.
This is against the background of its key policy commitment since the noughties of social harmony.
Every 1RMB spent on social welfare generates 2RMB of GDP.
Asia is driven by export growth and China is the main export hub. Investment has grown at 10 ½%
per annum over the last 30 years whereas consumption has grown at 9 ½% per annum.
Demographics suggest savings has peaked and will now reduce.
Triple turning points 1. labour is tight 2. land is tight and 3. shortage of financing.
China provides 25% of global savings. China needs to shift its economic model to grow at 7 to 8% for
the next 20 years. The key is allocation of capital.
Page 3 of 21
China is different
Microsoft makes as much money in Holland as it does in China! The culture is that software is free in
China and Qihoo provides its consumer security software for free, relying on advertising to monetize
it.
Contradictions in China
Communism Capitalism
ageing population and government young management
luxury bargain
free market tariffs
iPhone free software
risk averse aggressive investment
infrastructure overbuild Beijing traffic jams
Profitability Headwinds – margins to decline
Competitiveness has been eroded because domestic wages are up 90% in the last four years.
Corporate profits are going to be reduced because of social contributions. This will be reflected in
fiscal policy which will be geared to redistribution in terms of education health and the pension system.
The Chinese stockmarket has underperformed for three years. There has been CROCI contraction in
China since 2009, falling by at worst 30% to at best 9%. The free float of Chinese companies is $600
billion, two thirds of which are SOEs. A third are private and half of the private are Internet.
Companies generally have a funny non-ownership structure.
Page 4 of 21
Page 5 of 21
Debt, Banking, Misallocation of Capital
The banking system is still mostly available to the SOEs and large companies. A bond market is
starting to develop. One of China’s great strength is its entrepreneurial culture, which has allowed
small businesses to develop, funded by cashflow only.
Within the last four years, debt has doubled, M2 has doubled. There has been a misallocation of
capital with the last man standing funded by shadow banking. There needs to be a rebalancing
between capital and labour.
Real level of non-performing loans at banks is 5 to 10%. Debt levels are much higher than before.
The IMF has study studied the Chinese banking system and believes it can withstand big industrial
shocks. Non-performing loans in the banking system are somewhere between 1-10%.
Poverty
600 million people have been moved out of poverty since 1978.
In many rural villages, poverty remains. I travelled with a lady who this year had visited her father in
law in a village where there was no water supply, there is now a well but no electricity. China has huge
disparity between the rich and the poor and there remain many Chinese living in poverty.
Capital, Fixed Asset Investment, Infrastructure Spending, Commodities
In 2008, the stimulus was RMB4 trn., 8% of GDP. China’s slowdown results from the ending of the
2008 stimulus, government tightening and the problems in Europe.
Page 6 of 21
China’s investment/GDP ratio is very high compared to even the highest levels seen during the Asian
growth stories in the 20th century.
Capital stock in China is still low. Fixed asset investment can continue to grow and the level of 50% of
GDP is sustainable.
Page 7 of 21
China’s resource intensity has increased rapidly over the last few years. However, overall over the last
20 years, it has come down substantially and the recent strong growth was a blip. Energy efficiency is
increasing so resource intensity will reduce. Resource productivity is increasing by 3 to 4% per annum
and this is likely to increase to 5 to 6%. Chinese steel consumption has moved from infrastructure to
machinery. Fixed asset investment in China at 40% of GDP has resulted in 10% GDP growth. 25%
fixed asset investment in India has resulted in 6 to 7% GDP growth.
Page 8 of 21
Iron ore prices are showing some improvement. Steel demand has historically been a multiple of 1.2 to
1.3 times GDP growth but is now 0 .6 times and GDP growth has slowed from 10% to 7%. Industry in
the meantime remains geared up to higher growth. The big 4 mining companies spent $200 billion on
new supply.
$135 barrel per oil price puts the global economy at risk at 7.5% of world GDP.
There has been poor capital allocation with 18% illegal employment, just like in the US, in the construction
sector. 180 million people are employed in the construction sector. Recently there has been unprecedented
volatility e.g. in the iron ore price. Resources in China are limited and gas can only increase from 3% of
energy to 8% at best. Coal will remain at 40 to 50% of energy supply. Re shale gas, the infrastructure
is not there and will not be there at the earliest for 15 to 20 years. Within 20 years, China will have to
import 80% of its oil demand.
In China, they are currently not paying for water. China has to decide between rice and heating. This
applies to the mining, power and food industries. As they have urbanised, there has been no investment in
sewage. 51% of rivers are polluted. Generally water is far too cheap, at $0.20-$0.30 per thousand litres
whereas in the OECD it is $2-$4 50. The cost of beer is at a 62% discount in China to the OECD, with
the cost of water the key differentiator.
The Chinese construction industry is labour constrained with the average age 45. Little insulation is
put into buildings. The 1990s was the decade of manualisation. Labour instead of capital. Since then,
labour and government have taken a smaller share. In 2008 to 2009, costs increased and there was
margin compression.
Now we have the combination of cost inflation and slower topline, with asset turns slowing as balance
sheet growth slows. Working capital has exploded in China and there are commodity cost pressures.
Property
Tier 1 cities - prices are still increasing. The government will tighten until April 2013. It is possible there
could be a crash in Tier 3 cities as there is a bubble. Tier 3 land is available for 10 years of development.
The target for affordable housing is 7 million and this is likely to be met. Land supply is inadequate and there
is a shortage of land supply in Tier 1 cities. There is 900mn m² of demand with a land bank of only
28mn m² .
Luxury
There has been a gradual decrease of tariffs. Historically, there were no luxury brands as these were
restricted to the Emperor and forbidden by Mao. Chinese luxury brands are expected to evolve over
the next 10 years. The market is expected to evolve: from small pieces to large items such as houses,
yachts, cars. From pursuits to demands; from material to culture; from worship of West to love of
China.
Healthcare
The cash flow from Chinese hospitals depends on revenues from drugs. The stated policy is to copy
Western drugs. 2800 hospitals account for 80% of the drug demand. Healthcare expenditure is 5.5%
of GDP. It depends on the sale of drugs to survive, 52% of revenues.
Page 9 of 21
Smartphones
The iPhone is number six or seven overall in the smart phone market. There are 270 million smart
phones overall of which are 110 – 160mn are at the high end. This compares to the US of 100 million.
In the US, Apple has a 25 to 30% market share whereas in China it has a 10% market share. China
Mobile controls 70% of the 1 billion subscribers. You can buy a phone and use a China Mobile Sim.
Samsung has a monopoly position in the high-end with support from the big three. It has a high teens
market share. The telephone companies promote Samsung not Apple. Both companies and Qualcomm
are beneficiaries of Chinese growth.
Consumption
Consumption has been held back by 1. Macro 2. Hyperinflation of the last few years – very expensive.
20 to 30% same store sales growth has been driven by average selling price increases. The whole sector
will become oversupplied over the next few years and there will be a structural derating.
The increase of consumption within GDP hasn’t happened yet because of the global financial crisis. A
theme going forward is the low end consumer which you can play through a company such as Daphne.
The new entrants to the labour force aged 16 to 24 are starting to decline. Household income has
grown much slower than GDP for the last 20 years. Going forward, it will grow faster. Wage inflation
has been in the mid-teens, 10% real. The middle class is made up of people earning more than $3,000
per annum. It is 30% of the population. Generally there are three people per household so this is
equivalent to $10,000 per person. There will be a surge in consumption growth as household income
grows.
From 2010 to 2015, there will be a 25% increase in the 65+ age group in China, Taiwan, Korea and
India. A natural way to play this would be life insurance but this has been sold assuming too high
interest rates.
Sally Godley Maynard 4/12/12
Page 10 of 21
General Notes
Introduction to conference
The Chinese market trades on 8x forward earnings, a 27% discount to other markets. The S&P trades on 12x
forward earnings.
There are 2,200 companies in Asia, against 1,700 companies in the United States, with greater than $1
billion in market capitalization. This demonstrates the depth of corporate Asia. There are more IPOs
in Asia than in any other part of the world, three out of four IPOs are Asian.
Within China, companies are developing from being national to being regional to being global. This is
starting to happen through mergers and acquisitions of which 30% are natural resources.
The renminbi bond market is $100 billion now. The high yield market will develop and this will facilitate
private equity. This will be followed by modern capital structures like LBOs.
Private Equity is $400 billion of assets under management, 2x the level 5 years ago. Money is flooding in and
there are more and more deals.
US economy
Mr. Li Yong, Vice-Minister of the Ministry of Finance of China
The US economy is recovering with the stabilisation of the banking industry.
2012 started stronger, caused by the mild winter. As a result, the spring was weak. The trend level of
economic growth is now 2%. Drags on growth are capital spending, which is weak, as well as poor
employment gains, although these are better than expected.
The fiscal cliff will not be addressed until after the election. It requires at least fiscal tightening of $160
billion per annum. This can be arrived at by the payroll tax which will generate $120 billion. Extended
unemployment benefits account for $40 billion and across-the-board spending cuts would generate $110
billion. The Bush tax cuts are worth $160 billion. The Simpson Bowles plan requires shared sacrifice and
gradual austerity. This is unlikely and the most likely outcome is three stage austerity, with payroll cults and
perhaps allowing the unemployment benefits to expire. Modest discretionary spending cuts of $40 to $80
billion may be possible in February as well as small income tax increases in April.
Chinese Macro
Mr. Jin Liqun, Chairman of the Board of Supervisors, China Investment Corporation
The biggest drag on the Chinese economy has been the weakness of exports and of investment in property.
Export growth has stabilised. Home sales have improved as the Chinese government changes its policy.
Growth is expected to be 8.3% in the first half of 2013.
The new normal will be that GDP will slow to 6% growth because of demographics and the law of
large numbers. In 2014, GDP growth is expected to be 7.7%.
The biggest risk in China is political accountability and the rise of the middle class.
Page 11 of 21
Competitiveness has been eroded because domestic wages are up 90% in the last four years. Another
big risk is the strong upward momentum in property prices. In September/October 2011, there was a sudden
big drop in property transactions. This can happen any time.
Within the last four years, debt has doubled, M2 has doubled. There has been a misallocation of
capital with the last man standing funded by shadow banking. There needs to be a rebalancing
between capital and labour. 50% of demand has come from investment and investment is 47% of GDP.
This ratio is overestimated as investment is overestimated and GDP is underestimated and is more like 36 to
40%. The middle stage of development is infrastructure building. The potential growth rate is now 8%. The
most likely policy changes are the abolition of the one child policy and of the agricultural tax.
Presentation by Merrill Lynch’s economist and strategist for China. They disagree with each other!
Mr Ting believes that there are 500 billion of bad debts in the banking system. This has doubled to 1trn,
which is 1.5% of existing loans. The debt at local government level is only up marginally increasing from 47
to 49%. The Chinese government system has the capacity to absorb this. Commercial debt is 5 trillion with
local government debt 10 trillion.
Mr Cui believes that the real level of non-performing loans is 5 to 10%, most likely 10%! He believes that
at the end of 2007 this was 3 ½%. Local government debt has increased from 1trn to 10trn. Debt levels are
much higher than before. Fiscal revenues are under tremendous pressure. Commercial banking is under
pressure. Wealth management products in banking have the same characteristics as CDOs. The market
doesn’t care if they are paid back and sells as much as possible to get the highest yield.
Chinese banks trade on a 16% ROE and 1x book value with a 4 to 5% yield. Ting is positive whereas Cui
thinks it’s a value trap.
Dr. Justin Yifu Lin, Professor in Peking University, Former Chief Economist and Senior VP, World
Bank
Historically, China has benefited from long term growth and reforms. From 1979 to 1990, GDP was 9% per
annum. From 1990 to 2011, GDP growth was 10.4% per annum. In 1979, China had less than one third of
the income per capita of sub-Saharan Africa. Since then, 600 million people have been moved out of
poverty. It was only 25 years ago, that there was the second privately owned car. Today the income per
capita is $5,400 in 2011. In 2008, the stimulus was RMB4 trn. China’s slowdown results from the
ending of the 2008 stimulus, government tightening and the problems in Europe.
On the bus, I met a Malaysian lady with a Chinese father-in-law, whom she had recently visited. He lived in
a rural village in South China. Until recently, there was no water supply. There is now a well but there is
no electricity. All the food is grown from the land. China has huge disparity between the rich and the
poor and there remain many rural Chinese living in poverty.
At the 18th
party congress, GDP growth was forecast to be 8% per annum for the next five years. Total
accumulated government debt is 40% of GDP. In 2008, China had 21% of the US per capita income. From
1951 to 1971, Korea and Japan grew at 9.2% per annum. From 1977 to 1997, GDP has grown at 7.6% per
annum in Korea. This shows that high growth rates can be sustainable as an economy industrialises. 8% per
annum GDP growth for the next 20 years is achievable. Investment as a percent of GDP increased to
66% in Japan in 1971 and 50% in Korea in 1997.
Page 12 of 21
The challenges that China faces are:
4. To rebalance its economy from investment to consumption
5. Its income inequality
6. The environment.
Household savings is 20% of GDP with corporate and government the balance.
There is too much concentration of income towards rich people and corporations.
The G7 currently accounts for 58% of GDP. From 2000 to 2009, China accounted for 25% of GDP growth,
the US 22% and India 6%. China is still in a high carbon stage. Currently, China employs 85 million people
in labour intensive sectors. This will be transferred to lower income countries. GDP is $8 trillion, half the
size of the USA, with 1.3 billion people. Japan had half the US population in the 1970s, so is a valid
precursor. Resource constraint is not a problem according to Lin. A virtuous circle is created by Chinese
growth, which is not resource constrained. It is like the capital goods cycle in Germany. It requires the
optimal allocation of resources.
Mr. II Houng Lee, Senior Resident Representative, China, International Monetary Fund– middle
income trap
Asia is driven by export growth and China is the main export hub. Investment has grown at 10 ½%
per annum over the last 30 years whereas consumption has grown at 9 ½% per annum.
Korea and Taiwan are the only countries that have broken away, helped by export growth and investment.
How dependent is consumption on investment? China’s current investment of some 40% of GDP is much
higher than for developed countries. The scope for further investment in non-eastern provinces is limited.
The overinvestment is not sustainable with financing a major constraint. In the case of the Asian tigers, this
led to the 1998 crisis. China is different but still the strain is likely. Local government financing is reducing.
Agricultural land has been reduced for food production. Demographics suggest savings has peaked and
will now reduce.
Triple turning points 1. Labour is tight 2. land is tight and 3. shortage of financing.
China provides 25% of global savings. In the short run, there is plenty of policy flexibility. China needs to
shift its economic model to grow at 7 to 8% for the next 20 years. The key is allocation of capital. China
is protected by its high savings even compared to Asian countries. The IMF has study studied the Chinese
banking system and believes it can withstand big industrial shocks. Non-performing loans in the
banking system are somewhere between 1-10%.
The key problem is income inequality. China needs to improve its investment efficiency and shift from
capital intensive to labour intensive investment. It needs to grow its agricultural and services
industries. Corporate profits will be pressured by social contributions. Fiscal policy will redistribute
by funding education, health and the pension system.
Corporate profits are going to be reduced because of social contributions. This will be reflected in
fiscal policy which will be geared to redistribution in terms of education health and the pension system.
Chinese banks and shadow banking
Page 13 of 21
This session was completely packed out.
There has been a significant rise in non-performing loans from the low level of 1% to 2% to 3 to 4% in 2013.
The outlook is stable with a healthy net interest margins. The banks have good loan loss reserves buffers.
Equity to loan book is 10% and liquidity is strong. The loan to deposit ratio is 70% for the whole banking
industry, which is low in an international context. Overall in a global context, the Chinese banks ranked 5/10.
Non-performing loans can be absorbed through operating profit. The outlook depends on economic growth.
There are 1,700 billion of assets in the shadow banking industry of which 50 billion are invested in
infrastructure, 60 billion in stocks. The real estate investment has reduced to 30bn and is a small part. Mining
is 20 billion of which coalminers predominate. The trust market size will exceed that of insurance by the end
of this year.
Property
Tier 1 cities - prices are still increasing. The government will tighten until April 2013. It is possible there
could be a crash in Tier 3 cities as there is a bubble. Tier 3 land is available for 10 years of development.
The target for affordable housing is 7 million and this is likely to be met. Land supply is inadequate and there
is a shortage of land supply in Tier 1 cities. There is 900mn m² of demand with a land bank of only
28mn m² . Tightening monetary policy will restrict property prices. Mixed-use property will increase.
Urbanisation will increase Tier 2 cities. The premium market is 10% of the market. Demand will exceed
supply for the next 10 years. At that point, urbanisation will reach 70% and demographics will plateau or
weaken market. There is a commercial property bubble e.g. in Chengdu.
Luxury
In developed markets, the key group is aged 45, whereas in China it is aged between 25 and 50. This is now
narrowed so that the fastest growing group is 25 to 30.
1. the target market is younger in China, it used to be dominated by men, it is now increasingly female
2. there are no domestic brands
3. early phase. It is generally personal accessories but is expected to evolve into lifestyle/appearance
experience goods. There are 175 million consumers in China.
4. Purchases are generally made in large shopping mauls or when travelling.
There has been a gradual decrease of tariffs. Historically, there were no luxury brands as these were
restricted to the Emperor and forbidden by Mao. Chinese luxury brands are expected to evolve over
the next 10 years. The market is expected to evolve: from small pieces to large items such as houses,
yachts, cars. From pursuits to demands; from material to culture; from worship of West to love of
China.
Presentation by World Bank, Ms. Chorching Goh, Lead Economist, World Bank China
China will find a current account deficit difficult to cope with because of its poor financial regulations. It is
dependent on foreign technology deployment. It needs to move up the value chain. The World Bank 2030
report focuses on urbanisation and that China’s cities are not large enough. China has done well on the back
of manufacturing and exports, with a low share of consumption. It has grown at 9% real for the last 15 years,
which is very strong versus Korea and Japan. Household and labour income as a percent of GDP are low.
China’s middle class at 12% is very small compared to Korea, Japan, Brazil at similar development
points. It needs to evolve into a knowledge based economy. There is high expenditure on research and
Page 14 of 21
development at 2% of GDP. The mobility of China and the Chinese workforce needs to be improved.
There are too many taxes on labour. The access to credit is very difficult for small enterprises. Land,
labour and capital are all problems. The urbanisation rate of 1% per annum is not fast enough.
Daimler
China has low car density and low urbanisation. Two thirds of Daimler’s volumes come from the East Coast.
There are 41 cars per 1,000 people against 417 to 522 in developed countries. Brazil has 137.
e-commerce
The gross market value was $135 billion in 2011. Growth is expected to be double digits in 2012. It is close
to the level in developed markets at 3.1% of nominal GDP against 1.5% in the United States. It is 10% of
retail sales.
McKinseys Dr. Jonathan Woetzel
China’s resource intensity has increased rapidly over the last few years. However, overall over the last
20 years, it has come down substantially and the recent strong growth was a blip. The service sector is
growing. Energy efficiency is increasing so resource intensity will reduce. A 3 to 4% decline in resource
intensity is very achievable. Resource productivity is increasing by 3 to 4% per annum and this is likely
to increase to 5 to 6%. Energy demand is predominantly industrial. As standards of living increase,
resource consumption will increase. Steel intensity is much higher in China than in Brazil. Chinese steel
consumption has moved from infrastructure to machinery. Korean and Japanese infrastructure build has
been high, it is a competitive advantage. In China, the urbanisation process is happening at an earlier stage of
development. The build out of living space, at 33 m² is equivalent to Singapore. There has been a real estate
overbuild. Fixed asset investment at 40% of GDP implies 10% GDP growth. 25% fixed asset investment
in India implies 6 to 7% GDP growth.
There has been poor capital allocation with 18% illegal employment, just like in the US, in the construction
sector. 180 million people are employed in the construction sector. Recently there has been unprecedented
volatility e.g. in the iron ore price. Resources in China are limited and gas can only increase from 3% of
energy to 8% at best. Coal will remain at 40 to 50%. Re shale gas, the infrastructure is not there and
will not be there at the earliest for 15 to 20 years. Within 20 years, China will have to import 80% of its
oil demand.
Reform is needed of the shadow banking system and the financial system generally. The question is whether
a shock is needed to force reform. The population is 53% male, 47% female and this is going to go to 55/45.
China is threatened if it does not reform and is inclined to say one thing and allow something else to happen
in practice. McKinsey’s does not believe the transition has caused any slowdown. What is needed is more
reform, in particular financial.
Rural migration has disenfranchised 10% of the population. By 2030, migrants will be 40%. This is a
barrier to productivity. It would cost 2% of GDP to give benefits to migrants.
GDP growth of 9 to 11% has been too high and created too much fixed capital. It will be good for the
economy to slow to 7% as the focus needs to be productivity and transparency.
Page 15 of 21
It is good for growth to slow to 7% and will encourage productivity. In Brazil, when urbanisation went up
from 55 to 70%, there was inflation and capital left the country so this is a risk to take into account. Capital
needs to be put to work in the service sector.
Commodities and Oil – Francisco Blanch Head of Commodities BAML
The price of oil has moved alongside the expansion of the Federal Reserve balance sheet. Otherwise,
commodities have been weak and only commodities which are rare are holding up well and following the
Fed balance sheet. Iron ore has had strong production growth. This has not been the case for oil or natural
gas, where production growth has been slower than GDP. It is a concentrated market so it can be controlled.
Commodities have been closely linked to the global financial crisis. The current account problems are at the
root of the European problems and oil is at its heart. The countries in recession in 2012 are oil short
countries.
There is a $900 million energy carry to the United States. Energy costs are falling. Natural gas is three dollars
in the US, $12 in Europe and $18 in Japan. This is a huge advantage to the US. The US is focusing on energy
utilisation, using its low interest rates to address.
$135 barrel per oil price puts the global economy at risk at 7.5% of world GDP.
US oil production is exploding, fixing the US economy. Chinese oil production is flat. Chinese steel
consumption is half a kilogram per person, which is the same as the US in the 1960s. China has four times
the GDP per capita of India. Corn prices tend to be tied to energy prices. They need to be pushed out of the
energy pool into the food pool.
Mobility
In the US, it is 13 times, the UK 7 times, Russia 2 times during working life.
Healthcare reform - Mr. WANG Bo, VP of China Pharmaceutical Enterprise
Association
Chinese healthcare system is unique with complicated sales, marketing, distribution systems, like Germany
and the US were 20 years ago. The cash flow from Chinese hospitals depends on revenues from drugs.
The system is growing at 21%, 2 ½ times the GDP growth rate. Demand is likely to grow at 20% per annum.
There are 4,800 pharmaceutical manufacturers and 230,000 healthcare providers. 80% of drugs are sold
through hospitals with kickbacks and there are 13,000 wholesale distributors! This is difficult to regulate
(there are three in the United States, which controls 97% of the market). The stated policy is to copy
Western drugs. 2800 hospitals account for 80% of the drug demand. Healthcare expenditure is 5.5%
of GDP. It is RMB2 trillion, 30% of expenditure, with 24% of the global population. Education is 34% of
expenditure. Healthcare overall has had 14 to 18% growth in expenditure. It depends on the sale of drugs to
survive, 52% of revenues. Quality is inconsistent in China.
Nigel Tupper BAML – Head of Asia Pacific Equity Strategy
& Chief Global Quantitative Strategist
Infrastructure is $3,000 per capita in China against $30,000 per capita in the US. His wave ticked up to
0.66 with QE but is now 0.55. Asian central banks have cut by 1% and put in place fiscal stimulus – India,
Korea, Malaysia, Singapore, Taiwan and Thailand. Asia-Pacific central bank policy is coincident with the
global wave. Asia outperforms when the global wave outperforms. Tupper is underweight Asia-Pacific now.
Page 16 of 21
Valuation is not a catalyst and quality is expensive. Asia is dependent on Western demand and is
deleveraging. 45% of GDP is exported for the whole of Asia including China.
Asean is Indonesia, Philippines, Singapore, Thailand and Malaysia. Indonesia has very strong demographics.
High ROE is the best performer, low margin, high asset turn multiplied by high leverage.
Technology Simon Woo BAML analyst
Rising asset turn is positive. China Mobile has 700 million subscribers, half of which are smart phones. They
don’t want to promote the high end. 2 and 2 ½ G is 80% with 3G only 20% and pure 3G only 10%. CM don’t
sell Apple. China Unicom is the main promoter and you can get an Apple phone separately. China Mobile
promotes Samsung. The iPhone is number six or seven overall in the smart phone market. There are
270 million smart phones overall of which are 110 – 160mn are at the high end. This compares to the
US of 100 million. In the US, Apple has a 25 to 30% market share whereas in China it has a 10%
market share. China Mobile controls 70% of the 1 billion subscribers. You can buy a phone and use a
China Mobile Sim. Samsung has a monopoly position in the high-end with support from the big three.
It has a high teens market share. The telephone companies promote Samsung not Apple. Apple supplies
through stores. There is a problem with the supply of the iPhone five. The Apple ecosystem is very Apple
specific and it is a tough company to supply. It gives its suppliers very low margins and this is the first time
there has been such a disruption. This makes it difficult to predict how much impact it will have.
Qualcomm
TD is the root of Qualcomm technology. 4G will be 70 to 80% TD. 4G is based on 2G. The 4G reliance on
Qualcomm is minimal. In 4G, Samsung say they have a stronger patent and Mediatek threatens Qualcomm.
4G China has specific standards, which favour Mediatek. The PC is dead and TSMC is the best way to play
tablets.
Stock worth looking at is TCL – low end TV. 1070 HK. 800 mn market capitalisation. Also San Disk, flash
memory.
PRC utilities BAML
There has been huge expansion of solar and wind. Coal prices are expected to decline for the next few years.
Slightly rising gas prices. For years, IPPs have earned high returns and traded above book. 902 HK. Datang
trades below book. China Everbright should also be looked at. China’s Shenua is always optimistic on coal
prices. Gas prices will increase. There will be huge imports of gas, 200bn m³ by 2020. Petrochina and
Sinopec are huge beneficiaries. It is also good for Gazprom. Buy out of ENN energy?
Consumer discretionary – BAML a good slides
The consensus is that EPS will increase by 20%. Comparisons are easy so 10% is given but a further 10%
requires positive macro. The third quarter was poor with the October Golden Week slow and there has been
little recovery since. Consumption has been held back by 1. Macro 2. Hyperinflation of the last few
years – very expensive. 20 to 30% same store sales growth has been driven by average selling price
increases. Historically this has been 5 to 10% and was 10% in 2011. So we have had the combination of high
price points and a lack of fiscal stimulus. The sector has rebounded strongly. (slides are out of date). Online
shopping is competition. Malls are getting bigger and moving to the suburbs. The whole sector will become
oversupplied over the next few years and there will be a structural derating. Brand risk is high and there
is a lack of loyalty and a weak distribution. Belle is unique with In Time a good commercial property play.
Page 17 of 21
Metals and mining
There is a strong correlation between fixed asset investment and coal consumption. Demand drives supply.
Over the last year, the government decided to replace contract with spot. Iron ore has moved to quarterly
pricing. Imports are the largest threat, thermal coal from Indonesia and metallurgical coal from Mongolia.
The average local production cost for coal is 330 whereas, in Inner Mongolia, it is 120 + 120 registration
fees. It is $570 to $620 at local ports. Demand growth of 2% is crucial. If this disappoints, then the price will
decline. Power consumption has been less than GDP. There has been overcapacity in the coal industry.
Roughly 30% of production is to be shut down across China for at least two weeks.
Meetings in Hong Kong with Goldman Sachs
Richard Manley, Goldman Sachs
Water
In China, they are currently not paying for water. China has to decide between rice and heating. This
applies to the mining, power and food industries. As they have urbanised, there has been no investment in
sewage. 51% of rivers are polluted. Generally water is far too cheap, at $0.20-$0.30 per thousand litres
whereas in the OECD it is $2-$4 50.
The Chinese construction industry is labour constrained with the average age 45. Little insulation is put
into buildings. The 1990s was the decade of manualisation. Labour instead of capital. Since then, labour
and government have taken a smaller share. The years from 2000 to 2010 were good years. See slides on
page 16, 17, 5, 22, 20.
In 2008 to 2009, costs increased and there was margin compression. We now have the combination of cost
inflation and slower topline with asset turns slowing as balance sheet growth slows. Working capital
has exploded in China and there are commodity cost pressures.
Tata Motors – BMW the average price is $48,000 whereas for a Land Rover it is $68,000.
The Chinese stockmarket has underperformed for three years. The cost of beer is at a 62% discount in
China to the OECD, with the cost of water the key differentiator. There has been CROCI contraction in
China since 2009, falling by at worst 30% to at best 9%. The free float of Chinese companies is $600
billion, two thirds of which are SOEs. A third are private and half of the private are Internet.
Companies generally have a funny non-ownership structure. Tencent (57%ile) is better structured.
Presentation by Tim Moe, GS Asia-Pacific strategist
Taiwan is on 13x, Korea and China on 9x.
Korea and Taiwan
There is a presidential election this December. The policies are not hugely different. It remains reasonably
pro-business. Samsung is 10% of GDP and there are ESG concerns. Tim is not particularly concerned about
anti-chaebol legislation. The market is cyclical and in a good expansion phase, cheap relative to the region
and in absolute terms. As a result of its near death experience with too much debt in the late 80s, early 90s,
macro credit is now pretty good.
Page 18 of 21
Taiwan has had no earnings increase for 15 years, whereas Korean earnings have gone up five times since
1998. Korea offers a stable ROE with no compression of margins. Taiwan has no pricing power except for
TSMC. Generally Korea has invested productively.
Korea has 50 million people, Taiwan 20 million people, with similar GDP per capita. Taiwan’s
technological advantage relative to China has eroded.
Indonesia - the banks have 3 to 4% return on assets with strong businesses. Local banks have already made
investment. They have a structurally high level of profitability with 30% ROEs. They have underperformed
this year as there is concern about interest rate declines. The central bank is addressing the current account
problem. The country has strong reserves. Industry is dominated by retail rather than capital intensive
industries.
India
India faces cyclical challenges with 8% plus inflation. Growth has been disappointing and industrial
production was weak yesterday. The finance minister has been replaced with someone who has more sensible
policies.
MK Tang of GS
Hong Kong property prices are very high, the highest in the world. Property tax is 15%. Chinese GDP
forecasts have been revised down. Hong Kong is very dependent on exports, which are 200% of GDP.
Leverage in the economy is too high with private sector debt 100% of GDP and the government debt
40%.
Shadow banking
Depositors asked for investment opportunities. Total bank loans are 100% of GDP with 50% trust loans and
corporate bonds. Banks are not responsible for trusts.
Fixed asset investment
Capital stock in China is still low. Fixed asset investment can continue to grow and the level of 50% of
GDP is sustainable. Goldman Sachs has written a paper on historical investment as a percent of GDP
by Mike Buchanan. MKT will send this to me.
The increase of consumption within GDP hasn’t happened yet because of the global financial crisis. A
theme going forward is the low end consumer which you can play through a company such as Daphne.
Amar Gill
The new entrants to the labour force aged 16 to 24 are starting to decline. Household income has grown
much slower than GDP for the last 20 years. Going forward, it will grow faster. Wage inflation has
been in the mid-teens, 10% real. The middle class is made up of people earning more than $3,000 per
annum. It is 30% of the population. Generally there are three people per household so this is equivalent to
$10,000 per person. There will be a surge in growth as household income grows.
Household income is a small percentage of GDP with corporate profits large. The median income is 30%
lower than the mean income because of income inequality and is $2,500 now. The middle class is
Page 19 of 21
growing at 11% CAGR. ROIC is greater than WACC so there is EVA. From 2010 to 2015, there will be a
25% increase in the 65+ age group in China, Taiwan, Korea and India. A natural way to play this would
be life insurance but this has been sold assuming too high interest rates.
Corporate governance has improved and this is driving better performance. We should focus on
companies where the controlling shareholder has its primary financial interest.
In China, local officials are corrupt but at least at the Beijing level they are okay. The problem is that now
questions are being raised, even at that level. There are some questions about the support for the Communist
party. Demographics are reducing the pressure on unemployment but people remain reluctant to lay people
off.
Andy Driscoll commodities
Iron ore is showing some improvement. Demand has historically been a multiple of 1.2 to 1.3 times GDP
growth but is now 0 .6 times and GDP growth has slowed from 10% to 7%. Industry in the meantime
remains geared up to higher growth. The big 4 spent $200 billion on new supply. This means there is no
longer a need for high cost Chinese supply. Capacity may be overstated. RTZ and BHP’s cash cost is $35-
$40 FOB. China consumes 730 millions tons of steel, for which you need 1bn ton of iron ore and this is half
of global demand. Seaborne is 10% plus. Supply is growing by 100million tones, which is a 6% CAGR
overall. Earnings are declining because of the price. Iron ore is different as higher cost Chinese supply is
being displaced. There will be weather related supply disruptions in the first quarter. The price has gone
from $87 to $122 and has upside to $130-135. China Shenhua’s price of 635 in China is equivalent to $90 per
tonne. Newcastle (Australia) trades at $80, incentivising Aussies to export.
Coal - coal prices will rise slightly as China Shenhua predicts. This means flat earnings for the next three
years.
Copper - the market is tight with 2 to 3% CAGR of supply.
He recommends China Resources Power, which is an IPP and a SOE.
Contradictions in China
Communism Capitalism
ageing population and government young management
luxury bargain
free market tariffs
iPhone free software
risk averse aggressive investment
infrastructure overbuild Beijing traffic jams
Soundbites from two days seeing telecommunications and technology companies in Beijing
China Unicom
Historically, in other countries, when 3G mobile penetration reaches 10%, there has been a significant
acceleration in demand. This hasn’t happened in China where the penetration is now 18% for smart phones.
Page 20 of 21
The market focuses more on voice and this is more important within the family. Behaviour in China is
different, you send an email and confirm by voice. Most of the use is message and voice. Data usage would
pressure the infrastructure. 3G technology is capacity constrained whereas 4G LTE will be better designed
and support data. Technology cycles are very short, leading to high capital expenditure. In Korea, 50% of the
country is 4G. 4G will increase capital spending.
When you make phone calls on 4G, you use the 2G network.
Smart phone
The fastest area of growth is low priced smart phones and China Unicom focused in 2011 on phones for
RMB 1,000. Domestic vendors are expected to do well in this market. In 2012, China Unicom will focus on
phones for RMB1,500. At present the rate of smartphone penetration in 3G is 50%. There are complaints
that 3G coverage is poor. There are too few base stations
FDLT has been chosen globally, with 12 operators choosing TDLT. Qualcomm uses the same chipsets for
both technologies. The iPhone had a big impact increasing 3G customers.
China Telecom
The market is shifting towards handset as against tariff subsidy. 3G penetration has been constrained by the
lack of number mobility from China Mobile. China Telecom believes that Mediatek has an advantage
relative to Qualcomm in 4G and has caught up since 2009.
Qihoo
This is a small company and does not screen well but its insights into the Chinese software market were
helpful. In China, Chinese customers do not expect to pay for software and, for example, Qihoo provide it
consumer security software for free. Its business model is to make money from the advertising around its
search/browser products.
Thundersoft
This is a company funded by Qualcomm. It is set up to provide smartphones and tablets which use
Qualcomm’s products. The stock is expected to IPO shortly.
Presentation by head of TD industry
There are only 12 TD carriers outside China. 4G licences will be granted in 2013/14. China Mobile could
move directly to 4G. TD handsets have been developed disappointing slowly. China Mobile is constrained by
the profit attitude of the state administration. Qualcomm is overcharging, even at 3%. It pays Apple less than
1%. Its preeminence in the 4G world will be less that it was in the 3G world.
China Market Research
Mobile telecommunications is growing faster than GDP growth and grew at 11% in the first half of 2012. 3G
smartphone growth has slowed to 7% in 2012 against 24% in 2011 and 20% in 2010. This dramatic slowing
is principally because of macro. The average selling price of smartphones has declined to $100. 270 million
3G smartphones were sold in 2012. 50 to 60mn white box smart phones were also sold. There are 1 billion
mobile subscribers and the average period of ownership is three years. Local brands are outgrowing foreign
brands. Samsung has the largest volume share at 16% and value share at 25%. Apple’s shares are 4% and
11%.
Sally Godley Maynard
4/12/12
Page 21 of 21

Weitere ähnliche Inhalte

Was ist angesagt?

China’s Economic Miracle Under A Macro Economic View
China’s Economic Miracle Under A Macro Economic ViewChina’s Economic Miracle Under A Macro Economic View
China’s Economic Miracle Under A Macro Economic Viewhong_nona
 
China Economy Presentation
China Economy PresentationChina Economy Presentation
China Economy Presentationsghardrock
 
Economic growth china
Economic growth chinaEconomic growth china
Economic growth chinaAda Alipaj
 
China Financial Services Industry Report
China Financial Services Industry ReportChina Financial Services Industry Report
China Financial Services Industry ReportEvan Clarence
 
Chinese Economic Slowdown
Chinese Economic SlowdownChinese Economic Slowdown
Chinese Economic SlowdownAnurag Gupta
 
Impact of Chinese slowdown on India and the World
Impact of Chinese slowdown on India and the WorldImpact of Chinese slowdown on India and the World
Impact of Chinese slowdown on India and the WorldPriyanka Banerjee
 
Slowdown in Chinese Economy and its Impact on the World
Slowdown in Chinese Economy and its Impact on the WorldSlowdown in Chinese Economy and its Impact on the World
Slowdown in Chinese Economy and its Impact on the Worldinamdaramaan
 
India and China_An Economy Comparison
India and China_An Economy ComparisonIndia and China_An Economy Comparison
India and China_An Economy ComparisonAnurag Kanoongo
 
China monetary policy (final)
China monetary policy (final)China monetary policy (final)
China monetary policy (final)Alejo Colorado
 
Four phases of economic change 2
Four phases of economic change 2Four phases of economic change 2
Four phases of economic change 2Siddharth Dhote
 
Economic rise of china and its consequences
Economic rise of china and its consequencesEconomic rise of china and its consequences
Economic rise of china and its consequencesAdeniyi David Banjo
 
Economy comparison of China and India
Economy comparison of China and IndiaEconomy comparison of China and India
Economy comparison of China and Indiaonlineworks01
 
Economic development in the contemporary china
Economic development in the contemporary chinaEconomic development in the contemporary china
Economic development in the contemporary chinaRoddy Sunguro
 

Was ist angesagt? (20)

China’s Economic Miracle Under A Macro Economic View
China’s Economic Miracle Under A Macro Economic ViewChina’s Economic Miracle Under A Macro Economic View
China’s Economic Miracle Under A Macro Economic View
 
China Economy Presentation
China Economy PresentationChina Economy Presentation
China Economy Presentation
 
3 nations brief
3 nations brief3 nations brief
3 nations brief
 
Economic growth china
Economic growth chinaEconomic growth china
Economic growth china
 
China Financial Services Industry Report
China Financial Services Industry ReportChina Financial Services Industry Report
China Financial Services Industry Report
 
Chinese Economic Slowdown
Chinese Economic SlowdownChinese Economic Slowdown
Chinese Economic Slowdown
 
Impact of Chinese slowdown on India and the World
Impact of Chinese slowdown on India and the WorldImpact of Chinese slowdown on India and the World
Impact of Chinese slowdown on India and the World
 
Slowdown in Chinese Economy and its Impact on the World
Slowdown in Chinese Economy and its Impact on the WorldSlowdown in Chinese Economy and its Impact on the World
Slowdown in Chinese Economy and its Impact on the World
 
World economy
World economy World economy
World economy
 
China political economy
China political economyChina political economy
China political economy
 
India and China_An Economy Comparison
India and China_An Economy ComparisonIndia and China_An Economy Comparison
India and China_An Economy Comparison
 
China Economy
China EconomyChina Economy
China Economy
 
China monetary policy (final)
China monetary policy (final)China monetary policy (final)
China monetary policy (final)
 
Four phases of economic change 2
Four phases of economic change 2Four phases of economic change 2
Four phases of economic change 2
 
Economic rise of china and its consequences
Economic rise of china and its consequencesEconomic rise of china and its consequences
Economic rise of china and its consequences
 
Economy comparison of China and India
Economy comparison of China and IndiaEconomy comparison of China and India
Economy comparison of China and India
 
Economic development in the contemporary china
Economic development in the contemporary chinaEconomic development in the contemporary china
Economic development in the contemporary china
 
Growth and investment
Growth and investmentGrowth and investment
Growth and investment
 
China's role in global economy
China's role in global economy   China's role in global economy
China's role in global economy
 
India - Growth Options
India - Growth OptionsIndia - Growth Options
India - Growth Options
 

Ähnlich wie china2012

a case presentation on current Chinese economy
a case presentation on current Chinese economya case presentation on current Chinese economy
a case presentation on current Chinese economyArnab Pran Bordoloi
 
India v china
India v chinaIndia v china
India v chinas0mnath
 
The Long Term Investment Outlook for China
The Long Term Investment Outlook for ChinaThe Long Term Investment Outlook for China
The Long Term Investment Outlook for ChinaJohn M Olson, CLTC
 
Macro economic -Chinese economic - Unemployment rate
Macro economic -Chinese economic - Unemployment rateMacro economic -Chinese economic - Unemployment rate
Macro economic -Chinese economic - Unemployment rateThanh Phương Tống Trần
 
PwC Global Economy watch (mars 2014)
PwC Global Economy watch (mars 2014)PwC Global Economy watch (mars 2014)
PwC Global Economy watch (mars 2014)PwC France
 
Globalisation speech
Globalisation speechGlobalisation speech
Globalisation speechJack Bennett
 
Investment in china and chinese economy
Investment in china and chinese economyInvestment in china and chinese economy
Investment in china and chinese economyRaghwendra Singh
 
Growing Through China: A Comprehensive Look at Market Opportunities
Growing Through China: A Comprehensive Look at Market Opportunities Growing Through China: A Comprehensive Look at Market Opportunities
Growing Through China: A Comprehensive Look at Market Opportunities Kegler Brown Hill + Ritter
 
Sino Indian Economic Relations Competition And Partnership[1]
Sino Indian Economic Relations Competition And Partnership[1]Sino Indian Economic Relations Competition And Partnership[1]
Sino Indian Economic Relations Competition And Partnership[1]GAUTAM MURTHY
 
China macroeconomy
China macroeconomyChina macroeconomy
China macroeconomygarimayadav7
 
Swedbank Asia Analysis, No. !2
Swedbank Asia Analysis, No. !2Swedbank Asia Analysis, No. !2
Swedbank Asia Analysis, No. !2Swedbank
 
Indian Economy Smart
Indian Economy SmartIndian Economy Smart
Indian Economy Smartdjkpandian
 
growth story of india and china
growth story of india and china growth story of india and china
growth story of india and china Ritika Gupta
 
Sinoindianeconomicrelationscompetitionandpartnership1 1224309877426672-9
Sinoindianeconomicrelationscompetitionandpartnership1 1224309877426672-9Sinoindianeconomicrelationscompetitionandpartnership1 1224309877426672-9
Sinoindianeconomicrelationscompetitionandpartnership1 1224309877426672-9OSMANIA UNIVERSITY
 
effect of inflation on indian economy ppt
effect of inflation on indian economy ppteffect of inflation on indian economy ppt
effect of inflation on indian economy pptBabasab Patil
 
Economyofchina 140815014720-phpapp01
Economyofchina 140815014720-phpapp01Economyofchina 140815014720-phpapp01
Economyofchina 140815014720-phpapp01Georgiana Crăciun
 

Ähnlich wie china2012 (20)

a case presentation on current Chinese economy
a case presentation on current Chinese economya case presentation on current Chinese economy
a case presentation on current Chinese economy
 
China Property Market
China Property MarketChina Property Market
China Property Market
 
India v china
India v chinaIndia v china
India v china
 
The Long Term Investment Outlook for China
The Long Term Investment Outlook for ChinaThe Long Term Investment Outlook for China
The Long Term Investment Outlook for China
 
Macroeconomic
MacroeconomicMacroeconomic
Macroeconomic
 
Macro economic -Chinese economic - Unemployment rate
Macro economic -Chinese economic - Unemployment rateMacro economic -Chinese economic - Unemployment rate
Macro economic -Chinese economic - Unemployment rate
 
PwC Global Economy watch (mars 2014)
PwC Global Economy watch (mars 2014)PwC Global Economy watch (mars 2014)
PwC Global Economy watch (mars 2014)
 
Globalisation speech
Globalisation speechGlobalisation speech
Globalisation speech
 
Investment in china and chinese economy
Investment in china and chinese economyInvestment in china and chinese economy
Investment in china and chinese economy
 
Growing Through China: A Comprehensive Look at Market Opportunities
Growing Through China: A Comprehensive Look at Market Opportunities Growing Through China: A Comprehensive Look at Market Opportunities
Growing Through China: A Comprehensive Look at Market Opportunities
 
Sino Indian Economic Relations Competition And Partnership[1]
Sino Indian Economic Relations Competition And Partnership[1]Sino Indian Economic Relations Competition And Partnership[1]
Sino Indian Economic Relations Competition And Partnership[1]
 
China macroeconomy
China macroeconomyChina macroeconomy
China macroeconomy
 
Swedbank Asia Analysis, No. !2
Swedbank Asia Analysis, No. !2Swedbank Asia Analysis, No. !2
Swedbank Asia Analysis, No. !2
 
China VS India
China VS IndiaChina VS India
China VS India
 
Indian Economy Smart
Indian Economy SmartIndian Economy Smart
Indian Economy Smart
 
growth story of india and china
growth story of india and china growth story of india and china
growth story of india and china
 
Bric
BricBric
Bric
 
Sinoindianeconomicrelationscompetitionandpartnership1 1224309877426672-9
Sinoindianeconomicrelationscompetitionandpartnership1 1224309877426672-9Sinoindianeconomicrelationscompetitionandpartnership1 1224309877426672-9
Sinoindianeconomicrelationscompetitionandpartnership1 1224309877426672-9
 
effect of inflation on indian economy ppt
effect of inflation on indian economy ppteffect of inflation on indian economy ppt
effect of inflation on indian economy ppt
 
Economyofchina 140815014720-phpapp01
Economyofchina 140815014720-phpapp01Economyofchina 140815014720-phpapp01
Economyofchina 140815014720-phpapp01
 

china2012

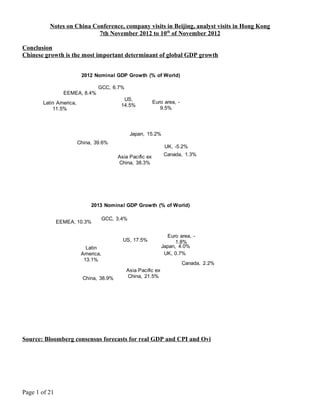
  • 1. Notes on China Conference, company visits in Beijing, analyst visits in Hong Kong 7th November 2012 to 10th of November 2012 Conclusion Chinese growth is the most important determinant of global GDP growth US, 14.5% Euro area, - 9.5% Japan, 15.2% UK, -5.2% Canada, 1.3%Asia Pacific ex China, 38.3% China, 39.6% Latin America, 11.5% EEMEA, 8.4% GCC, 6.7% 2012 Nominal GDP Growth (% of World) US, 17.5% Euro area, - 1.8% Japan, 4.0% UK, 0.7% Canada, 2.2% Asia Pacific ex China, 21.5%China, 38.9% Latin America, 13.1% EEMEA, 10.3% GCC, 3.4% 2013 Nominal GDP Growth (% of World) Source: Bloomberg consensus forecasts for real GDP and CPI and Ovi Page 1 of 21
  • 2. There are 2,200 companies in Asia, against 1,700 companies in the United States, with greater than $1bn in market capitalization. This demonstrates the depth of corporate Asia. There are more IPOs in Asia than in any other part of the world, three out of four IPOs are Asian. Within China, companies are developing from being national to being regional to being global. This is starting to happen through mergers and acquisitions of which 30% are natural resources. The new normal will be that Chinese GDP growth will slow to 6 to 7% because of demographics and the law of large numbers. In 2013 and 2014, GDP growth is expected to be 8.1% and 7.9% against 7.7% in 2012. Evolution of China When I first went to China in 2002, the focus of my conclusions were that we should invest in what China was short of and avoid competing against China where its low labour costs gave it advantage. In 2012, Chinese labour costs have risen substantially so it can no longer rely on GDP growth based on foreign direct investment, infrastructure and a manufacturing industry advantaged by low labour costs. China has a great sense of its history as a dominant economic power and is fiercely focused on re- achieving its preeminence. This is why I believe it will take the necessary actions to adapt its regulation and policies to allow its economy to evolve to the next stage of development. It has always had the huge contrast between a centralised communist government and an underlying, buoyant, entrepreneurial micro culture. The perception is that the last 10 years have been a period of consolidation on the substantial changes achieved in the 90s, in particular to the banking system. The hope, and reasonable expectation, is that the new leadership will introduce "capitalist" reforms, allowing consumption to grow as a percentage of GDP and social welfare systems to develop, something which they have not been successful in achieving in the last couple of years despite the rhetoric. There are clearly huge Page 2 of 21
  • 3. problems to address but China has the advantage of a centralised government not hampered by democracy, which allows it to be more effective, if it can avoid corruption. The challenges that China faces include: 1. To rebalance its economy from investment to consumption 2. Its income inequality 3. The environment. A key problem is income inequality - as it is throughout the world. China needs to improve its investment efficiency and shift from capital intensive to labour intensive investment. Household income is a small percentage of GDP with corporate profits large. The median income is 30% lower than the mean income because of income inequality and is $2,500 now. The middle class is growing at 11% CAGR. China needs to grow its services industries. Corporate profits will be pressured by social contributions. Fiscal policy needs to redistribute by funding education, health and the pension system. This is against the background of its key policy commitment since the noughties of social harmony. Every 1RMB spent on social welfare generates 2RMB of GDP. Asia is driven by export growth and China is the main export hub. Investment has grown at 10 ½% per annum over the last 30 years whereas consumption has grown at 9 ½% per annum. Demographics suggest savings has peaked and will now reduce. Triple turning points 1. labour is tight 2. land is tight and 3. shortage of financing. China provides 25% of global savings. China needs to shift its economic model to grow at 7 to 8% for the next 20 years. The key is allocation of capital. Page 3 of 21
  • 4. China is different Microsoft makes as much money in Holland as it does in China! The culture is that software is free in China and Qihoo provides its consumer security software for free, relying on advertising to monetize it. Contradictions in China Communism Capitalism ageing population and government young management luxury bargain free market tariffs iPhone free software risk averse aggressive investment infrastructure overbuild Beijing traffic jams Profitability Headwinds – margins to decline Competitiveness has been eroded because domestic wages are up 90% in the last four years. Corporate profits are going to be reduced because of social contributions. This will be reflected in fiscal policy which will be geared to redistribution in terms of education health and the pension system. The Chinese stockmarket has underperformed for three years. There has been CROCI contraction in China since 2009, falling by at worst 30% to at best 9%. The free float of Chinese companies is $600 billion, two thirds of which are SOEs. A third are private and half of the private are Internet. Companies generally have a funny non-ownership structure. Page 4 of 21
  • 6. Debt, Banking, Misallocation of Capital The banking system is still mostly available to the SOEs and large companies. A bond market is starting to develop. One of China’s great strength is its entrepreneurial culture, which has allowed small businesses to develop, funded by cashflow only. Within the last four years, debt has doubled, M2 has doubled. There has been a misallocation of capital with the last man standing funded by shadow banking. There needs to be a rebalancing between capital and labour. Real level of non-performing loans at banks is 5 to 10%. Debt levels are much higher than before. The IMF has study studied the Chinese banking system and believes it can withstand big industrial shocks. Non-performing loans in the banking system are somewhere between 1-10%. Poverty 600 million people have been moved out of poverty since 1978. In many rural villages, poverty remains. I travelled with a lady who this year had visited her father in law in a village where there was no water supply, there is now a well but no electricity. China has huge disparity between the rich and the poor and there remain many Chinese living in poverty. Capital, Fixed Asset Investment, Infrastructure Spending, Commodities In 2008, the stimulus was RMB4 trn., 8% of GDP. China’s slowdown results from the ending of the 2008 stimulus, government tightening and the problems in Europe. Page 6 of 21
  • 7. China’s investment/GDP ratio is very high compared to even the highest levels seen during the Asian growth stories in the 20th century. Capital stock in China is still low. Fixed asset investment can continue to grow and the level of 50% of GDP is sustainable. Page 7 of 21
  • 8. China’s resource intensity has increased rapidly over the last few years. However, overall over the last 20 years, it has come down substantially and the recent strong growth was a blip. Energy efficiency is increasing so resource intensity will reduce. Resource productivity is increasing by 3 to 4% per annum and this is likely to increase to 5 to 6%. Chinese steel consumption has moved from infrastructure to machinery. Fixed asset investment in China at 40% of GDP has resulted in 10% GDP growth. 25% fixed asset investment in India has resulted in 6 to 7% GDP growth. Page 8 of 21
  • 9. Iron ore prices are showing some improvement. Steel demand has historically been a multiple of 1.2 to 1.3 times GDP growth but is now 0 .6 times and GDP growth has slowed from 10% to 7%. Industry in the meantime remains geared up to higher growth. The big 4 mining companies spent $200 billion on new supply. $135 barrel per oil price puts the global economy at risk at 7.5% of world GDP. There has been poor capital allocation with 18% illegal employment, just like in the US, in the construction sector. 180 million people are employed in the construction sector. Recently there has been unprecedented volatility e.g. in the iron ore price. Resources in China are limited and gas can only increase from 3% of energy to 8% at best. Coal will remain at 40 to 50% of energy supply. Re shale gas, the infrastructure is not there and will not be there at the earliest for 15 to 20 years. Within 20 years, China will have to import 80% of its oil demand. In China, they are currently not paying for water. China has to decide between rice and heating. This applies to the mining, power and food industries. As they have urbanised, there has been no investment in sewage. 51% of rivers are polluted. Generally water is far too cheap, at $0.20-$0.30 per thousand litres whereas in the OECD it is $2-$4 50. The cost of beer is at a 62% discount in China to the OECD, with the cost of water the key differentiator. The Chinese construction industry is labour constrained with the average age 45. Little insulation is put into buildings. The 1990s was the decade of manualisation. Labour instead of capital. Since then, labour and government have taken a smaller share. In 2008 to 2009, costs increased and there was margin compression. Now we have the combination of cost inflation and slower topline, with asset turns slowing as balance sheet growth slows. Working capital has exploded in China and there are commodity cost pressures. Property Tier 1 cities - prices are still increasing. The government will tighten until April 2013. It is possible there could be a crash in Tier 3 cities as there is a bubble. Tier 3 land is available for 10 years of development. The target for affordable housing is 7 million and this is likely to be met. Land supply is inadequate and there is a shortage of land supply in Tier 1 cities. There is 900mn m² of demand with a land bank of only 28mn m² . Luxury There has been a gradual decrease of tariffs. Historically, there were no luxury brands as these were restricted to the Emperor and forbidden by Mao. Chinese luxury brands are expected to evolve over the next 10 years. The market is expected to evolve: from small pieces to large items such as houses, yachts, cars. From pursuits to demands; from material to culture; from worship of West to love of China. Healthcare The cash flow from Chinese hospitals depends on revenues from drugs. The stated policy is to copy Western drugs. 2800 hospitals account for 80% of the drug demand. Healthcare expenditure is 5.5% of GDP. It depends on the sale of drugs to survive, 52% of revenues. Page 9 of 21
  • 10. Smartphones The iPhone is number six or seven overall in the smart phone market. There are 270 million smart phones overall of which are 110 – 160mn are at the high end. This compares to the US of 100 million. In the US, Apple has a 25 to 30% market share whereas in China it has a 10% market share. China Mobile controls 70% of the 1 billion subscribers. You can buy a phone and use a China Mobile Sim. Samsung has a monopoly position in the high-end with support from the big three. It has a high teens market share. The telephone companies promote Samsung not Apple. Both companies and Qualcomm are beneficiaries of Chinese growth. Consumption Consumption has been held back by 1. Macro 2. Hyperinflation of the last few years – very expensive. 20 to 30% same store sales growth has been driven by average selling price increases. The whole sector will become oversupplied over the next few years and there will be a structural derating. The increase of consumption within GDP hasn’t happened yet because of the global financial crisis. A theme going forward is the low end consumer which you can play through a company such as Daphne. The new entrants to the labour force aged 16 to 24 are starting to decline. Household income has grown much slower than GDP for the last 20 years. Going forward, it will grow faster. Wage inflation has been in the mid-teens, 10% real. The middle class is made up of people earning more than $3,000 per annum. It is 30% of the population. Generally there are three people per household so this is equivalent to $10,000 per person. There will be a surge in consumption growth as household income grows. From 2010 to 2015, there will be a 25% increase in the 65+ age group in China, Taiwan, Korea and India. A natural way to play this would be life insurance but this has been sold assuming too high interest rates. Sally Godley Maynard 4/12/12 Page 10 of 21
  • 11. General Notes Introduction to conference The Chinese market trades on 8x forward earnings, a 27% discount to other markets. The S&P trades on 12x forward earnings. There are 2,200 companies in Asia, against 1,700 companies in the United States, with greater than $1 billion in market capitalization. This demonstrates the depth of corporate Asia. There are more IPOs in Asia than in any other part of the world, three out of four IPOs are Asian. Within China, companies are developing from being national to being regional to being global. This is starting to happen through mergers and acquisitions of which 30% are natural resources. The renminbi bond market is $100 billion now. The high yield market will develop and this will facilitate private equity. This will be followed by modern capital structures like LBOs. Private Equity is $400 billion of assets under management, 2x the level 5 years ago. Money is flooding in and there are more and more deals. US economy Mr. Li Yong, Vice-Minister of the Ministry of Finance of China The US economy is recovering with the stabilisation of the banking industry. 2012 started stronger, caused by the mild winter. As a result, the spring was weak. The trend level of economic growth is now 2%. Drags on growth are capital spending, which is weak, as well as poor employment gains, although these are better than expected. The fiscal cliff will not be addressed until after the election. It requires at least fiscal tightening of $160 billion per annum. This can be arrived at by the payroll tax which will generate $120 billion. Extended unemployment benefits account for $40 billion and across-the-board spending cuts would generate $110 billion. The Bush tax cuts are worth $160 billion. The Simpson Bowles plan requires shared sacrifice and gradual austerity. This is unlikely and the most likely outcome is three stage austerity, with payroll cults and perhaps allowing the unemployment benefits to expire. Modest discretionary spending cuts of $40 to $80 billion may be possible in February as well as small income tax increases in April. Chinese Macro Mr. Jin Liqun, Chairman of the Board of Supervisors, China Investment Corporation The biggest drag on the Chinese economy has been the weakness of exports and of investment in property. Export growth has stabilised. Home sales have improved as the Chinese government changes its policy. Growth is expected to be 8.3% in the first half of 2013. The new normal will be that GDP will slow to 6% growth because of demographics and the law of large numbers. In 2014, GDP growth is expected to be 7.7%. The biggest risk in China is political accountability and the rise of the middle class. Page 11 of 21
  • 12. Competitiveness has been eroded because domestic wages are up 90% in the last four years. Another big risk is the strong upward momentum in property prices. In September/October 2011, there was a sudden big drop in property transactions. This can happen any time. Within the last four years, debt has doubled, M2 has doubled. There has been a misallocation of capital with the last man standing funded by shadow banking. There needs to be a rebalancing between capital and labour. 50% of demand has come from investment and investment is 47% of GDP. This ratio is overestimated as investment is overestimated and GDP is underestimated and is more like 36 to 40%. The middle stage of development is infrastructure building. The potential growth rate is now 8%. The most likely policy changes are the abolition of the one child policy and of the agricultural tax. Presentation by Merrill Lynch’s economist and strategist for China. They disagree with each other! Mr Ting believes that there are 500 billion of bad debts in the banking system. This has doubled to 1trn, which is 1.5% of existing loans. The debt at local government level is only up marginally increasing from 47 to 49%. The Chinese government system has the capacity to absorb this. Commercial debt is 5 trillion with local government debt 10 trillion. Mr Cui believes that the real level of non-performing loans is 5 to 10%, most likely 10%! He believes that at the end of 2007 this was 3 ½%. Local government debt has increased from 1trn to 10trn. Debt levels are much higher than before. Fiscal revenues are under tremendous pressure. Commercial banking is under pressure. Wealth management products in banking have the same characteristics as CDOs. The market doesn’t care if they are paid back and sells as much as possible to get the highest yield. Chinese banks trade on a 16% ROE and 1x book value with a 4 to 5% yield. Ting is positive whereas Cui thinks it’s a value trap. Dr. Justin Yifu Lin, Professor in Peking University, Former Chief Economist and Senior VP, World Bank Historically, China has benefited from long term growth and reforms. From 1979 to 1990, GDP was 9% per annum. From 1990 to 2011, GDP growth was 10.4% per annum. In 1979, China had less than one third of the income per capita of sub-Saharan Africa. Since then, 600 million people have been moved out of poverty. It was only 25 years ago, that there was the second privately owned car. Today the income per capita is $5,400 in 2011. In 2008, the stimulus was RMB4 trn. China’s slowdown results from the ending of the 2008 stimulus, government tightening and the problems in Europe. On the bus, I met a Malaysian lady with a Chinese father-in-law, whom she had recently visited. He lived in a rural village in South China. Until recently, there was no water supply. There is now a well but there is no electricity. All the food is grown from the land. China has huge disparity between the rich and the poor and there remain many rural Chinese living in poverty. At the 18th party congress, GDP growth was forecast to be 8% per annum for the next five years. Total accumulated government debt is 40% of GDP. In 2008, China had 21% of the US per capita income. From 1951 to 1971, Korea and Japan grew at 9.2% per annum. From 1977 to 1997, GDP has grown at 7.6% per annum in Korea. This shows that high growth rates can be sustainable as an economy industrialises. 8% per annum GDP growth for the next 20 years is achievable. Investment as a percent of GDP increased to 66% in Japan in 1971 and 50% in Korea in 1997. Page 12 of 21
  • 13. The challenges that China faces are: 4. To rebalance its economy from investment to consumption 5. Its income inequality 6. The environment. Household savings is 20% of GDP with corporate and government the balance. There is too much concentration of income towards rich people and corporations. The G7 currently accounts for 58% of GDP. From 2000 to 2009, China accounted for 25% of GDP growth, the US 22% and India 6%. China is still in a high carbon stage. Currently, China employs 85 million people in labour intensive sectors. This will be transferred to lower income countries. GDP is $8 trillion, half the size of the USA, with 1.3 billion people. Japan had half the US population in the 1970s, so is a valid precursor. Resource constraint is not a problem according to Lin. A virtuous circle is created by Chinese growth, which is not resource constrained. It is like the capital goods cycle in Germany. It requires the optimal allocation of resources. Mr. II Houng Lee, Senior Resident Representative, China, International Monetary Fund– middle income trap Asia is driven by export growth and China is the main export hub. Investment has grown at 10 ½% per annum over the last 30 years whereas consumption has grown at 9 ½% per annum. Korea and Taiwan are the only countries that have broken away, helped by export growth and investment. How dependent is consumption on investment? China’s current investment of some 40% of GDP is much higher than for developed countries. The scope for further investment in non-eastern provinces is limited. The overinvestment is not sustainable with financing a major constraint. In the case of the Asian tigers, this led to the 1998 crisis. China is different but still the strain is likely. Local government financing is reducing. Agricultural land has been reduced for food production. Demographics suggest savings has peaked and will now reduce. Triple turning points 1. Labour is tight 2. land is tight and 3. shortage of financing. China provides 25% of global savings. In the short run, there is plenty of policy flexibility. China needs to shift its economic model to grow at 7 to 8% for the next 20 years. The key is allocation of capital. China is protected by its high savings even compared to Asian countries. The IMF has study studied the Chinese banking system and believes it can withstand big industrial shocks. Non-performing loans in the banking system are somewhere between 1-10%. The key problem is income inequality. China needs to improve its investment efficiency and shift from capital intensive to labour intensive investment. It needs to grow its agricultural and services industries. Corporate profits will be pressured by social contributions. Fiscal policy will redistribute by funding education, health and the pension system. Corporate profits are going to be reduced because of social contributions. This will be reflected in fiscal policy which will be geared to redistribution in terms of education health and the pension system. Chinese banks and shadow banking Page 13 of 21
  • 14. This session was completely packed out. There has been a significant rise in non-performing loans from the low level of 1% to 2% to 3 to 4% in 2013. The outlook is stable with a healthy net interest margins. The banks have good loan loss reserves buffers. Equity to loan book is 10% and liquidity is strong. The loan to deposit ratio is 70% for the whole banking industry, which is low in an international context. Overall in a global context, the Chinese banks ranked 5/10. Non-performing loans can be absorbed through operating profit. The outlook depends on economic growth. There are 1,700 billion of assets in the shadow banking industry of which 50 billion are invested in infrastructure, 60 billion in stocks. The real estate investment has reduced to 30bn and is a small part. Mining is 20 billion of which coalminers predominate. The trust market size will exceed that of insurance by the end of this year. Property Tier 1 cities - prices are still increasing. The government will tighten until April 2013. It is possible there could be a crash in Tier 3 cities as there is a bubble. Tier 3 land is available for 10 years of development. The target for affordable housing is 7 million and this is likely to be met. Land supply is inadequate and there is a shortage of land supply in Tier 1 cities. There is 900mn m² of demand with a land bank of only 28mn m² . Tightening monetary policy will restrict property prices. Mixed-use property will increase. Urbanisation will increase Tier 2 cities. The premium market is 10% of the market. Demand will exceed supply for the next 10 years. At that point, urbanisation will reach 70% and demographics will plateau or weaken market. There is a commercial property bubble e.g. in Chengdu. Luxury In developed markets, the key group is aged 45, whereas in China it is aged between 25 and 50. This is now narrowed so that the fastest growing group is 25 to 30. 1. the target market is younger in China, it used to be dominated by men, it is now increasingly female 2. there are no domestic brands 3. early phase. It is generally personal accessories but is expected to evolve into lifestyle/appearance experience goods. There are 175 million consumers in China. 4. Purchases are generally made in large shopping mauls or when travelling. There has been a gradual decrease of tariffs. Historically, there were no luxury brands as these were restricted to the Emperor and forbidden by Mao. Chinese luxury brands are expected to evolve over the next 10 years. The market is expected to evolve: from small pieces to large items such as houses, yachts, cars. From pursuits to demands; from material to culture; from worship of West to love of China. Presentation by World Bank, Ms. Chorching Goh, Lead Economist, World Bank China China will find a current account deficit difficult to cope with because of its poor financial regulations. It is dependent on foreign technology deployment. It needs to move up the value chain. The World Bank 2030 report focuses on urbanisation and that China’s cities are not large enough. China has done well on the back of manufacturing and exports, with a low share of consumption. It has grown at 9% real for the last 15 years, which is very strong versus Korea and Japan. Household and labour income as a percent of GDP are low. China’s middle class at 12% is very small compared to Korea, Japan, Brazil at similar development points. It needs to evolve into a knowledge based economy. There is high expenditure on research and Page 14 of 21
  • 15. development at 2% of GDP. The mobility of China and the Chinese workforce needs to be improved. There are too many taxes on labour. The access to credit is very difficult for small enterprises. Land, labour and capital are all problems. The urbanisation rate of 1% per annum is not fast enough. Daimler China has low car density and low urbanisation. Two thirds of Daimler’s volumes come from the East Coast. There are 41 cars per 1,000 people against 417 to 522 in developed countries. Brazil has 137. e-commerce The gross market value was $135 billion in 2011. Growth is expected to be double digits in 2012. It is close to the level in developed markets at 3.1% of nominal GDP against 1.5% in the United States. It is 10% of retail sales. McKinseys Dr. Jonathan Woetzel China’s resource intensity has increased rapidly over the last few years. However, overall over the last 20 years, it has come down substantially and the recent strong growth was a blip. The service sector is growing. Energy efficiency is increasing so resource intensity will reduce. A 3 to 4% decline in resource intensity is very achievable. Resource productivity is increasing by 3 to 4% per annum and this is likely to increase to 5 to 6%. Energy demand is predominantly industrial. As standards of living increase, resource consumption will increase. Steel intensity is much higher in China than in Brazil. Chinese steel consumption has moved from infrastructure to machinery. Korean and Japanese infrastructure build has been high, it is a competitive advantage. In China, the urbanisation process is happening at an earlier stage of development. The build out of living space, at 33 m² is equivalent to Singapore. There has been a real estate overbuild. Fixed asset investment at 40% of GDP implies 10% GDP growth. 25% fixed asset investment in India implies 6 to 7% GDP growth. There has been poor capital allocation with 18% illegal employment, just like in the US, in the construction sector. 180 million people are employed in the construction sector. Recently there has been unprecedented volatility e.g. in the iron ore price. Resources in China are limited and gas can only increase from 3% of energy to 8% at best. Coal will remain at 40 to 50%. Re shale gas, the infrastructure is not there and will not be there at the earliest for 15 to 20 years. Within 20 years, China will have to import 80% of its oil demand. Reform is needed of the shadow banking system and the financial system generally. The question is whether a shock is needed to force reform. The population is 53% male, 47% female and this is going to go to 55/45. China is threatened if it does not reform and is inclined to say one thing and allow something else to happen in practice. McKinsey’s does not believe the transition has caused any slowdown. What is needed is more reform, in particular financial. Rural migration has disenfranchised 10% of the population. By 2030, migrants will be 40%. This is a barrier to productivity. It would cost 2% of GDP to give benefits to migrants. GDP growth of 9 to 11% has been too high and created too much fixed capital. It will be good for the economy to slow to 7% as the focus needs to be productivity and transparency. Page 15 of 21
  • 16. It is good for growth to slow to 7% and will encourage productivity. In Brazil, when urbanisation went up from 55 to 70%, there was inflation and capital left the country so this is a risk to take into account. Capital needs to be put to work in the service sector. Commodities and Oil – Francisco Blanch Head of Commodities BAML The price of oil has moved alongside the expansion of the Federal Reserve balance sheet. Otherwise, commodities have been weak and only commodities which are rare are holding up well and following the Fed balance sheet. Iron ore has had strong production growth. This has not been the case for oil or natural gas, where production growth has been slower than GDP. It is a concentrated market so it can be controlled. Commodities have been closely linked to the global financial crisis. The current account problems are at the root of the European problems and oil is at its heart. The countries in recession in 2012 are oil short countries. There is a $900 million energy carry to the United States. Energy costs are falling. Natural gas is three dollars in the US, $12 in Europe and $18 in Japan. This is a huge advantage to the US. The US is focusing on energy utilisation, using its low interest rates to address. $135 barrel per oil price puts the global economy at risk at 7.5% of world GDP. US oil production is exploding, fixing the US economy. Chinese oil production is flat. Chinese steel consumption is half a kilogram per person, which is the same as the US in the 1960s. China has four times the GDP per capita of India. Corn prices tend to be tied to energy prices. They need to be pushed out of the energy pool into the food pool. Mobility In the US, it is 13 times, the UK 7 times, Russia 2 times during working life. Healthcare reform - Mr. WANG Bo, VP of China Pharmaceutical Enterprise Association Chinese healthcare system is unique with complicated sales, marketing, distribution systems, like Germany and the US were 20 years ago. The cash flow from Chinese hospitals depends on revenues from drugs. The system is growing at 21%, 2 ½ times the GDP growth rate. Demand is likely to grow at 20% per annum. There are 4,800 pharmaceutical manufacturers and 230,000 healthcare providers. 80% of drugs are sold through hospitals with kickbacks and there are 13,000 wholesale distributors! This is difficult to regulate (there are three in the United States, which controls 97% of the market). The stated policy is to copy Western drugs. 2800 hospitals account for 80% of the drug demand. Healthcare expenditure is 5.5% of GDP. It is RMB2 trillion, 30% of expenditure, with 24% of the global population. Education is 34% of expenditure. Healthcare overall has had 14 to 18% growth in expenditure. It depends on the sale of drugs to survive, 52% of revenues. Quality is inconsistent in China. Nigel Tupper BAML – Head of Asia Pacific Equity Strategy & Chief Global Quantitative Strategist Infrastructure is $3,000 per capita in China against $30,000 per capita in the US. His wave ticked up to 0.66 with QE but is now 0.55. Asian central banks have cut by 1% and put in place fiscal stimulus – India, Korea, Malaysia, Singapore, Taiwan and Thailand. Asia-Pacific central bank policy is coincident with the global wave. Asia outperforms when the global wave outperforms. Tupper is underweight Asia-Pacific now. Page 16 of 21
  • 17. Valuation is not a catalyst and quality is expensive. Asia is dependent on Western demand and is deleveraging. 45% of GDP is exported for the whole of Asia including China. Asean is Indonesia, Philippines, Singapore, Thailand and Malaysia. Indonesia has very strong demographics. High ROE is the best performer, low margin, high asset turn multiplied by high leverage. Technology Simon Woo BAML analyst Rising asset turn is positive. China Mobile has 700 million subscribers, half of which are smart phones. They don’t want to promote the high end. 2 and 2 ½ G is 80% with 3G only 20% and pure 3G only 10%. CM don’t sell Apple. China Unicom is the main promoter and you can get an Apple phone separately. China Mobile promotes Samsung. The iPhone is number six or seven overall in the smart phone market. There are 270 million smart phones overall of which are 110 – 160mn are at the high end. This compares to the US of 100 million. In the US, Apple has a 25 to 30% market share whereas in China it has a 10% market share. China Mobile controls 70% of the 1 billion subscribers. You can buy a phone and use a China Mobile Sim. Samsung has a monopoly position in the high-end with support from the big three. It has a high teens market share. The telephone companies promote Samsung not Apple. Apple supplies through stores. There is a problem with the supply of the iPhone five. The Apple ecosystem is very Apple specific and it is a tough company to supply. It gives its suppliers very low margins and this is the first time there has been such a disruption. This makes it difficult to predict how much impact it will have. Qualcomm TD is the root of Qualcomm technology. 4G will be 70 to 80% TD. 4G is based on 2G. The 4G reliance on Qualcomm is minimal. In 4G, Samsung say they have a stronger patent and Mediatek threatens Qualcomm. 4G China has specific standards, which favour Mediatek. The PC is dead and TSMC is the best way to play tablets. Stock worth looking at is TCL – low end TV. 1070 HK. 800 mn market capitalisation. Also San Disk, flash memory. PRC utilities BAML There has been huge expansion of solar and wind. Coal prices are expected to decline for the next few years. Slightly rising gas prices. For years, IPPs have earned high returns and traded above book. 902 HK. Datang trades below book. China Everbright should also be looked at. China’s Shenua is always optimistic on coal prices. Gas prices will increase. There will be huge imports of gas, 200bn m³ by 2020. Petrochina and Sinopec are huge beneficiaries. It is also good for Gazprom. Buy out of ENN energy? Consumer discretionary – BAML a good slides The consensus is that EPS will increase by 20%. Comparisons are easy so 10% is given but a further 10% requires positive macro. The third quarter was poor with the October Golden Week slow and there has been little recovery since. Consumption has been held back by 1. Macro 2. Hyperinflation of the last few years – very expensive. 20 to 30% same store sales growth has been driven by average selling price increases. Historically this has been 5 to 10% and was 10% in 2011. So we have had the combination of high price points and a lack of fiscal stimulus. The sector has rebounded strongly. (slides are out of date). Online shopping is competition. Malls are getting bigger and moving to the suburbs. The whole sector will become oversupplied over the next few years and there will be a structural derating. Brand risk is high and there is a lack of loyalty and a weak distribution. Belle is unique with In Time a good commercial property play. Page 17 of 21
  • 18. Metals and mining There is a strong correlation between fixed asset investment and coal consumption. Demand drives supply. Over the last year, the government decided to replace contract with spot. Iron ore has moved to quarterly pricing. Imports are the largest threat, thermal coal from Indonesia and metallurgical coal from Mongolia. The average local production cost for coal is 330 whereas, in Inner Mongolia, it is 120 + 120 registration fees. It is $570 to $620 at local ports. Demand growth of 2% is crucial. If this disappoints, then the price will decline. Power consumption has been less than GDP. There has been overcapacity in the coal industry. Roughly 30% of production is to be shut down across China for at least two weeks. Meetings in Hong Kong with Goldman Sachs Richard Manley, Goldman Sachs Water In China, they are currently not paying for water. China has to decide between rice and heating. This applies to the mining, power and food industries. As they have urbanised, there has been no investment in sewage. 51% of rivers are polluted. Generally water is far too cheap, at $0.20-$0.30 per thousand litres whereas in the OECD it is $2-$4 50. The Chinese construction industry is labour constrained with the average age 45. Little insulation is put into buildings. The 1990s was the decade of manualisation. Labour instead of capital. Since then, labour and government have taken a smaller share. The years from 2000 to 2010 were good years. See slides on page 16, 17, 5, 22, 20. In 2008 to 2009, costs increased and there was margin compression. We now have the combination of cost inflation and slower topline with asset turns slowing as balance sheet growth slows. Working capital has exploded in China and there are commodity cost pressures. Tata Motors – BMW the average price is $48,000 whereas for a Land Rover it is $68,000. The Chinese stockmarket has underperformed for three years. The cost of beer is at a 62% discount in China to the OECD, with the cost of water the key differentiator. There has been CROCI contraction in China since 2009, falling by at worst 30% to at best 9%. The free float of Chinese companies is $600 billion, two thirds of which are SOEs. A third are private and half of the private are Internet. Companies generally have a funny non-ownership structure. Tencent (57%ile) is better structured. Presentation by Tim Moe, GS Asia-Pacific strategist Taiwan is on 13x, Korea and China on 9x. Korea and Taiwan There is a presidential election this December. The policies are not hugely different. It remains reasonably pro-business. Samsung is 10% of GDP and there are ESG concerns. Tim is not particularly concerned about anti-chaebol legislation. The market is cyclical and in a good expansion phase, cheap relative to the region and in absolute terms. As a result of its near death experience with too much debt in the late 80s, early 90s, macro credit is now pretty good. Page 18 of 21
  • 19. Taiwan has had no earnings increase for 15 years, whereas Korean earnings have gone up five times since 1998. Korea offers a stable ROE with no compression of margins. Taiwan has no pricing power except for TSMC. Generally Korea has invested productively. Korea has 50 million people, Taiwan 20 million people, with similar GDP per capita. Taiwan’s technological advantage relative to China has eroded. Indonesia - the banks have 3 to 4% return on assets with strong businesses. Local banks have already made investment. They have a structurally high level of profitability with 30% ROEs. They have underperformed this year as there is concern about interest rate declines. The central bank is addressing the current account problem. The country has strong reserves. Industry is dominated by retail rather than capital intensive industries. India India faces cyclical challenges with 8% plus inflation. Growth has been disappointing and industrial production was weak yesterday. The finance minister has been replaced with someone who has more sensible policies. MK Tang of GS Hong Kong property prices are very high, the highest in the world. Property tax is 15%. Chinese GDP forecasts have been revised down. Hong Kong is very dependent on exports, which are 200% of GDP. Leverage in the economy is too high with private sector debt 100% of GDP and the government debt 40%. Shadow banking Depositors asked for investment opportunities. Total bank loans are 100% of GDP with 50% trust loans and corporate bonds. Banks are not responsible for trusts. Fixed asset investment Capital stock in China is still low. Fixed asset investment can continue to grow and the level of 50% of GDP is sustainable. Goldman Sachs has written a paper on historical investment as a percent of GDP by Mike Buchanan. MKT will send this to me. The increase of consumption within GDP hasn’t happened yet because of the global financial crisis. A theme going forward is the low end consumer which you can play through a company such as Daphne. Amar Gill The new entrants to the labour force aged 16 to 24 are starting to decline. Household income has grown much slower than GDP for the last 20 years. Going forward, it will grow faster. Wage inflation has been in the mid-teens, 10% real. The middle class is made up of people earning more than $3,000 per annum. It is 30% of the population. Generally there are three people per household so this is equivalent to $10,000 per person. There will be a surge in growth as household income grows. Household income is a small percentage of GDP with corporate profits large. The median income is 30% lower than the mean income because of income inequality and is $2,500 now. The middle class is Page 19 of 21
  • 20. growing at 11% CAGR. ROIC is greater than WACC so there is EVA. From 2010 to 2015, there will be a 25% increase in the 65+ age group in China, Taiwan, Korea and India. A natural way to play this would be life insurance but this has been sold assuming too high interest rates. Corporate governance has improved and this is driving better performance. We should focus on companies where the controlling shareholder has its primary financial interest. In China, local officials are corrupt but at least at the Beijing level they are okay. The problem is that now questions are being raised, even at that level. There are some questions about the support for the Communist party. Demographics are reducing the pressure on unemployment but people remain reluctant to lay people off. Andy Driscoll commodities Iron ore is showing some improvement. Demand has historically been a multiple of 1.2 to 1.3 times GDP growth but is now 0 .6 times and GDP growth has slowed from 10% to 7%. Industry in the meantime remains geared up to higher growth. The big 4 spent $200 billion on new supply. This means there is no longer a need for high cost Chinese supply. Capacity may be overstated. RTZ and BHP’s cash cost is $35- $40 FOB. China consumes 730 millions tons of steel, for which you need 1bn ton of iron ore and this is half of global demand. Seaborne is 10% plus. Supply is growing by 100million tones, which is a 6% CAGR overall. Earnings are declining because of the price. Iron ore is different as higher cost Chinese supply is being displaced. There will be weather related supply disruptions in the first quarter. The price has gone from $87 to $122 and has upside to $130-135. China Shenhua’s price of 635 in China is equivalent to $90 per tonne. Newcastle (Australia) trades at $80, incentivising Aussies to export. Coal - coal prices will rise slightly as China Shenhua predicts. This means flat earnings for the next three years. Copper - the market is tight with 2 to 3% CAGR of supply. He recommends China Resources Power, which is an IPP and a SOE. Contradictions in China Communism Capitalism ageing population and government young management luxury bargain free market tariffs iPhone free software risk averse aggressive investment infrastructure overbuild Beijing traffic jams Soundbites from two days seeing telecommunications and technology companies in Beijing China Unicom Historically, in other countries, when 3G mobile penetration reaches 10%, there has been a significant acceleration in demand. This hasn’t happened in China where the penetration is now 18% for smart phones. Page 20 of 21
  • 21. The market focuses more on voice and this is more important within the family. Behaviour in China is different, you send an email and confirm by voice. Most of the use is message and voice. Data usage would pressure the infrastructure. 3G technology is capacity constrained whereas 4G LTE will be better designed and support data. Technology cycles are very short, leading to high capital expenditure. In Korea, 50% of the country is 4G. 4G will increase capital spending. When you make phone calls on 4G, you use the 2G network. Smart phone The fastest area of growth is low priced smart phones and China Unicom focused in 2011 on phones for RMB 1,000. Domestic vendors are expected to do well in this market. In 2012, China Unicom will focus on phones for RMB1,500. At present the rate of smartphone penetration in 3G is 50%. There are complaints that 3G coverage is poor. There are too few base stations FDLT has been chosen globally, with 12 operators choosing TDLT. Qualcomm uses the same chipsets for both technologies. The iPhone had a big impact increasing 3G customers. China Telecom The market is shifting towards handset as against tariff subsidy. 3G penetration has been constrained by the lack of number mobility from China Mobile. China Telecom believes that Mediatek has an advantage relative to Qualcomm in 4G and has caught up since 2009. Qihoo This is a small company and does not screen well but its insights into the Chinese software market were helpful. In China, Chinese customers do not expect to pay for software and, for example, Qihoo provide it consumer security software for free. Its business model is to make money from the advertising around its search/browser products. Thundersoft This is a company funded by Qualcomm. It is set up to provide smartphones and tablets which use Qualcomm’s products. The stock is expected to IPO shortly. Presentation by head of TD industry There are only 12 TD carriers outside China. 4G licences will be granted in 2013/14. China Mobile could move directly to 4G. TD handsets have been developed disappointing slowly. China Mobile is constrained by the profit attitude of the state administration. Qualcomm is overcharging, even at 3%. It pays Apple less than 1%. Its preeminence in the 4G world will be less that it was in the 3G world. China Market Research Mobile telecommunications is growing faster than GDP growth and grew at 11% in the first half of 2012. 3G smartphone growth has slowed to 7% in 2012 against 24% in 2011 and 20% in 2010. This dramatic slowing is principally because of macro. The average selling price of smartphones has declined to $100. 270 million 3G smartphones were sold in 2012. 50 to 60mn white box smart phones were also sold. There are 1 billion mobile subscribers and the average period of ownership is three years. Local brands are outgrowing foreign brands. Samsung has the largest volume share at 16% and value share at 25%. Apple’s shares are 4% and 11%. Sally Godley Maynard 4/12/12 Page 21 of 21