SlideShare a Scribd company logo
1 of 6
Download to read offline
ORIGINAL ARTICLE


Ezetimibe improves glucose metabolism by
ameliorating hepatic function in Japanese patients
with type 2 diabetes
Shinji Ichimori1,2†, Seiya Shimoda1†, Rieko Goto1, Yasuto Matsuo3, Takako Maeda1, Noboru Furukawa1, Junji Kawashima1,
Shoko Kodama4, Taiji Sekigami5, Satoshi Isami2, Kenro Nishida6, Eiichi Araki1*


ABSTRACT
Aims/Introduction: Several experimental studies have shown that ezetimibe improves steatosis and insulin resistance in the liver.
This suggests that ezetimibe may improve glucose metabolism, as well as lipid metabolism, by inhibiting hepatic lipid accumulation.
Therefore, we compared HbA1c levels after 3 months ezetimibe treatment with baseline levels in patients with type 2 diabetes and
examined the factors associated with reductions in HbA1c following ezetimibe administration.
Materials and Methods: Lipid profiles, hepatic function, and HbA1c were assessed before and after 3 months treatment with
10 mg/day ezetimibe in 96 patients with type 2 diabetes and hypercholesterolemia. Regression analysis was used to investigate asso-
ciations between metabolite levels and the percentage change in HbA1c.
Results: Low-density lipoprotein–cholesterol was significantly lower after 3 months treatment compared with baseline, and HbA1c
decreased in approximately 50% of patients. Univariate linear regression analyses showed that changes in HbA1c were significantly
associated with serum alanine aminotransferase (ALT), the aspartate aminotransferase (AST)/ALT ratio, and age. Two-tailed chi-square
tests revealed that serum ALT ‡35 IU/L and an AST/ALT ratio <1.0 were significantly associated with decreases in HbA1c following
ezetimibe administration.
Conclusions: The results of the present study indicate that ezetimibe may improve glucose metabolism. Serum ALT levels
and the AST/ALT ratio were useful predictors of a glucose metabolism response to ezetimibe. This trial was registered with UMIN
(no. UMIN000005307). (J Diabetes Invest, doi: 10.1111/j.2040-1124.2011.00147.x, 2011)
KEY WORDS: Ezetimibe, Hepatic insulin sensitivity, Liver steatosis


INTRODUCTION                                                                               tion of cardiovascular events. Some investigators have reported
The 9-year interim report of the Japan Diabetes Complications                              an increase in intestinal cholesterol absorption in individuals
Study, which investigated risk factors for complications in Japa-                          with type 2 diabetes3. Therefore, it is possible that ezetimibe,
nese individuals with type 2 diabetes, revealed that high levels of                        which, as an inhibitor of cholesterol transporters in the small
low-density lipoprotein cholesterol (LDL-C) were the most sig-                             intestine, selectively inhibits cholesterol absorption, may be effec-
nificant risk factor for coronary heart disease1. That study                                tive for lipid control in type 2 diabetes. In terms of the effects of
showed that strict blood glucose control in addition to aggres-                            ezetimibe on steatosis and insulin sensitivity in the liver, recent
sive lipid control was important in the care of Japanese patients                          studies have shown that ezetimibe has the potential to improve
with type 2 diabetes.                                                                      not only lipid metabolism, but also glucose metabolism by
   The recent introduction of ezetimibe into clinical use, together                        inhibiting the accumulation of lipids in the liver4–7. However,
with a growing body of evidence relating cholesterol absorption                            no studies have investigated the clinical effects of ezetimibe on
to the risk of cardiovascular events2, has raised awareness of the                         the relationship between glucose metabolism and liver function
importance of controlling cholesterol absorption for the preven-                           in individuals with type 2 diabetes.
                                                                                              Therefore, in the present study, we compared HbA1c levels
1
 Department of Metabolic Medicine, Faculty of Life Sciences, Kumamoto University,          after 3 months ezetimibe treatment with baseline levels in
2
 Ueki Hospital, 3Saiseikai Kumamoto Hospital, 4National Hospital Organization Kumamoto
Medical Center, 5Yatsushiro Social Insurance General Hospital, and 6Minamata City          patients with type 2 diabetes and examined the factors associ-
Hospital and Medical Center, Kumamoto, Japan                                               ated with reductions in HbA1c following ezetimibe administra-
*Corresponding author. Eiichi Araki Tel.: +81-96-373-5169 Fax: +81-96-366-8397             tion. Consequently, we found that ezetimibe improved HbA1c
E-mail address: earaki@gpo.kumamoto-u.ac.jp
†These authors contributed equally to this work.                                           in patients with type 2 diabetes and liver dysfunction, and that
Received 27 March 2011; revised 6 June 2011; accepted 9 June 2011                          serum alanine aminotransferase (ALT) levels and the aspartate


ª 2011 Asian Association for the Study of Diabetes and Blackwell Publishing Asia Pty Ltd      Journal of Diabetes Investigation Volume •• Issue •• ••• 2011   1
Ichimori et al.


aminotransferase (AST)/ALT ratio at baseline are useful predic-          Statistical Analysis
tors for improvements in HbA1c.                                          Data are expressed as the mean ± SD. Changes in clinical
                                                                         parameters following ezetimibe treatment were evaluated using
MATERIALS AND METHODS                                                    paired t-tests. Differences in baseline clinical parameters between
Subjects and Study Design                                                subjects with and without a decrease in HbA1c were evaluated
The study included 96 individuals with type 2 diabetes and               using unpaired t-tests. Pearson’s product–moment correlation
hypercholesterolemia (57 men and 39 women) who visited our               coefficient analysis was used to determine the statistical signifi-
medical institutions as outpatients. Patients were excluded              cance of the regression line. Values of P < 0.05 were considered
from the study if: they were using a new antidiabetic agent or a         significant. Two-tailed chi-square tests were used to identify fac-
new antihypertensive agent, or had changed doses and/or the              tors associated with the glucose metabolism-improving effects of
types of agents used, between 2 months prior to the study and            ezetimibe and odds ratios (OR) were calculated by cross-tabula-
the end of the study; their current or past alcohol intake was           tion. Data analyses were performed using SPSS software version
>20 g/day; or they had serological evidence of viral hepatitis,          11.5 for Windows (SPSS, Chicago, IL, USA).
hemochromatosis, autoimmune liver disease, or non-alcoholic
steatohepatitis (NASH). The diagnosis of NASH was based on               RESULTS
the following criteria8,9: (i) an intake of <20 g/day ethanol;           The baseline characteristics for all subjects are given in Table 1.
(ii) biopsy-proven steatohepatitis, steatosis, inflammatory infil-         Sixty-two were on oral antidiabetic agents, whereas 12 were
trates, and ballooning degeneration with or without Mallory              receiving insulin therapy. In the present study, 11 subjects were
bodies or pericellular/perivenular fibrosis; and (iii) appropriate        treated with a statin and 32 were treated with a fibrate.
exclusion of other liver diseases. Patients using statins or fibrates        The clinical parameters of the subjects in the monotherapy,
at a dose that did not change in the 3 months prior to the study         statin, and fibrate groups before and after treatment are given in
were eligible for inclusion. The subjects’ lifestyle, including diet,
excise and habits, did not change during the study. All subjects
                                                                         Table 1 | Baseline characteristics of the subjects
were informed of the objectives of the research and provided
consent prior to participating in the study. The study was               n (men/women)                                                                96 (57/39)
approved by the Ethics Committee of Kumamoto University                  Age (years)                                                                  61.5 ± 11.4
(approval no. 413).                                                      BMI (kg/m2)                                                                  25.5 ± 4.2
   Following screening, subjects were divided into three groups          LDL-C (mg/dL)                                                                164 ± 36
and treated with ezetimibe alone (monotherapy group; n = 53),            HDL-C (mg/dL)                                                                 55 ± 14
                                                                         LDL/HDL ratio                                                                 3.2 ± 1.1
ezetimibe plus a statin (statin group; n = 11), or ezetimibe plus
                                                                         TG (mg/dL)                                                                   198 ± 117
a fibrate (fibrate group; n = 32). Ezetimibe was administered              HbA1c (%)                                                                     6.7 ± 1.0
at a dose of 10 mg/day in all patients. Baseline values of               AST (IU/L)                                                                    25 ± 13
LDL-C, high-density lipoprotein–cholesterol (HDL-C), the                 ALT (IU/L)                                                                    27 ± 19
LDL/HDL ratio, triglycerides (TG), serum AST, serum ALT,                 AST/ALT ratio                                                                 1.1 ± 0.4
serum c-glutamyltransferase (GGT), the AST/ALT ratio, and                GGT (IU/L)                                                                    50 ± 53
HbA1c were compared with values after 3 months treatment.                Antidiabetic therapy (n)
Serum lipids and liver function were determined using enzy-                 Diet only                                                                    28
matic methods; LDL-C was measured directly using a homo-                    Sulfonylurea                                                                 39
geneous assay (Deteriner LDL-C; Kyowa Medex, Tokyo,                         a-Glucosidase inhibitor                                                      19
Japan). HbA1c was measured by high-performance liquid                       Biguanide                                                                    18
                                                                            Thiazolidine                                                                 18
chromatography. In the present study, according to the guide-
                                                                            Glinide                                                                       8
lines of the Japan Diabetes Society (JDS)10, the value for                  Insulin                                                                      12
HbA1c (%) was estimated as an NGSP equivalent value (%)                  Antihyperlipidemic therapy (n)
calculated using the formula HbA1c (%) = HbA1c (JDS)                        Pravastatin                                                                   2
(%) + 0.4%, where HbA1c (NGSP) (%) = 1.019 · HbA1c                          Rosuvastatin                                                                  5
(JDS) (%) + 0.30. The coefficient of variation for measure-                  Atorvastatin                                                                  3
ments of HbA1c was 2–3%10.                                                  Pitavastatin                                                                  1
   To identify predictors of reductions in HbA1c following eze-             Bezafibrate                                                                   31
timibe administration, subjects were divided into groups accord-            Fenofibrate                                                                    1
ing to whether HbA1c decreased during the 3-month study and              Data are the mean ± SD or the number of subjects in each group,
the clinical parameters at baseline were compared between                as indicated. BMI, body massindex; LDL-C, low-density lipoprotein–
groups. Pearson’s correlation coefficient analysis was used to            cholesterol; HDL-C, high-densitylipoprotein–cholesterol; TG, triglycerides;
determine univariate correlations between improvements in                AST, aspartate aminotransferase; ALT, alanine aminotransferase; GGT,
HbA1c and individual baseline characteristics.                           c-glutamyltransferase.


2        Journal of Diabetes Investigation Volume •• Issue •• ••• 2011       ª 2011 Asian Association for the Study of Diabetes and Blackwell Publishing Asia Pty Ltd
Ezetimibe and glucose metabolism


Table 2 | Effects of 3 months ezetimibe therapy on clinical parameters

                                                                     Ezetimibe                                                                Total (n = 96)
                          Ezetimibe monotherapy
                          (n = 53)                                   + Statin (n = 11)                       + Fibrate (n = 32)
                          Baseline             After                 Baseline              After             Baseline        After            Baseline         After
                                               3 months                                    3 months                          3 months                          3 months
Age (years)               61.8 ± 11.7          –                     63.0 ± 12.5           –                 60.6 ± 10.8     –                61.5 ± 11.4      –
BMI (kg/m2)               24.9 ± 4.4           24.8 ± 4.3            26.7 ± 3.3            26.9 ± 3.2        26.1 ± 4.2      26.4 ± 4.3       25.5 ± 4.2       25.5 ± 4.2
LDL-C (mg/dL)             157 ± 38             128 ± 31**            165 ± 43              111 ± 40**        173 ± 27        139 ± 32**       164 ± 36         129 ± 33**
HDL-C (mg/dL)              59 ± 15               57 ± 15               52 ± 11               51 ± 13          50 ± 10          53 ± 11         55 ± 14           55 ± 14
LDL/HDL ratio              2.9 ± 1.0            2.4 ± 0.8**           3.3 ± 1.2             2.3 ± 1.0**       3.6 ± 1.1       2.9 ± 0.9**      3.2 ± 1.1        2.5 ± 0.9**
TG (mg/dL)                148 ± 74             140 ± 68              213 ± 93              143 ± 101*        276 ± 140       172 ± 97**       198 ± 117        152 ± 84**
HbA1c (%)                  6.8 ± 0.8            6.7 ± 0.9             7.2 ± 1.3             7.2 ± 1.4         6.5 ± 1.1       6.4 ± 0.9**      6.7 ± 1.0        6.7 ± 1.0
AST (IU/L)                 23 ± 7.0              24 ± 9                20 ± 5                20 ± 8           31 ± 20          31 ± 15         25 ± 13           26 ± 12
ALT (IU/L)                 24 ± 18               26 ± 22               23 ± 10               23 ± 12          33 ± 21          28 ± 16*        27 ± 19           26 ± 19
AST/ALT ratio              1.1 ± 0.3            1.1 ± 0.4            0.99 ± 0.34           0.94 ± 0.26        1.1 ± 0.60      1.2 ± 0.5        1.1 ± 0.4        1.1 ± 0.4
GGT (IU/L)                 37 ± 37               40 ± 44               67 ± 90               62 ± 96          64 ± 56          56 ± 55         50 ± 53           49 ± 56

Data are the mean ± SD. *P < 0.05, **P < 0.01 compared with baseline (paired t-test). BMI, body mass index; LDL-C, low-density lipoprotein–
cholesterol; HDL-C, high-density lipoprotein–cholesterol; TG, triglycerides; AST, aspartate aminotransferase; ALT, alanine aminotransferase; GGT,
c-glutamyltransferase.


Table 2. Although HDL-C did not change significantly, both                                        whereas HbA1c, ALT, and GGT were significantly higher, in
LDL-C and the LDL/HDL ratio decreased significantly in each                                       the HbA1c responders than non-responders.
group after 3 months treatment with ezetimibe. Specifically,                                         Simple linear regression analyses including all individuals
LDL-C decreased by 17.8% in the monotherapy group, by                                            showed that baseline ALT was significantly correlated with
33.3% in the statin group, and by 20.3% in the fibrate group fol-                                 the percentage change in HbA1c, calculated as (post-treatment
lowing ezetimibe treatment. There was no significant change in                                    value – baseline value) · 100/baseline value (r = –0.329;
TG in the monotherapy group, but TG levels did decrease sig-                                     P = 0.001; Figure 1a), as was the AST/ALT ratio (r = 0.306,
nificantly in the statin and fibrate groups. Serum AST, ALT,                                       P = 0.003; Figure 1b). A significant correlation was also noted
and GGT levels did not increase significantly in any of the                                       between the percentage change in serum ALT levels and per-
groups, and a significant decrease in serum ALT levels was seen                                   centage change in HbA1c (r = 0.307; P = 0.002; Figure 1c), as
in the fibrate group. Although HbA1c decreased in 49% of the                                      well as between the percentage change in the AST/ALT ratio
entire cohort (n = 47), the decrease was only significant in the                                  and the percentage change in HbA1c (r = –0.221; P = 0.03;
fibrate group.                                                                                    Figure 1d). Table 4 lists the correlations between other para-
   Therefore, to investigate the characteristics of individuals in                               meters and the percentage change in HbA1c, as determined by
whom HbA1c decreased after ezetimibe treatment, the sub-                                         linear regression analysis. The percentage change in HbA1c was
jects in each group were divided into two subgroups: either                                      significantly correlated with age.
responders (i.e. HbA1c decreased after 3 months treatment) or                                       When the subjects were divided into groups on the basis of
non-responders (i.e. HbA1c did not decrease after 3 months                                       serum ALT levels (i.e. ‡35 and <35 IU/L, a criterion proposed
treatment). We then compared the baseline characteristics                                        for the screening of fatty liver disease in Japanese subjects11),
between these subgroups. In those patients who responded                                         HbA1c decreased in 75.0% of individuals with serum ALT
to ezetimibe treatment, HbA1c decreased from 6.9 ± 0.8 to                                        levels ‡35 IU/L (Figure 2a). Similarly, when the subjects were
6.5 ± 0.7% (P < 0.001) in the monotherapy group, from                                            divided on the basis of the AST/ALT ratio (i.e. ‡1 and <1)12–15,
7.1 ± 1.3 to 6.6 ± 0.6% (P = 0.27) in the statin group, and from                                 HbA1c decreased in 75.0% of those with an AST/ALT ratio <1
6.8 ± 1.1 to 6.5 ± 1.0% (P < 0.001) in the fibrate group.                                         (Figure 2b).
Comparisons of baseline parameters between the responders                                           To identify factors associated with reductions in HbA1c fol-
and non-responders within each treatment group are given in                                      lowing ezetimibe treatment, we applied two-tailed chi-square
Table 3. In the monotherapy group, age and the AST/ALT ratio                                     tests to each parameter and calculated OR by cross-tabulation.
were significantly lower <¼ while serum AST and ALT levels                                        Serum ALT ‡35 IU/L (OR 4.125; 95% confidence interval [CI]
were significantly higher, in HbA1c responders than in non-                                       1.36–12.51; P = 0.02; sensitivity 0.319; specificity 0.898) and an
responders. In the statin group, HDL-C was significantly lower                                    AST/ALT ratio <1 (OR 8.320; 95% CI 3.29–21.02; P < 0.001;
in HbA1c responders than in non-responders. In the fibrate                                        sensitivity 0.681, specificity 0.796) were significantly associated
group, age and the AST/ALT ratio were significantly lower,                                        reductions in HbA1c following 3 months ezetimibe treatment.


ª 2011 Asian Association for the Study of Diabetes and Blackwell Publishing Asia Pty Ltd              Journal of Diabetes Investigation Volume •• Issue •• ••• 2011       3
4
                                                                                                         Table 3 | Comparisons of baseline clinical parameters between subjects with (+) or without ()) a decrease in HbA1c following 3 months treatment with ezetimibe

                                                                                                                                                                                                                                                                      Ezetimibe                                                                                                                                                                                                                                              Total (n = 96)
                                                                                                                                                                                                                                                                      + Statin (n = 11)                                                                                                              + Fibrate (n = 32)
                                                                                                                                                                                                                                                                                                                                                                                                                                                                                                                                                                                                             Ichimori et al.


                                                                                                                                                             Ezetimibe monotherapy (n = 53)
                                                                                                                                                             HbA1c                              HbA1c                                                       P-value   HbA1c           HbA1c                                                                                P-value                   HbA1c                                                                    HbA1c                          P-value         HbA1c                                          HbA1c                P-value
                                                                                                                                                             decrease (+)                       decrease ())                                                          decrease (+)    decrease ())                                                                                                   decrease (+)                                                             decrease ())                                   decrease (+)                                   decrease ())
                                                                                                                                                             (n = 23)                           (n = 30)                                                              (n = 5)         (n = 6)                                                                                                        (n = 19)                                                                 (n = 13)                                       (n = 47)                                       (n = 49)
                                                                                                         Age (years)                                         57.4 ± 12.1                        65.2 ± 10.3                                                 0.009     59.4 ± 12.5     66.0 ± 12.8                                                                          0.21                      56.1 ± 10.0                                                              67.2 ± 8.4                       0.001         57.1 ± 11.1                                    65.8 ± 10.0          < 0.001
                                                                                                         BMI (kg/m2)                                         25.1 ± 5.0                         24.8 ± 4.0                                                  0.39      28.1 ± 1.2      25.5 ± 4.1                                                                           0.10                      26.3 ± 4.6                                                               26.0 ± 3.8                       0.41          25.9 ± 4.6                                     25.2 ± 3.9             0.20
                                                                                                         LDL-C (mg/dL)                                       162 ± 26                           157 ± 45                                                    0.22      158 ± 48        170 ± 41                                                                             0.32                      170 ± 27                                                                 179 ± 26                         0.19          165 ± 29                                       162 ± 41               0.37
                                                                                                         HDL-C (mg/dL)                                        58 ± 13                            59 ± 17                                                    0.40       44 ± 6          58 ± 10                                                                             0.01                       51 ± 10                                                                  50 ± 9                          0.37           54 ± 12                                        56 ± 15               0.17
                                                                                                         LDL/HDL ratio                                        2.9 ± 0.8                          2.8 ± 1.2                                                  0.38       3.7 ± 1.3       3.0 ± 1.1                                                                           0.19                       3.6 ± 1.2                                                                3.8 ± 1.1                       0.32           3.2 ± 1.0                                      3.1 ± 1.2             0.28
                                                                                                         TG (mg/dL)                                          166 ± 77                           135 ± 70                                                    0.07      232 ± 100       198 ± 93                                                                             0.28                      253 ± 129                                                                309 ± 154                        0.14          208 ± 110                                      189 ± 125              0.21
                                                                                                         HbA1c (%)                                            6.9 ± 0.8                          6.6 ± 0.9                                                  0.17       7.1 ± 1.3       7.2 ± 1.3                                                                           0.44                       6.8 ± 1.1                                                                6.0 ± 0.8                       0.01           6.9 ± 1.0                                      6.6 ± 1.0             0.049
                                                                                                         AST (IU/L)                                           25 ± 8                             21 ± 5                                                     0.02       19 ± 5          20 ± 6                                                                              0.39                       29 ± 10                                                                  34 ± 29                         0.25           26 ± 9                                         24 ± 16               0.28
                                                                                                         ALT (IU/L)                                           32 ± 25                            19 ± 7                                                     0.004      24 ± 12         22 ± 10                                                                             0.42                       39 ± 20                                                                  25 ± 21                         0.03           34 ± 22                                        21 ± 13             < 0.001
                                                                                                         AST/ALT ratio                                        1.0 ± 0.4                          1.2 ± 0.3                                                  0.003      1.0 ± 0.4       1.0 ± 0.3                                                                           0.44                       0.8 ± 0.2                                                                1.6 ± 0.7                     < 0.001          0.9 ± 0.3                                      1.3 ± 0.5           < 0.001
                                                                                                         GGT (IU/L)                                           46 ± 53                            30 ± 15                                                    0.07       48 ± 30         86 ± 128                                                                            0.27                       79 ± 64                                                                  44 ± 33                         0.04           60 ± 57                                        40 ± 47               0.04

                                                                                                         Data are the mean ± SD. BMI, body mass index; LDL-C, low-density lipoprotein–cholesterol; HDL-C, high-density lipoprotein–cholesterol; TG, triglycerides; AST, aspartate aminotransferase;


Journal of Diabetes Investigation Volume •• Issue •• ••• 2011
                                                                                                         ALT, alanine aminotransferase; GGT, c-glutamyltransferase.


                                                                                                                                                                                                                                                           TG
                                                                                                                                                                                                                                                           BMI


                                                                                                                                                                                                                                                           AST
                                                                                                                                                                                                                                                           Age


                                                                                                                                                                                                                                                           GGT
                                                                                                                                                                                                                                                                                                                                                                                                                                                                                                                              ΔHbA1c (%)


                                                                                                                                                                                                                                                           LDL-C

                                                                                                                                                                                                                                                           HDL-C


                                                                                                                                                                                                                                                           HbA1c
                                                                                                                                                                                                                                                                                                                                                                                                                                                               –30
                                                                                                                                                                                                                                                                                                                                                                                                                                                                                             –20
                                                                                                                                                                                                                                                                                                                                                                                                                                                                                                   –10
                                                                                                                                                                                                                                                                                                                                                                                                                                                                                                         0
                                                                                                                                                                                                                                                                                                                                                                                                                                                                                                              10
                                                                                                                                                                                                                                                                                                                                                                                                                                                                                                                   20
                                                                                                                                                                                                                                                                                                                                                                                                                                                                                                                             30
                                                                                                                                                                                                                                                                                                                                                                                                                                                                                                                                                                –30
                                                                                                                                                                                                                                                                                                                                                                                                                                                                                                                                                                      –20
                                                                                                                                                                                                                                                                                                                                                                                                                                                                                                                                                                             –10
                                                                                                                                                                                                                                                                                                                                                                                                                                                                                                                                                                                   0
                                                                                                                                                                                                                                                                                                                                                                                                                                                                                                                                                                                       10
                                                                                                                                                                                                                                                                                                                                                                                                                                                                                                                                                                                             20
                                                                                                                                                                                                                                                                                                                                                                                                                                                                                                                                                                                                       30


                                                                                                                                                                                                                                                                                                                                                                                                                                                                                                                             (c)
                                                                                                                                                                                                                                                                                                                                                                                                                                                                                                                                                                                                       (a)


                                                                                                                                                                                                                                                           DLDL-C (%)

                                                                                                                                                                                                                                                           LDL/HDL ratio


                                                                                                       DISCUSSION
                                                                                                                                                                                                                                                                                                                                                                                                                                                                           ΔALT (%)
                                                                                                                                                                                                                                                                                                                                                                                                                                                                                                                                       ALT (IU/L)


                                                                                                                                                                                                                                                                                                                                                                                                                                                                                                                r = 0.307
                                                                                                                                                                                                                                                                                                                                                                                                                                                                                                                P = 0.002
                                                                                                                                                                                                                                                                                                                                                                                                                                                                                                                                                                                          P = 0.001


                                                                                                                                                                                                                                                                                                    percentage changes in HbA1c
                                                                                                                                                                                                                                                                                                                                                                                                                                                                                                                                                                                          r = –0.329


                                                                                                       by several other studies16–18.
                                                                                                                                                                                                                                                                                                                                                                                                                                                                 –75 –50–25 0 25 50 75 100


                                                                                                                                                                                                                                                                                          r
                                                                                                                                                                                                                                                                                                                                                                                                                                                                                                                                0 20 40 60 80 100 120 140


                                                                                                                                                                                                                                                                                                                                                                                                                                                               –30
                                                                                                                                                                                                                                                                                                                                                                                                                                                                                             –20
                                                                                                                                                                                                                                                                                                                                                                                                                                                                                                   –10
                                                                                                                                                                                                                                                                                                                                                                                                                                                                                                         0
                                                                                                                                                                                                                                                                                                                                                                                                                                                                                                              10
                                                                                                                                                                                                                                                                                                                                                                                                                                                                                                                   20
                                                                                                                                                                                                                                                                                                                                                                                                                                                                                                                              30
                                                                                                                                                                                                                                                                                                                                                                                                                                                                                                                                                                –30
                                                                                                                                                                                                                                                                                                                                                                                                                                                                                                                                                                      –20
                                                                                                                                                                                                                                                                                                                                                                                                                                                                                                                                                                             –10
                                                                                                                                                                                                                                                                                                                                                                                                                                                                                                                                                                                   0
                                                                                                                                                                                                                                                                                                                                                                                                                                                                                                                                                                                       10
                                                                                                                                                                                                                                                                                                                                                                                                                                                                                                                                                                                             20
                                                                                                                                                                                                                                                                                                                                                                                                                                                                                                                                                                                                        30


                                                                                                                                                                                                                                                                                                                                                                                                                                                                                                                             (d)
                                                                                                                                                                                                                                                                                                                                                                                                                                                                                                                                                                                                       (b)


                                                                                                                                                                                                                                                            0.0448


                                                                                                                                                                                                                                                           )0.1991
                                                                                                                                                                                                                                                           )0.1225
                                                                                                                                                                                                                                                           )0.1968
                                                                                                                                                                                                                                                           )0.0373
                                                                                                                                                                                                                                                           )0.0171
                                                                                                                                                                                                                                                           )0.1422
                                                                                                                                                                                                                                                            0.2877


                                                                                                                                                                                                                                                            0.1211
                                                                                                                                                                                                                                                            0.0448
                                                                                                                                                                                                                                                                                                                                                                                                                                                                  –50 –25 0


                                                                                                                                                                            AST, aspartate aminotransferase; GGT, c-glutamyltransferase.
                                                                                                                                                                                                                                                                                                                                                                                     serum ALT and (d) percentage changes in the AST/ALT ratio.
                                                                                                                                                                                                                                                                                                                                                                                                                                                                                                                P = 0.03
                                                                                                                                                                                                                                                                                                                                                                                                                                                                                                                                                                                          r = 0.306


                                                                                                                                                                                                                                                                                                                                                                                                                                                                                                                                        AST/ALT ratio
                                                                                                                                                                                                                                                                                                                                                                                                                                                                                                                                                                                          P = 0.003


                                                                                                                                                                                                                                                                                                                                                                                                                                                                                                                r = –0.221


                                                                                                                                                                                                                                                                                                                                                                                                                                                                       ΔAST/ALT ratio (%)


                                                                                                                                                                            tion analysis. BMI, body mass index; LDL-C, low-density lipoprotein–
                                                                                                                                                                                                                                                                                                                                                                                     (a) serum alanine aminotransferase (ALT) at baseline, (b) the aspartate


                                                                                                                                                                                                                                                           0.66


                                                                                                                                                                                                                                                           0.06
                                                                                                                                                                                                                                                           0.23
                                                                                                                                                                                                                                                           0.06
                                                                                                                                                                                                                                                           0.72
                                                                                                                                                                                                                                                           0.87
                                                                                                                                                                                                                                                           0.24
                                                                                                                                                                                                                                                           0.66
                                                                                                                                                                                                                                                           0.18
                                                                                                                                                                                                                                                                                                                                                                                                                                                                               25 50 75


                                                                                                                                                                                                                                                                                                                                                                                     aminotransferase (AST)/ALT ratio at baseline, (c) percentage changes in


                                                                                                                                                                                                                                                           0.005
                                                                                                                                                                                                                                                                                                                                                                                                                                                                                                                                0 0.5 1.0 1.5 2.0 2.5 3.0 3.5


                                                                                                                                                                                                                                                                                                                                                                                     Figure 1 | Correlations between the percentage change in HbA1c and


                                                                                                                                                                            cholesterol; HDL-C, high-density lipoprotein–cholesterol; TG, triglycerides;
                                                                                                                                                                            Correlations were determined using Pearson’s product–moment correla-


                                                                                                       In the present study, ezetimibe treatment improved HbA1c in

                                                                                                       to improving lipid profiles. These findings suggest that improve-


            ª 2011 Asian Association for the Study of Diabetes and Blackwell Publishing Asia Pty Ltd
                                                                                                       bly other risk factors, for diabetes. These findings are supported
                                                                                                       ments in lipid profiles could reduce insulin resistance, and possi-
                                                                                                                                                                                                                                                                                          P-value


                                                                                                       patients with type 2 diabetes and liver dysfunction, in addition
                                                                                                                                                                                                                                                                                                    Table 4 | Correlations between baseline clinical characteristics and
Ezetimibe and glucose metabolism


  (a)                                                                                                       more readily in subjects with hepatic insulin resistance induced
     45                                                                                                45   by non-alcoholic fatty liver disease. According to a previous
           40                                                                                         40    study11, when subjects were analyzed according to age, the prev-
             35                                                                                       35    alence of fatty liver among 23,148 Japanese men was almost
              30                                                                                      30    unchanged in those aged between 30 and 60 years. Conversely,
   Subjects (n)


                  25                                                                                 25     in 12,371 Japanese women, the prevalence of fatty liver
                  20                                                                                 20     increased with age. However, some authors have reported that
                  15                                                                                15      fatty liver is more common in younger than older individu-
                   10                                                                               10      als19,20. Thus, the association between age and the prevalence of
                     5                                                                             5        fatty liver is contentious. Moreover, no studies have investigated
                     0                                                                             0
                                                                                                            the correlation between age and the prevalence of fatty liver in
                                                                                                 d          subjects with type 2 diabetes. It is possible that the prevalence of
                                                                                            a se            fatty liver in younger individuals was higher than in older indi-
                                                                                         re
                         <3                                                           ec                    viduals in the present study. Although it was difficult to obtain
                           5                                                      td
                          ALT                                                  No                           reliable data regarding the duration of diabetes in these patients,
                                                                                   c
                                 (IU           ≥3                    s  ed      A1
                                    /L)          5                  a         Hb                            it may be possible that the duration of diabetes and diet therapy
                                                               c re
                                                            De                                              was shorter in younger individuals than in older individuals.
                                                                                                            Future trials should investigate relationships between the preva-
  (b)                                                                                                       lence of liver disease, the age of diabetic patients, and the dura-
           45                                                                                         45    tion of diabetes and diet therapy. Although it has been reported
           40                                                                                         40    that the incidence of steatosis generally increases with increases
            35                                                                                       35     in body mass index (BMI)11, the present study found no corre-
              30                                                                                     30     lation between BMI and decreases in HbA1c. This may have
   Subjects (n)


              25                                                                                     25     been because only 12.5% of the subjects in the present study
                  20                                                                                 20     had a BMI ‡30 kg/m2, a level above which 80% of Japanese
                  15                                                                                15      individuals have liver steatosis11.
                   10                                                                              10          In the present study, HbA1c decreased significantly after
                    5                                                                              5        3 months treatment in the fibrate group, but not in the other
                    0                                                                              0
                                                                                                            two groups, and 31 of the 32 subjects in the fibrate group were
                                                                                                d           being treated with bezafibrate. Because bezafibrate is a non-
                                                                                            se              specific agonist of peroxisome proliferator-activated receptor
                                                                                         ea
                                                                                   e   cr
                         <1                                                      td                         (PPAR) a and actually activates all three PPAR subtypes (i.e. a,
                         AS                                                   No       c                    c, and d), bezafibrate may directly improve insulin sensitivity21
                            T/ALT                                         d      A1
                                       rat     ≥1                       se     Hb                           and alleviate liver steatosis22. Therefore, combination therapy
                                          io                     ea
                                                               cr
                                                            De                                              with ezetimibe and bezafibrate may confer greater improve-
Figure 2 | Distribution of subjects stratified according changes in
                                                                                                            ments in glucose metabolism.
HbA1c and (a) serum alanine aminotransferase (ALT) at baseline or                                              Certain limitations of the present study warrant consideration.
(b) the aspartate aminotransferase (AST)/ALT ratio at baseline.                                             First, because we did not measure markers of insulin sensitivity
                                                                                                            directly (e.g. using glucose clamp or the homeostasis model
                                                                                                            assessment of insulin resistance [HOMA-IR]) or free fatty acids
   On the basis of our results, markers of liver function and age                                           (FFAs) in the present study, we cannot provide direct evidence
differed significantly between HbA1c responders and non-                                                     that ezetimibe improves insulin sensitivity or FFA profiles. How-
responders in the monotherapy and fibrate groups, but not in                                                 ever, it is not possible to routinely perform the glucose clamp in
the statin group (which was comprised of a smaller number of                                                clinical practice. In addition, HOMA-IR may not be a reliable
subjects than the other two groups). We also found that                                                     method for determining insulin resistance in diabetic patients
decreases in HbA1c were significantly correlated with serum                                                  treated with antidiabetic agents, particularly in those treated with
ALT, the AST/ALT ratio, and age in the entire cohort. Subjects                                              insulin. Second, we did not perform ultrasound echography,
with ALT levels ‡35 IU/L and those with an AST/ALT ratio <1                                                 computed tomography, or liver biopsy to evaluate the progres-
experienced significant reductions in HbA1c from 6.5 ± 1.0 to                                                sion of liver steatosis. However, because 43.8% of subjects
6.3 ± 0.8% (P = 0.001) and from 6.9 ± 1.0 to 6.6 ± 1.0%                                                     (n = 42) in the present study had an AST/ALT ratio <1, it is
(P < 0.001), respectively. These findings suggest that improve-                                              likely that most had liver steatosis.
ments in hepatic insulin sensitivity as a result of suppressed                                                 In conclusion, some of the subjects in the present study expe-
hepatic fat accumulation may underlie the improvements in                                                   rienced improvements in HbA1c following 3 months treatment
HbA1c conferred by ezetimibe. This improvement may occur                                                    with ezetimibe. Serum ALT levels and the AST/ALT ratio were


ª 2011 Asian Association for the Study of Diabetes and Blackwell Publishing Asia Pty Ltd                       Journal of Diabetes Investigation Volume •• Issue •• ••• 2011   5
Ichimori et al.


both predictive factors of the glucose metabolism response to            10. Seino Y, Nanjo K, Tajima N, et al. Report of the Committee
ezetimibe, which appeared to reflect improvements in hepatic                  on the Classification and Diagnostic Criteria of Diabetes
insulin sensitivity conferred by ezetimibe. Therefore, ezetimibe             Mellitus. The Committee of the Japan Diabetes Society on
may not only improve lipid metabolism, but also liver steatosis              the Diagnostic Criteria of Diabetes Mellitus. Diabetol Int 2010;
and glucose metabolism in type 2 diabetic patients with steato-              1: 2–20.
sis, as indicated by serum ALT levels ‡35 IU/L or an AST/ALT             11. Kojima S, Watanabe N, Numata M, et al. Increase in the prev-
ratio <1.                                                                    alence of fatty liver in Japan over the past 12 years: analysis
                                                                             of clinical background. J Gastroenterol 2003; 38: 954–961.
ACKNOWLEDGEMENT                                                          12. Neuschwander-Tetri BA, Bacon BR. Nonalcoholic steatohepa-
The authors thank to Dr Fumihiko Sakamoto (Tenjin Clinic,                    titis. Med Clin North Am 1996; 80: 1147–1166.
Kumamoto, Japan) for his assistance with patient referral to the         13. Pinto HC, Baptista A, Camilo ME, et al. Nonalcoholic steato-
present study. The authors declare no potential conflicts of                  hepatitis. Clinicopathological comparison with alcoholic
interest relevant to this article.                                           hepatitis in ambulatory and hospitalized patients. Dig Dis Sci
                                                                             1996; 41: 172–179.
REFERENCES                                                               14. Sorbi D, Boynton J, Lindor KD. The ratio of aspartate amino-
 1. Sone H, Tanaka S, Iimuro S, et al. Long-term lifestyle inter-            transferase to alanine aminotransferase: potential value in
    vention lowers the incidence of stroke in Japanese patients              differentiating nonalcoholic steatohepatitis from alcoholic
    with type 2 diabetes: a nationwide multicentre randomised                liver disease. Am J Gastroenterol 1999; 94: 1018–1022.
    controlled trial (the Japan Diabetes Complications Study).           15. Wallerstedt S, Olsson R, Waldenstro J. The diagnostic signif-
                                                                                                                  ¨m
    Diabetologia 2010; 53: 419–428.                                          icance of a high ASAT–ALAT (GOT–GPT) ratio in patients
 2. Strandberg TE, Tilvis RS, Pitkala KH, et al. Cholesterol and glu-        with very high serum aminotransferase levels. Acta Med
    cose metabolism and recurrent cardiovascular events among                Scand 1974; 195: 227–229.
    the elderly: a prospective study. J Am Coll Cardiol 2006; 48:        16. Bajaj M, Suraamornkul S, Kashyap S, et al. Sustained reduc-
    708–714.                                                                 tion in plasma free fatty acid concentration improves insulin
 3. Lally S, Tan CY, Owens D, et al. mRNA levels of genes                    action without altering plasma adipocytokine levels in
    involved in dysregulation of postprandial lipoproteins in type           subjects with strong family history of type 2 diabetes. J Clin
    2 diabetes: the role of Niemann Pick C1-like 1, ABCG5 and                Endocrinol Metab 2004; 89: 4649–4655.
    G8 and microsomal triglyceride transfer protein. Diabetologia        17. Santomauro AT, Boden G, Silva ME, et al. Overnight lowering
    2006; 49: 1008–1016.                                                     of free fatty acids with Acipimox improves insulin resistance
 4. Davies JP, Scott C, Oishi K, et al. Inactivation of NPC1L1               and glucose tolerance in obese diabetic and nondiabetic
    causes multiple lipid transport defects and protects against             subjects. Diabetes 1999; 48: 1836–1841.
    diet-induced hypercholesterolemia. J Biol Chem 2005; 280:            18. Gu ¨ F, Ozmen B, Hekimsoy Z, et al. Effects of a statin
                                                                                ¨çlu
    12710–12720.                                                             group drug, pravastatin, on the insulin resistance in patients
 5. Deushi M, Nomura M, Kawakami A, et al. Ezetimibe improves                with metabolic syndrome. Biomed Pharmacother 2004; 58:
    liver steatosis and insulin resistance in obese rat model of             614–618.
    metabolic syndrome. FEBS Lett 2007; 581: 5664–5670.                  19. Yamada T, Fukatsu M, Suzuki S, et al. Fatty liver predicts
 6. Muraoka T, Aoki K, Iwasaki T, et al. Ezetimibe decreases                 impaired fasting glucose and type 2 diabetes mellitus in
    SREBP-1c expression in liver and reverses hepatic insulin                Japanese undergoing a health checkup. J Gastroenterol
    resistance in mice fed a high-fat diet. Metabolism 2010; 60:             Hepatol 2010; 25: 352–356.
    617–628.                                                             20. Lonardo A, Lombardini S, Scaglioni F, et al. Fatty liver, carotid
 7. Nozaki Y, Fujita K, Yoneda M, et al. Long-term combination               disease and gallstones: a study of age-related. World J
    therapy of ezetimibe and acarbose for non-alcoholic fatty                Gastroenterol 2006; 12: 5826–5833.
    liver disease. J Hepatol 2009; 51: 548–556.                          21. Tenenbaum T, Fisman EZ, Boyko V, et al. Attenuation of
 8. Neuschwander-Tetri BA, Caldwell SH. Nonalcoholic steato-                 progression of insulin resistance in patients with coronary
    hepatitis: summary of an AASLD Single Topic Conference.                  artery disease by bezafibrate. Arch Intern Med 2006; 166:
    Hepatology 2003; 37: 1202–1219.                                          737–741.
 9. American Gastroenterological Association. American                   22. Inoue I, Noji S, Awata T, et al. Bezafibrate has an antioxidant
    Gastroenterological Association medical position statement:              effect: peroxisome proliferator-activated receptor alpha is
    nonalcoholic fatty liver disease. Gastroenterology 2002; 123:            associated with Cu2+, Zn2+-superoxide dismutase in the liver.
    1702–1704.                                                               Life Sci 1998; 63: 135–144.


6        Journal of Diabetes Investigation Volume •• Issue •• ••• 2011       ª 2011 Asian Association for the Study of Diabetes and Blackwell Publishing Asia Pty Ltd

More Related Content

What's hot

Effect of Camel Milk Consumption
Effect of Camel Milk ConsumptionEffect of Camel Milk Consumption
Effect of Camel Milk ConsumptionHoney Joy Soleria
 
Semaglutide journal club
Semaglutide journal clubSemaglutide journal club
Semaglutide journal clubBhargav Kiran
 
Consumption of Synbiotic Bread Decreases Triacylglycerol and VLDL Levels Whil...
Consumption of Synbiotic Bread Decreases Triacylglycerol and VLDL Levels Whil...Consumption of Synbiotic Bread Decreases Triacylglycerol and VLDL Levels Whil...
Consumption of Synbiotic Bread Decreases Triacylglycerol and VLDL Levels Whil...Haleh Hadaegh
 
Transglucosidase improves the gut microbiota profile of type 2 diabetes melli...
Transglucosidase improves the gut microbiota profile of type 2 diabetes melli...Transglucosidase improves the gut microbiota profile of type 2 diabetes melli...
Transglucosidase improves the gut microbiota profile of type 2 diabetes melli...Enrique Moreno Gonzalez
 
BP, allopathy,medicine,prevention
BP, allopathy,medicine,preventionBP, allopathy,medicine,prevention
BP, allopathy,medicine,preventionSHAH MURAD
 
IOSR Journal of Pharmacy (IOSRPHR)
IOSR Journal of Pharmacy (IOSRPHR)IOSR Journal of Pharmacy (IOSRPHR)
IOSR Journal of Pharmacy (IOSRPHR)iosrphr_editor
 
Semaglutide brings breakthroughs in weight management for type 2 diabetes bio...
Semaglutide brings breakthroughs in weight management for type 2 diabetes bio...Semaglutide brings breakthroughs in weight management for type 2 diabetes bio...
Semaglutide brings breakthroughs in weight management for type 2 diabetes bio...DoriaFang
 
Duodenal-jejeunal Bypass in Non-obese Adults with Type 2 Diabetes
Duodenal-jejeunal Bypass in Non-obese Adults with Type 2 DiabetesDuodenal-jejeunal Bypass in Non-obese Adults with Type 2 Diabetes
Duodenal-jejeunal Bypass in Non-obese Adults with Type 2 DiabetesGeorge S. Ferzli
 
lesinurad in combination with allopurinol a randomised, double blind, placebo...
lesinurad in combination with allopurinol a randomised, double blind, placebo...lesinurad in combination with allopurinol a randomised, double blind, placebo...
lesinurad in combination with allopurinol a randomised, double blind, placebo...arnab ghosh
 
Various Glycemic Index And Fmd Jacc 2009
Various Glycemic Index And Fmd Jacc 2009Various Glycemic Index And Fmd Jacc 2009
Various Glycemic Index And Fmd Jacc 2009Orr Katznelson
 
COMPARATIVE ASSESSMENT OF THE EEFFECT OF ARGINASE INHIBITOR L-NORVALINE AND M...
COMPARATIVE ASSESSMENT OF THE EEFFECT OF ARGINASE INHIBITOR L-NORVALINE AND M...COMPARATIVE ASSESSMENT OF THE EEFFECT OF ARGINASE INHIBITOR L-NORVALINE AND M...
COMPARATIVE ASSESSMENT OF THE EEFFECT OF ARGINASE INHIBITOR L-NORVALINE AND M...ShubhamBaliyan13
 
Study of Ischemia Modified Albumin in Type 2 Diabetes as a Marker of Severity
Study of Ischemia Modified Albumin in Type 2 Diabetes as a Marker of SeverityStudy of Ischemia Modified Albumin in Type 2 Diabetes as a Marker of Severity
Study of Ischemia Modified Albumin in Type 2 Diabetes as a Marker of Severityiosrjce
 
Potentiality of a newer oral Anti hyperglycemic combination therapy over conv...
Potentiality of a newer oral Anti hyperglycemic combination therapy over conv...Potentiality of a newer oral Anti hyperglycemic combination therapy over conv...
Potentiality of a newer oral Anti hyperglycemic combination therapy over conv...Dr. Raghavendra Kumar Gunda
 
Metformin presentation sigma xi
Metformin presentation sigma xiMetformin presentation sigma xi
Metformin presentation sigma xiLaceyg92
 
ANTIOXIDANT VITAMINS IN DIABETES
ANTIOXIDANT VITAMINS IN DIABETES ANTIOXIDANT VITAMINS IN DIABETES
ANTIOXIDANT VITAMINS IN DIABETES Aziza Qadeer
 

What's hot (20)

Effect of Camel Milk Consumption
Effect of Camel Milk ConsumptionEffect of Camel Milk Consumption
Effect of Camel Milk Consumption
 
Semaglutide journal club
Semaglutide journal clubSemaglutide journal club
Semaglutide journal club
 
Consumption of Synbiotic Bread Decreases Triacylglycerol and VLDL Levels Whil...
Consumption of Synbiotic Bread Decreases Triacylglycerol and VLDL Levels Whil...Consumption of Synbiotic Bread Decreases Triacylglycerol and VLDL Levels Whil...
Consumption of Synbiotic Bread Decreases Triacylglycerol and VLDL Levels Whil...
 
Glycated Hemoglobin as a Dual Biomarker in Type 2 Diabetes Mellitus Predictin...
Glycated Hemoglobin as a Dual Biomarker in Type 2 Diabetes Mellitus Predictin...Glycated Hemoglobin as a Dual Biomarker in Type 2 Diabetes Mellitus Predictin...
Glycated Hemoglobin as a Dual Biomarker in Type 2 Diabetes Mellitus Predictin...
 
Transglucosidase improves the gut microbiota profile of type 2 diabetes melli...
Transglucosidase improves the gut microbiota profile of type 2 diabetes melli...Transglucosidase improves the gut microbiota profile of type 2 diabetes melli...
Transglucosidase improves the gut microbiota profile of type 2 diabetes melli...
 
BP, allopathy,medicine,prevention
BP, allopathy,medicine,preventionBP, allopathy,medicine,prevention
BP, allopathy,medicine,prevention
 
IOSR Journal of Pharmacy (IOSRPHR)
IOSR Journal of Pharmacy (IOSRPHR)IOSR Journal of Pharmacy (IOSRPHR)
IOSR Journal of Pharmacy (IOSRPHR)
 
Semaglutide brings breakthroughs in weight management for type 2 diabetes bio...
Semaglutide brings breakthroughs in weight management for type 2 diabetes bio...Semaglutide brings breakthroughs in weight management for type 2 diabetes bio...
Semaglutide brings breakthroughs in weight management for type 2 diabetes bio...
 
Duodenal-jejeunal Bypass in Non-obese Adults with Type 2 Diabetes
Duodenal-jejeunal Bypass in Non-obese Adults with Type 2 DiabetesDuodenal-jejeunal Bypass in Non-obese Adults with Type 2 Diabetes
Duodenal-jejeunal Bypass in Non-obese Adults with Type 2 Diabetes
 
lesinurad in combination with allopurinol a randomised, double blind, placebo...
lesinurad in combination with allopurinol a randomised, double blind, placebo...lesinurad in combination with allopurinol a randomised, double blind, placebo...
lesinurad in combination with allopurinol a randomised, double blind, placebo...
 
Various Glycemic Index And Fmd Jacc 2009
Various Glycemic Index And Fmd Jacc 2009Various Glycemic Index And Fmd Jacc 2009
Various Glycemic Index And Fmd Jacc 2009
 
Aace consensus statement
Aace consensus statementAace consensus statement
Aace consensus statement
 
RSSDI
RSSDI RSSDI
RSSDI
 
COMPARATIVE ASSESSMENT OF THE EEFFECT OF ARGINASE INHIBITOR L-NORVALINE AND M...
COMPARATIVE ASSESSMENT OF THE EEFFECT OF ARGINASE INHIBITOR L-NORVALINE AND M...COMPARATIVE ASSESSMENT OF THE EEFFECT OF ARGINASE INHIBITOR L-NORVALINE AND M...
COMPARATIVE ASSESSMENT OF THE EEFFECT OF ARGINASE INHIBITOR L-NORVALINE AND M...
 
Study of Ischemia Modified Albumin in Type 2 Diabetes as a Marker of Severity
Study of Ischemia Modified Albumin in Type 2 Diabetes as a Marker of SeverityStudy of Ischemia Modified Albumin in Type 2 Diabetes as a Marker of Severity
Study of Ischemia Modified Albumin in Type 2 Diabetes as a Marker of Severity
 
J046057060
J046057060J046057060
J046057060
 
Potentiality of a newer oral Anti hyperglycemic combination therapy over conv...
Potentiality of a newer oral Anti hyperglycemic combination therapy over conv...Potentiality of a newer oral Anti hyperglycemic combination therapy over conv...
Potentiality of a newer oral Anti hyperglycemic combination therapy over conv...
 
Metformin
MetforminMetformin
Metformin
 
Metformin presentation sigma xi
Metformin presentation sigma xiMetformin presentation sigma xi
Metformin presentation sigma xi
 
ANTIOXIDANT VITAMINS IN DIABETES
ANTIOXIDANT VITAMINS IN DIABETES ANTIOXIDANT VITAMINS IN DIABETES
ANTIOXIDANT VITAMINS IN DIABETES
 

Viewers also liked

Renin inhibitors
Renin inhibitorsRenin inhibitors
Renin inhibitorsRuy Pantoja
 
O futuro na terapia baseada em incretins.
O futuro na terapia baseada em incretins.O futuro na terapia baseada em incretins.
O futuro na terapia baseada em incretins.Ruy Pantoja
 
Glucagon-like peptide-1-based therapies and cardiovascular
Glucagon-like peptide-1-based therapies and cardiovascularGlucagon-like peptide-1-based therapies and cardiovascular
Glucagon-like peptide-1-based therapies and cardiovascularRuy Pantoja
 
Diabetes, inflamação e remédios chineses tradicionais.
Diabetes, inflamação e remédios chineses tradicionais.Diabetes, inflamação e remédios chineses tradicionais.
Diabetes, inflamação e remédios chineses tradicionais.Ruy Pantoja
 
Obesity , Circadian rythms
Obesity , Circadian rythmsObesity , Circadian rythms
Obesity , Circadian rythmsRuy Pantoja
 

Viewers also liked (6)

B cell failure
B cell failure B cell failure
B cell failure
 
Renin inhibitors
Renin inhibitorsRenin inhibitors
Renin inhibitors
 
O futuro na terapia baseada em incretins.
O futuro na terapia baseada em incretins.O futuro na terapia baseada em incretins.
O futuro na terapia baseada em incretins.
 
Glucagon-like peptide-1-based therapies and cardiovascular
Glucagon-like peptide-1-based therapies and cardiovascularGlucagon-like peptide-1-based therapies and cardiovascular
Glucagon-like peptide-1-based therapies and cardiovascular
 
Diabetes, inflamação e remédios chineses tradicionais.
Diabetes, inflamação e remédios chineses tradicionais.Diabetes, inflamação e remédios chineses tradicionais.
Diabetes, inflamação e remédios chineses tradicionais.
 
Obesity , Circadian rythms
Obesity , Circadian rythmsObesity , Circadian rythms
Obesity , Circadian rythms
 

Similar to Exetimibe melhora dm diminuindo nafld.x

Diabetic study camel milk- agrawal 2005
Diabetic study   camel milk- agrawal 2005Diabetic study   camel milk- agrawal 2005
Diabetic study camel milk- agrawal 2005Dr.Talal elhassan
 
Diabetic study camel milk- agrawal 2005
Diabetic study   camel milk- agrawal 2005Diabetic study   camel milk- agrawal 2005
Diabetic study camel milk- agrawal 2005Dr.Talal elhassan
 
Tirzepatide versus Semiglutide Once Weekly in Patients with Type 2 Diabetes.pdf
Tirzepatide versus Semiglutide Once Weekly in Patients with Type 2 Diabetes.pdfTirzepatide versus Semiglutide Once Weekly in Patients with Type 2 Diabetes.pdf
Tirzepatide versus Semiglutide Once Weekly in Patients with Type 2 Diabetes.pdfHaramaya University
 
Ueda2015 lilly.the art of insulin dr.mesbah sayed
Ueda2015 lilly.the art of insulin dr.mesbah sayedUeda2015 lilly.the art of insulin dr.mesbah sayed
Ueda2015 lilly.the art of insulin dr.mesbah sayedueda2015
 
Abstract_SMODIA2015_Acharjee_et_al
Abstract_SMODIA2015_Acharjee_et_alAbstract_SMODIA2015_Acharjee_et_al
Abstract_SMODIA2015_Acharjee_et_alBenjamin Jenkins
 
Saxagliptin eficacia
Saxagliptin eficaciaSaxagliptin eficacia
Saxagliptin eficaciaInés Gomez
 
Efecto incretina fisologia
Efecto incretina fisologiaEfecto incretina fisologia
Efecto incretina fisologiayanetguzmanaybar
 
Treatment strategies in patients with statin intolerance
Treatment strategies in patients with statin intoleranceTreatment strategies in patients with statin intolerance
Treatment strategies in patients with statin intoleranceVishwanath Hesarur
 
IOSR Journal of Pharmacy (IOSRPHR)
IOSR Journal of Pharmacy (IOSRPHR)IOSR Journal of Pharmacy (IOSRPHR)
IOSR Journal of Pharmacy (IOSRPHR)iosrphr_editor
 
Degludec insulin journal review
Degludec insulin journal reviewDegludec insulin journal review
Degludec insulin journal reviewSantosh Narayankar
 
Ueda2016 symposium - basal plus &amp; basal bolus - lobna el toony
Ueda2016 symposium - basal plus &amp; basal bolus -  lobna el toonyUeda2016 symposium - basal plus &amp; basal bolus -  lobna el toony
Ueda2016 symposium - basal plus &amp; basal bolus - lobna el toonyueda2015
 
Transplantation of Autologous Bone Marrow- Derived Stromal Cells in Type 2 Di...
Transplantation of Autologous Bone Marrow- Derived Stromal Cells in Type 2 Di...Transplantation of Autologous Bone Marrow- Derived Stromal Cells in Type 2 Di...
Transplantation of Autologous Bone Marrow- Derived Stromal Cells in Type 2 Di...CrimsonpublishersITERM
 
Central Lechera Asturiana, estudio de intervención Naturlinea
Central Lechera Asturiana, estudio de intervención Naturlinea Central Lechera Asturiana, estudio de intervención Naturlinea
Central Lechera Asturiana, estudio de intervención Naturlinea Central_Lechera_Asturiana
 
Diabetes Mellitus - An Integrated Approach
Diabetes Mellitus - An Integrated ApproachDiabetes Mellitus - An Integrated Approach
Diabetes Mellitus - An Integrated Approachpgahalya
 

Similar to Exetimibe melhora dm diminuindo nafld.x (20)

A0460108
A0460108A0460108
A0460108
 
Diabetic study camel milk- agrawal 2005
Diabetic study   camel milk- agrawal 2005Diabetic study   camel milk- agrawal 2005
Diabetic study camel milk- agrawal 2005
 
Diabetic study camel milk- agrawal 2005
Diabetic study   camel milk- agrawal 2005Diabetic study   camel milk- agrawal 2005
Diabetic study camel milk- agrawal 2005
 
Bis glycinate vs ascorbate
Bis glycinate vs ascorbateBis glycinate vs ascorbate
Bis glycinate vs ascorbate
 
Tirzepatide versus Semiglutide Once Weekly in Patients with Type 2 Diabetes.pdf
Tirzepatide versus Semiglutide Once Weekly in Patients with Type 2 Diabetes.pdfTirzepatide versus Semiglutide Once Weekly in Patients with Type 2 Diabetes.pdf
Tirzepatide versus Semiglutide Once Weekly in Patients with Type 2 Diabetes.pdf
 
Ueda2015 lilly.the art of insulin dr.mesbah sayed
Ueda2015 lilly.the art of insulin dr.mesbah sayedUeda2015 lilly.the art of insulin dr.mesbah sayed
Ueda2015 lilly.the art of insulin dr.mesbah sayed
 
1402-5031-2-PB
1402-5031-2-PB1402-5031-2-PB
1402-5031-2-PB
 
Abstract_SMODIA2015_Acharjee_et_al
Abstract_SMODIA2015_Acharjee_et_alAbstract_SMODIA2015_Acharjee_et_al
Abstract_SMODIA2015_Acharjee_et_al
 
Literature Evaluation.pptx
Literature Evaluation.pptxLiterature Evaluation.pptx
Literature Evaluation.pptx
 
Saxagliptin eficacia
Saxagliptin eficaciaSaxagliptin eficacia
Saxagliptin eficacia
 
Efecto incretina fisologia
Efecto incretina fisologiaEfecto incretina fisologia
Efecto incretina fisologia
 
Treatment strategies in patients with statin intolerance
Treatment strategies in patients with statin intoleranceTreatment strategies in patients with statin intolerance
Treatment strategies in patients with statin intolerance
 
Role of Glycated Hemoglobin in the Diagnosis of Diabetes Mellitus and Pre-dia...
Role of Glycated Hemoglobin in the Diagnosis of Diabetes Mellitus and Pre-dia...Role of Glycated Hemoglobin in the Diagnosis of Diabetes Mellitus and Pre-dia...
Role of Glycated Hemoglobin in the Diagnosis of Diabetes Mellitus and Pre-dia...
 
IOSR Journal of Pharmacy (IOSRPHR)
IOSR Journal of Pharmacy (IOSRPHR)IOSR Journal of Pharmacy (IOSRPHR)
IOSR Journal of Pharmacy (IOSRPHR)
 
Degludec insulin journal review
Degludec insulin journal reviewDegludec insulin journal review
Degludec insulin journal review
 
Ueda2016 symposium - basal plus &amp; basal bolus - lobna el toony
Ueda2016 symposium - basal plus &amp; basal bolus -  lobna el toonyUeda2016 symposium - basal plus &amp; basal bolus -  lobna el toony
Ueda2016 symposium - basal plus &amp; basal bolus - lobna el toony
 
Hidrosaline
HidrosalineHidrosaline
Hidrosaline
 
Transplantation of Autologous Bone Marrow- Derived Stromal Cells in Type 2 Di...
Transplantation of Autologous Bone Marrow- Derived Stromal Cells in Type 2 Di...Transplantation of Autologous Bone Marrow- Derived Stromal Cells in Type 2 Di...
Transplantation of Autologous Bone Marrow- Derived Stromal Cells in Type 2 Di...
 
Central Lechera Asturiana, estudio de intervención Naturlinea
Central Lechera Asturiana, estudio de intervención Naturlinea Central Lechera Asturiana, estudio de intervención Naturlinea
Central Lechera Asturiana, estudio de intervención Naturlinea
 
Diabetes Mellitus - An Integrated Approach
Diabetes Mellitus - An Integrated ApproachDiabetes Mellitus - An Integrated Approach
Diabetes Mellitus - An Integrated Approach
 

More from Ruy Pantoja

Dm e efeitos da canela
Dm e efeitos da canelaDm e efeitos da canela
Dm e efeitos da canelaRuy Pantoja
 
Dieta hiperproteica para obeso com resistência à insulina
Dieta hiperproteica para obeso com resistência à insulinaDieta hiperproteica para obeso com resistência à insulina
Dieta hiperproteica para obeso com resistência à insulinaRuy Pantoja
 
Ressecção parcial de pâncreas x regeneração x terapia incretínica humanos
Ressecção parcial de pâncreas x regeneração x terapia incretínica humanosRessecção parcial de pâncreas x regeneração x terapia incretínica humanos
Ressecção parcial de pâncreas x regeneração x terapia incretínica humanosRuy Pantoja
 
Brown adipose tissue
Brown adipose tissueBrown adipose tissue
Brown adipose tissueRuy Pantoja
 
Não somos quentes o suficiente ?
Não somos quentes o suficiente ?Não somos quentes o suficiente ?
Não somos quentes o suficiente ?Ruy Pantoja
 
MACROPHAGE AND BROWN FAT
MACROPHAGE AND BROWN FATMACROPHAGE AND BROWN FAT
MACROPHAGE AND BROWN FATRuy Pantoja
 
Proteinas 14 3-3 e insulina
Proteinas 14 3-3 e insulinaProteinas 14 3-3 e insulina
Proteinas 14 3-3 e insulinaRuy Pantoja
 
Beta cell stress en dm2 b
Beta cell stress en dm2 bBeta cell stress en dm2 b
Beta cell stress en dm2 bRuy Pantoja
 
Beta cell stres in dm2 a
Beta cell stres in dm2 aBeta cell stres in dm2 a
Beta cell stres in dm2 aRuy Pantoja
 
Beta cell failure, stress and dm2
Beta cell failure, stress and dm2Beta cell failure, stress and dm2
Beta cell failure, stress and dm2Ruy Pantoja
 
Dpp4 e angiogênese
Dpp4 e angiogêneseDpp4 e angiogênese
Dpp4 e angiogêneseRuy Pantoja
 
DIABETES AND CANCER
DIABETES AND CANCERDIABETES AND CANCER
DIABETES AND CANCERRuy Pantoja
 
Glicemia e fat food ingestion
Glicemia e fat food ingestionGlicemia e fat food ingestion
Glicemia e fat food ingestionRuy Pantoja
 
Sitagliptina e proteção em ca diferenciado da tireóide.x
Sitagliptina e proteção em ca diferenciado da tireóide.xSitagliptina e proteção em ca diferenciado da tireóide.x
Sitagliptina e proteção em ca diferenciado da tireóide.xRuy Pantoja
 
Dpp4 i for the treatment of ACNE
Dpp4 i for the treatment of ACNEDpp4 i for the treatment of ACNE
Dpp4 i for the treatment of ACNERuy Pantoja
 
GLP 1 E GIP: DIFERENÇAS E SEMELHANÇAS
GLP 1 E GIP: DIFERENÇAS E SEMELHANÇASGLP 1 E GIP: DIFERENÇAS E SEMELHANÇAS
GLP 1 E GIP: DIFERENÇAS E SEMELHANÇASRuy Pantoja
 
To my colleagues from many parts of the world
To my colleagues from many parts of the worldTo my colleagues from many parts of the world
To my colleagues from many parts of the worldRuy Pantoja
 
FENTERMIN DOENSNT INCREASE HYPERTENSION
FENTERMIN DOENSNT INCREASE HYPERTENSIONFENTERMIN DOENSNT INCREASE HYPERTENSION
FENTERMIN DOENSNT INCREASE HYPERTENSIONRuy Pantoja
 
Doença cardiovascular
Doença cardiovascularDoença cardiovascular
Doença cardiovascularRuy Pantoja
 

More from Ruy Pantoja (20)

Dm e efeitos da canela
Dm e efeitos da canelaDm e efeitos da canela
Dm e efeitos da canela
 
Drug discovery
Drug discoveryDrug discovery
Drug discovery
 
Dieta hiperproteica para obeso com resistência à insulina
Dieta hiperproteica para obeso com resistência à insulinaDieta hiperproteica para obeso com resistência à insulina
Dieta hiperproteica para obeso com resistência à insulina
 
Ressecção parcial de pâncreas x regeneração x terapia incretínica humanos
Ressecção parcial de pâncreas x regeneração x terapia incretínica humanosRessecção parcial de pâncreas x regeneração x terapia incretínica humanos
Ressecção parcial de pâncreas x regeneração x terapia incretínica humanos
 
Brown adipose tissue
Brown adipose tissueBrown adipose tissue
Brown adipose tissue
 
Não somos quentes o suficiente ?
Não somos quentes o suficiente ?Não somos quentes o suficiente ?
Não somos quentes o suficiente ?
 
MACROPHAGE AND BROWN FAT
MACROPHAGE AND BROWN FATMACROPHAGE AND BROWN FAT
MACROPHAGE AND BROWN FAT
 
Proteinas 14 3-3 e insulina
Proteinas 14 3-3 e insulinaProteinas 14 3-3 e insulina
Proteinas 14 3-3 e insulina
 
Beta cell stress en dm2 b
Beta cell stress en dm2 bBeta cell stress en dm2 b
Beta cell stress en dm2 b
 
Beta cell stres in dm2 a
Beta cell stres in dm2 aBeta cell stres in dm2 a
Beta cell stres in dm2 a
 
Beta cell failure, stress and dm2
Beta cell failure, stress and dm2Beta cell failure, stress and dm2
Beta cell failure, stress and dm2
 
Dpp4 e angiogênese
Dpp4 e angiogêneseDpp4 e angiogênese
Dpp4 e angiogênese
 
DIABETES AND CANCER
DIABETES AND CANCERDIABETES AND CANCER
DIABETES AND CANCER
 
Glicemia e fat food ingestion
Glicemia e fat food ingestionGlicemia e fat food ingestion
Glicemia e fat food ingestion
 
Sitagliptina e proteção em ca diferenciado da tireóide.x
Sitagliptina e proteção em ca diferenciado da tireóide.xSitagliptina e proteção em ca diferenciado da tireóide.x
Sitagliptina e proteção em ca diferenciado da tireóide.x
 
Dpp4 i for the treatment of ACNE
Dpp4 i for the treatment of ACNEDpp4 i for the treatment of ACNE
Dpp4 i for the treatment of ACNE
 
GLP 1 E GIP: DIFERENÇAS E SEMELHANÇAS
GLP 1 E GIP: DIFERENÇAS E SEMELHANÇASGLP 1 E GIP: DIFERENÇAS E SEMELHANÇAS
GLP 1 E GIP: DIFERENÇAS E SEMELHANÇAS
 
To my colleagues from many parts of the world
To my colleagues from many parts of the worldTo my colleagues from many parts of the world
To my colleagues from many parts of the world
 
FENTERMIN DOENSNT INCREASE HYPERTENSION
FENTERMIN DOENSNT INCREASE HYPERTENSIONFENTERMIN DOENSNT INCREASE HYPERTENSION
FENTERMIN DOENSNT INCREASE HYPERTENSION
 
Doença cardiovascular
Doença cardiovascularDoença cardiovascular
Doença cardiovascular
 

Recently uploaded

Bangalore Call Girls Marathahalli 📞 9907093804 High Profile Service 100% Safe
Bangalore Call Girls Marathahalli 📞 9907093804 High Profile Service 100% SafeBangalore Call Girls Marathahalli 📞 9907093804 High Profile Service 100% Safe
Bangalore Call Girls Marathahalli 📞 9907093804 High Profile Service 100% Safenarwatsonia7
 
call girls in Connaught Place DELHI 🔝 >༒9540349809 🔝 genuine Escort Service ...
call girls in Connaught Place  DELHI 🔝 >༒9540349809 🔝 genuine Escort Service ...call girls in Connaught Place  DELHI 🔝 >༒9540349809 🔝 genuine Escort Service ...
call girls in Connaught Place DELHI 🔝 >༒9540349809 🔝 genuine Escort Service ...saminamagar
 
Call Girls Service in Bommanahalli - 7001305949 with real photos and phone nu...
Call Girls Service in Bommanahalli - 7001305949 with real photos and phone nu...Call Girls Service in Bommanahalli - 7001305949 with real photos and phone nu...
Call Girls Service in Bommanahalli - 7001305949 with real photos and phone nu...narwatsonia7
 
Call Girls Jp Nagar Just Call 7001305949 Top Class Call Girl Service Available
Call Girls Jp Nagar Just Call 7001305949 Top Class Call Girl Service AvailableCall Girls Jp Nagar Just Call 7001305949 Top Class Call Girl Service Available
Call Girls Jp Nagar Just Call 7001305949 Top Class Call Girl Service Availablenarwatsonia7
 
Russian Call Girl Brookfield - 7001305949 Escorts Service 50% Off with Cash O...
Russian Call Girl Brookfield - 7001305949 Escorts Service 50% Off with Cash O...Russian Call Girl Brookfield - 7001305949 Escorts Service 50% Off with Cash O...
Russian Call Girl Brookfield - 7001305949 Escorts Service 50% Off with Cash O...narwatsonia7
 
Russian Call Girls Chickpet - 7001305949 Booking and charges genuine rate for...
Russian Call Girls Chickpet - 7001305949 Booking and charges genuine rate for...Russian Call Girls Chickpet - 7001305949 Booking and charges genuine rate for...
Russian Call Girls Chickpet - 7001305949 Booking and charges genuine rate for...narwatsonia7
 
See the 2,456 pharmacies on the National E-Pharmacy Platform
See the 2,456 pharmacies on the National E-Pharmacy PlatformSee the 2,456 pharmacies on the National E-Pharmacy Platform
See the 2,456 pharmacies on the National E-Pharmacy PlatformKweku Zurek
 
Book Call Girls in Yelahanka - For 7001305949 Cheap & Best with original Photos
Book Call Girls in Yelahanka - For 7001305949 Cheap & Best with original PhotosBook Call Girls in Yelahanka - For 7001305949 Cheap & Best with original Photos
Book Call Girls in Yelahanka - For 7001305949 Cheap & Best with original Photosnarwatsonia7
 
Call Girls In Andheri East Call 9920874524 Book Hot And Sexy Girls
Call Girls In Andheri East Call 9920874524 Book Hot And Sexy GirlsCall Girls In Andheri East Call 9920874524 Book Hot And Sexy Girls
Call Girls In Andheri East Call 9920874524 Book Hot And Sexy Girlsnehamumbai
 
Call Girl Bangalore Nandini 7001305949 Independent Escort Service Bangalore
Call Girl Bangalore Nandini 7001305949 Independent Escort Service BangaloreCall Girl Bangalore Nandini 7001305949 Independent Escort Service Bangalore
Call Girl Bangalore Nandini 7001305949 Independent Escort Service Bangalorenarwatsonia7
 
College Call Girls Pune Mira 9907093804 Short 1500 Night 6000 Best call girls...
College Call Girls Pune Mira 9907093804 Short 1500 Night 6000 Best call girls...College Call Girls Pune Mira 9907093804 Short 1500 Night 6000 Best call girls...
College Call Girls Pune Mira 9907093804 Short 1500 Night 6000 Best call girls...Miss joya
 
Dwarka Sector 6 Call Girls ( 9873940964 ) Book Hot And Sexy Girls In A Few Cl...
Dwarka Sector 6 Call Girls ( 9873940964 ) Book Hot And Sexy Girls In A Few Cl...Dwarka Sector 6 Call Girls ( 9873940964 ) Book Hot And Sexy Girls In A Few Cl...
Dwarka Sector 6 Call Girls ( 9873940964 ) Book Hot And Sexy Girls In A Few Cl...rajnisinghkjn
 
Call Girls Hebbal Just Call 7001305949 Top Class Call Girl Service Available
Call Girls Hebbal Just Call 7001305949 Top Class Call Girl Service AvailableCall Girls Hebbal Just Call 7001305949 Top Class Call Girl Service Available
Call Girls Hebbal Just Call 7001305949 Top Class Call Girl Service Availablenarwatsonia7
 
Glomerular Filtration rate and its determinants.pptx
Glomerular Filtration rate and its determinants.pptxGlomerular Filtration rate and its determinants.pptx
Glomerular Filtration rate and its determinants.pptxDr.Nusrat Tariq
 
Call Girl Lucknow Mallika 7001305949 Independent Escort Service Lucknow
Call Girl Lucknow Mallika 7001305949 Independent Escort Service LucknowCall Girl Lucknow Mallika 7001305949 Independent Escort Service Lucknow
Call Girl Lucknow Mallika 7001305949 Independent Escort Service Lucknownarwatsonia7
 
Call Girls Whitefield Just Call 7001305949 Top Class Call Girl Service Available
Call Girls Whitefield Just Call 7001305949 Top Class Call Girl Service AvailableCall Girls Whitefield Just Call 7001305949 Top Class Call Girl Service Available
Call Girls Whitefield Just Call 7001305949 Top Class Call Girl Service Availablenarwatsonia7
 
Asthma Review - GINA guidelines summary 2024
Asthma Review - GINA guidelines summary 2024Asthma Review - GINA guidelines summary 2024
Asthma Review - GINA guidelines summary 2024Gabriel Guevara MD
 
call girls in green park DELHI 🔝 >༒9540349809 🔝 genuine Escort Service 🔝✔️✔️
call girls in green park  DELHI 🔝 >༒9540349809 🔝 genuine Escort Service 🔝✔️✔️call girls in green park  DELHI 🔝 >༒9540349809 🔝 genuine Escort Service 🔝✔️✔️
call girls in green park DELHI 🔝 >༒9540349809 🔝 genuine Escort Service 🔝✔️✔️saminamagar
 
Call Girls Hosur Just Call 7001305949 Top Class Call Girl Service Available
Call Girls Hosur Just Call 7001305949 Top Class Call Girl Service AvailableCall Girls Hosur Just Call 7001305949 Top Class Call Girl Service Available
Call Girls Hosur Just Call 7001305949 Top Class Call Girl Service Availablenarwatsonia7
 
Mumbai Call Girls Service 9910780858 Real Russian Girls Looking Models
Mumbai Call Girls Service 9910780858 Real Russian Girls Looking ModelsMumbai Call Girls Service 9910780858 Real Russian Girls Looking Models
Mumbai Call Girls Service 9910780858 Real Russian Girls Looking Modelssonalikaur4
 

Recently uploaded (20)

Bangalore Call Girls Marathahalli 📞 9907093804 High Profile Service 100% Safe
Bangalore Call Girls Marathahalli 📞 9907093804 High Profile Service 100% SafeBangalore Call Girls Marathahalli 📞 9907093804 High Profile Service 100% Safe
Bangalore Call Girls Marathahalli 📞 9907093804 High Profile Service 100% Safe
 
call girls in Connaught Place DELHI 🔝 >༒9540349809 🔝 genuine Escort Service ...
call girls in Connaught Place  DELHI 🔝 >༒9540349809 🔝 genuine Escort Service ...call girls in Connaught Place  DELHI 🔝 >༒9540349809 🔝 genuine Escort Service ...
call girls in Connaught Place DELHI 🔝 >༒9540349809 🔝 genuine Escort Service ...
 
Call Girls Service in Bommanahalli - 7001305949 with real photos and phone nu...
Call Girls Service in Bommanahalli - 7001305949 with real photos and phone nu...Call Girls Service in Bommanahalli - 7001305949 with real photos and phone nu...
Call Girls Service in Bommanahalli - 7001305949 with real photos and phone nu...
 
Call Girls Jp Nagar Just Call 7001305949 Top Class Call Girl Service Available
Call Girls Jp Nagar Just Call 7001305949 Top Class Call Girl Service AvailableCall Girls Jp Nagar Just Call 7001305949 Top Class Call Girl Service Available
Call Girls Jp Nagar Just Call 7001305949 Top Class Call Girl Service Available
 
Russian Call Girl Brookfield - 7001305949 Escorts Service 50% Off with Cash O...
Russian Call Girl Brookfield - 7001305949 Escorts Service 50% Off with Cash O...Russian Call Girl Brookfield - 7001305949 Escorts Service 50% Off with Cash O...
Russian Call Girl Brookfield - 7001305949 Escorts Service 50% Off with Cash O...
 
Russian Call Girls Chickpet - 7001305949 Booking and charges genuine rate for...
Russian Call Girls Chickpet - 7001305949 Booking and charges genuine rate for...Russian Call Girls Chickpet - 7001305949 Booking and charges genuine rate for...
Russian Call Girls Chickpet - 7001305949 Booking and charges genuine rate for...
 
See the 2,456 pharmacies on the National E-Pharmacy Platform
See the 2,456 pharmacies on the National E-Pharmacy PlatformSee the 2,456 pharmacies on the National E-Pharmacy Platform
See the 2,456 pharmacies on the National E-Pharmacy Platform
 
Book Call Girls in Yelahanka - For 7001305949 Cheap & Best with original Photos
Book Call Girls in Yelahanka - For 7001305949 Cheap & Best with original PhotosBook Call Girls in Yelahanka - For 7001305949 Cheap & Best with original Photos
Book Call Girls in Yelahanka - For 7001305949 Cheap & Best with original Photos
 
Call Girls In Andheri East Call 9920874524 Book Hot And Sexy Girls
Call Girls In Andheri East Call 9920874524 Book Hot And Sexy GirlsCall Girls In Andheri East Call 9920874524 Book Hot And Sexy Girls
Call Girls In Andheri East Call 9920874524 Book Hot And Sexy Girls
 
Call Girl Bangalore Nandini 7001305949 Independent Escort Service Bangalore
Call Girl Bangalore Nandini 7001305949 Independent Escort Service BangaloreCall Girl Bangalore Nandini 7001305949 Independent Escort Service Bangalore
Call Girl Bangalore Nandini 7001305949 Independent Escort Service Bangalore
 
College Call Girls Pune Mira 9907093804 Short 1500 Night 6000 Best call girls...
College Call Girls Pune Mira 9907093804 Short 1500 Night 6000 Best call girls...College Call Girls Pune Mira 9907093804 Short 1500 Night 6000 Best call girls...
College Call Girls Pune Mira 9907093804 Short 1500 Night 6000 Best call girls...
 
Dwarka Sector 6 Call Girls ( 9873940964 ) Book Hot And Sexy Girls In A Few Cl...
Dwarka Sector 6 Call Girls ( 9873940964 ) Book Hot And Sexy Girls In A Few Cl...Dwarka Sector 6 Call Girls ( 9873940964 ) Book Hot And Sexy Girls In A Few Cl...
Dwarka Sector 6 Call Girls ( 9873940964 ) Book Hot And Sexy Girls In A Few Cl...
 
Call Girls Hebbal Just Call 7001305949 Top Class Call Girl Service Available
Call Girls Hebbal Just Call 7001305949 Top Class Call Girl Service AvailableCall Girls Hebbal Just Call 7001305949 Top Class Call Girl Service Available
Call Girls Hebbal Just Call 7001305949 Top Class Call Girl Service Available
 
Glomerular Filtration rate and its determinants.pptx
Glomerular Filtration rate and its determinants.pptxGlomerular Filtration rate and its determinants.pptx
Glomerular Filtration rate and its determinants.pptx
 
Call Girl Lucknow Mallika 7001305949 Independent Escort Service Lucknow
Call Girl Lucknow Mallika 7001305949 Independent Escort Service LucknowCall Girl Lucknow Mallika 7001305949 Independent Escort Service Lucknow
Call Girl Lucknow Mallika 7001305949 Independent Escort Service Lucknow
 
Call Girls Whitefield Just Call 7001305949 Top Class Call Girl Service Available
Call Girls Whitefield Just Call 7001305949 Top Class Call Girl Service AvailableCall Girls Whitefield Just Call 7001305949 Top Class Call Girl Service Available
Call Girls Whitefield Just Call 7001305949 Top Class Call Girl Service Available
 
Asthma Review - GINA guidelines summary 2024
Asthma Review - GINA guidelines summary 2024Asthma Review - GINA guidelines summary 2024
Asthma Review - GINA guidelines summary 2024
 
call girls in green park DELHI 🔝 >༒9540349809 🔝 genuine Escort Service 🔝✔️✔️
call girls in green park  DELHI 🔝 >༒9540349809 🔝 genuine Escort Service 🔝✔️✔️call girls in green park  DELHI 🔝 >༒9540349809 🔝 genuine Escort Service 🔝✔️✔️
call girls in green park DELHI 🔝 >༒9540349809 🔝 genuine Escort Service 🔝✔️✔️
 
Call Girls Hosur Just Call 7001305949 Top Class Call Girl Service Available
Call Girls Hosur Just Call 7001305949 Top Class Call Girl Service AvailableCall Girls Hosur Just Call 7001305949 Top Class Call Girl Service Available
Call Girls Hosur Just Call 7001305949 Top Class Call Girl Service Available
 
Mumbai Call Girls Service 9910780858 Real Russian Girls Looking Models
Mumbai Call Girls Service 9910780858 Real Russian Girls Looking ModelsMumbai Call Girls Service 9910780858 Real Russian Girls Looking Models
Mumbai Call Girls Service 9910780858 Real Russian Girls Looking Models
 

Exetimibe melhora dm diminuindo nafld.x

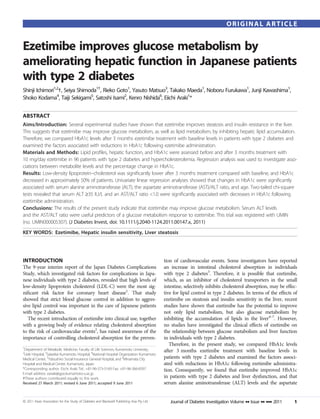
  • 1. ORIGINAL ARTICLE Ezetimibe improves glucose metabolism by ameliorating hepatic function in Japanese patients with type 2 diabetes Shinji Ichimori1,2†, Seiya Shimoda1†, Rieko Goto1, Yasuto Matsuo3, Takako Maeda1, Noboru Furukawa1, Junji Kawashima1, Shoko Kodama4, Taiji Sekigami5, Satoshi Isami2, Kenro Nishida6, Eiichi Araki1* ABSTRACT Aims/Introduction: Several experimental studies have shown that ezetimibe improves steatosis and insulin resistance in the liver. This suggests that ezetimibe may improve glucose metabolism, as well as lipid metabolism, by inhibiting hepatic lipid accumulation. Therefore, we compared HbA1c levels after 3 months ezetimibe treatment with baseline levels in patients with type 2 diabetes and examined the factors associated with reductions in HbA1c following ezetimibe administration. Materials and Methods: Lipid profiles, hepatic function, and HbA1c were assessed before and after 3 months treatment with 10 mg/day ezetimibe in 96 patients with type 2 diabetes and hypercholesterolemia. Regression analysis was used to investigate asso- ciations between metabolite levels and the percentage change in HbA1c. Results: Low-density lipoprotein–cholesterol was significantly lower after 3 months treatment compared with baseline, and HbA1c decreased in approximately 50% of patients. Univariate linear regression analyses showed that changes in HbA1c were significantly associated with serum alanine aminotransferase (ALT), the aspartate aminotransferase (AST)/ALT ratio, and age. Two-tailed chi-square tests revealed that serum ALT ‡35 IU/L and an AST/ALT ratio <1.0 were significantly associated with decreases in HbA1c following ezetimibe administration. Conclusions: The results of the present study indicate that ezetimibe may improve glucose metabolism. Serum ALT levels and the AST/ALT ratio were useful predictors of a glucose metabolism response to ezetimibe. This trial was registered with UMIN (no. UMIN000005307). (J Diabetes Invest, doi: 10.1111/j.2040-1124.2011.00147.x, 2011) KEY WORDS: Ezetimibe, Hepatic insulin sensitivity, Liver steatosis INTRODUCTION tion of cardiovascular events. Some investigators have reported The 9-year interim report of the Japan Diabetes Complications an increase in intestinal cholesterol absorption in individuals Study, which investigated risk factors for complications in Japa- with type 2 diabetes3. Therefore, it is possible that ezetimibe, nese individuals with type 2 diabetes, revealed that high levels of which, as an inhibitor of cholesterol transporters in the small low-density lipoprotein cholesterol (LDL-C) were the most sig- intestine, selectively inhibits cholesterol absorption, may be effec- nificant risk factor for coronary heart disease1. That study tive for lipid control in type 2 diabetes. In terms of the effects of showed that strict blood glucose control in addition to aggres- ezetimibe on steatosis and insulin sensitivity in the liver, recent sive lipid control was important in the care of Japanese patients studies have shown that ezetimibe has the potential to improve with type 2 diabetes. not only lipid metabolism, but also glucose metabolism by The recent introduction of ezetimibe into clinical use, together inhibiting the accumulation of lipids in the liver4–7. However, with a growing body of evidence relating cholesterol absorption no studies have investigated the clinical effects of ezetimibe on to the risk of cardiovascular events2, has raised awareness of the the relationship between glucose metabolism and liver function importance of controlling cholesterol absorption for the preven- in individuals with type 2 diabetes. Therefore, in the present study, we compared HbA1c levels 1 Department of Metabolic Medicine, Faculty of Life Sciences, Kumamoto University, after 3 months ezetimibe treatment with baseline levels in 2 Ueki Hospital, 3Saiseikai Kumamoto Hospital, 4National Hospital Organization Kumamoto Medical Center, 5Yatsushiro Social Insurance General Hospital, and 6Minamata City patients with type 2 diabetes and examined the factors associ- Hospital and Medical Center, Kumamoto, Japan ated with reductions in HbA1c following ezetimibe administra- *Corresponding author. Eiichi Araki Tel.: +81-96-373-5169 Fax: +81-96-366-8397 tion. Consequently, we found that ezetimibe improved HbA1c E-mail address: earaki@gpo.kumamoto-u.ac.jp †These authors contributed equally to this work. in patients with type 2 diabetes and liver dysfunction, and that Received 27 March 2011; revised 6 June 2011; accepted 9 June 2011 serum alanine aminotransferase (ALT) levels and the aspartate ª 2011 Asian Association for the Study of Diabetes and Blackwell Publishing Asia Pty Ltd Journal of Diabetes Investigation Volume •• Issue •• ••• 2011 1
  • 2. Ichimori et al. aminotransferase (AST)/ALT ratio at baseline are useful predic- Statistical Analysis tors for improvements in HbA1c. Data are expressed as the mean ± SD. Changes in clinical parameters following ezetimibe treatment were evaluated using MATERIALS AND METHODS paired t-tests. Differences in baseline clinical parameters between Subjects and Study Design subjects with and without a decrease in HbA1c were evaluated The study included 96 individuals with type 2 diabetes and using unpaired t-tests. Pearson’s product–moment correlation hypercholesterolemia (57 men and 39 women) who visited our coefficient analysis was used to determine the statistical signifi- medical institutions as outpatients. Patients were excluded cance of the regression line. Values of P < 0.05 were considered from the study if: they were using a new antidiabetic agent or a significant. Two-tailed chi-square tests were used to identify fac- new antihypertensive agent, or had changed doses and/or the tors associated with the glucose metabolism-improving effects of types of agents used, between 2 months prior to the study and ezetimibe and odds ratios (OR) were calculated by cross-tabula- the end of the study; their current or past alcohol intake was tion. Data analyses were performed using SPSS software version >20 g/day; or they had serological evidence of viral hepatitis, 11.5 for Windows (SPSS, Chicago, IL, USA). hemochromatosis, autoimmune liver disease, or non-alcoholic steatohepatitis (NASH). The diagnosis of NASH was based on RESULTS the following criteria8,9: (i) an intake of <20 g/day ethanol; The baseline characteristics for all subjects are given in Table 1. (ii) biopsy-proven steatohepatitis, steatosis, inflammatory infil- Sixty-two were on oral antidiabetic agents, whereas 12 were trates, and ballooning degeneration with or without Mallory receiving insulin therapy. In the present study, 11 subjects were bodies or pericellular/perivenular fibrosis; and (iii) appropriate treated with a statin and 32 were treated with a fibrate. exclusion of other liver diseases. Patients using statins or fibrates The clinical parameters of the subjects in the monotherapy, at a dose that did not change in the 3 months prior to the study statin, and fibrate groups before and after treatment are given in were eligible for inclusion. The subjects’ lifestyle, including diet, excise and habits, did not change during the study. All subjects Table 1 | Baseline characteristics of the subjects were informed of the objectives of the research and provided consent prior to participating in the study. The study was n (men/women) 96 (57/39) approved by the Ethics Committee of Kumamoto University Age (years) 61.5 ± 11.4 (approval no. 413). BMI (kg/m2) 25.5 ± 4.2 Following screening, subjects were divided into three groups LDL-C (mg/dL) 164 ± 36 and treated with ezetimibe alone (monotherapy group; n = 53), HDL-C (mg/dL) 55 ± 14 LDL/HDL ratio 3.2 ± 1.1 ezetimibe plus a statin (statin group; n = 11), or ezetimibe plus TG (mg/dL) 198 ± 117 a fibrate (fibrate group; n = 32). Ezetimibe was administered HbA1c (%) 6.7 ± 1.0 at a dose of 10 mg/day in all patients. Baseline values of AST (IU/L) 25 ± 13 LDL-C, high-density lipoprotein–cholesterol (HDL-C), the ALT (IU/L) 27 ± 19 LDL/HDL ratio, triglycerides (TG), serum AST, serum ALT, AST/ALT ratio 1.1 ± 0.4 serum c-glutamyltransferase (GGT), the AST/ALT ratio, and GGT (IU/L) 50 ± 53 HbA1c were compared with values after 3 months treatment. Antidiabetic therapy (n) Serum lipids and liver function were determined using enzy- Diet only 28 matic methods; LDL-C was measured directly using a homo- Sulfonylurea 39 geneous assay (Deteriner LDL-C; Kyowa Medex, Tokyo, a-Glucosidase inhibitor 19 Japan). HbA1c was measured by high-performance liquid Biguanide 18 Thiazolidine 18 chromatography. In the present study, according to the guide- Glinide 8 lines of the Japan Diabetes Society (JDS)10, the value for Insulin 12 HbA1c (%) was estimated as an NGSP equivalent value (%) Antihyperlipidemic therapy (n) calculated using the formula HbA1c (%) = HbA1c (JDS) Pravastatin 2 (%) + 0.4%, where HbA1c (NGSP) (%) = 1.019 · HbA1c Rosuvastatin 5 (JDS) (%) + 0.30. The coefficient of variation for measure- Atorvastatin 3 ments of HbA1c was 2–3%10. Pitavastatin 1 To identify predictors of reductions in HbA1c following eze- Bezafibrate 31 timibe administration, subjects were divided into groups accord- Fenofibrate 1 ing to whether HbA1c decreased during the 3-month study and Data are the mean ± SD or the number of subjects in each group, the clinical parameters at baseline were compared between as indicated. BMI, body massindex; LDL-C, low-density lipoprotein– groups. Pearson’s correlation coefficient analysis was used to cholesterol; HDL-C, high-densitylipoprotein–cholesterol; TG, triglycerides; determine univariate correlations between improvements in AST, aspartate aminotransferase; ALT, alanine aminotransferase; GGT, HbA1c and individual baseline characteristics. c-glutamyltransferase. 2 Journal of Diabetes Investigation Volume •• Issue •• ••• 2011 ª 2011 Asian Association for the Study of Diabetes and Blackwell Publishing Asia Pty Ltd
  • 3. Ezetimibe and glucose metabolism Table 2 | Effects of 3 months ezetimibe therapy on clinical parameters Ezetimibe Total (n = 96) Ezetimibe monotherapy (n = 53) + Statin (n = 11) + Fibrate (n = 32) Baseline After Baseline After Baseline After Baseline After 3 months 3 months 3 months 3 months Age (years) 61.8 ± 11.7 – 63.0 ± 12.5 – 60.6 ± 10.8 – 61.5 ± 11.4 – BMI (kg/m2) 24.9 ± 4.4 24.8 ± 4.3 26.7 ± 3.3 26.9 ± 3.2 26.1 ± 4.2 26.4 ± 4.3 25.5 ± 4.2 25.5 ± 4.2 LDL-C (mg/dL) 157 ± 38 128 ± 31** 165 ± 43 111 ± 40** 173 ± 27 139 ± 32** 164 ± 36 129 ± 33** HDL-C (mg/dL) 59 ± 15 57 ± 15 52 ± 11 51 ± 13 50 ± 10 53 ± 11 55 ± 14 55 ± 14 LDL/HDL ratio 2.9 ± 1.0 2.4 ± 0.8** 3.3 ± 1.2 2.3 ± 1.0** 3.6 ± 1.1 2.9 ± 0.9** 3.2 ± 1.1 2.5 ± 0.9** TG (mg/dL) 148 ± 74 140 ± 68 213 ± 93 143 ± 101* 276 ± 140 172 ± 97** 198 ± 117 152 ± 84** HbA1c (%) 6.8 ± 0.8 6.7 ± 0.9 7.2 ± 1.3 7.2 ± 1.4 6.5 ± 1.1 6.4 ± 0.9** 6.7 ± 1.0 6.7 ± 1.0 AST (IU/L) 23 ± 7.0 24 ± 9 20 ± 5 20 ± 8 31 ± 20 31 ± 15 25 ± 13 26 ± 12 ALT (IU/L) 24 ± 18 26 ± 22 23 ± 10 23 ± 12 33 ± 21 28 ± 16* 27 ± 19 26 ± 19 AST/ALT ratio 1.1 ± 0.3 1.1 ± 0.4 0.99 ± 0.34 0.94 ± 0.26 1.1 ± 0.60 1.2 ± 0.5 1.1 ± 0.4 1.1 ± 0.4 GGT (IU/L) 37 ± 37 40 ± 44 67 ± 90 62 ± 96 64 ± 56 56 ± 55 50 ± 53 49 ± 56 Data are the mean ± SD. *P < 0.05, **P < 0.01 compared with baseline (paired t-test). BMI, body mass index; LDL-C, low-density lipoprotein– cholesterol; HDL-C, high-density lipoprotein–cholesterol; TG, triglycerides; AST, aspartate aminotransferase; ALT, alanine aminotransferase; GGT, c-glutamyltransferase. Table 2. Although HDL-C did not change significantly, both whereas HbA1c, ALT, and GGT were significantly higher, in LDL-C and the LDL/HDL ratio decreased significantly in each the HbA1c responders than non-responders. group after 3 months treatment with ezetimibe. Specifically, Simple linear regression analyses including all individuals LDL-C decreased by 17.8% in the monotherapy group, by showed that baseline ALT was significantly correlated with 33.3% in the statin group, and by 20.3% in the fibrate group fol- the percentage change in HbA1c, calculated as (post-treatment lowing ezetimibe treatment. There was no significant change in value – baseline value) · 100/baseline value (r = –0.329; TG in the monotherapy group, but TG levels did decrease sig- P = 0.001; Figure 1a), as was the AST/ALT ratio (r = 0.306, nificantly in the statin and fibrate groups. Serum AST, ALT, P = 0.003; Figure 1b). A significant correlation was also noted and GGT levels did not increase significantly in any of the between the percentage change in serum ALT levels and per- groups, and a significant decrease in serum ALT levels was seen centage change in HbA1c (r = 0.307; P = 0.002; Figure 1c), as in the fibrate group. Although HbA1c decreased in 49% of the well as between the percentage change in the AST/ALT ratio entire cohort (n = 47), the decrease was only significant in the and the percentage change in HbA1c (r = –0.221; P = 0.03; fibrate group. Figure 1d). Table 4 lists the correlations between other para- Therefore, to investigate the characteristics of individuals in meters and the percentage change in HbA1c, as determined by whom HbA1c decreased after ezetimibe treatment, the sub- linear regression analysis. The percentage change in HbA1c was jects in each group were divided into two subgroups: either significantly correlated with age. responders (i.e. HbA1c decreased after 3 months treatment) or When the subjects were divided into groups on the basis of non-responders (i.e. HbA1c did not decrease after 3 months serum ALT levels (i.e. ‡35 and <35 IU/L, a criterion proposed treatment). We then compared the baseline characteristics for the screening of fatty liver disease in Japanese subjects11), between these subgroups. In those patients who responded HbA1c decreased in 75.0% of individuals with serum ALT to ezetimibe treatment, HbA1c decreased from 6.9 ± 0.8 to levels ‡35 IU/L (Figure 2a). Similarly, when the subjects were 6.5 ± 0.7% (P < 0.001) in the monotherapy group, from divided on the basis of the AST/ALT ratio (i.e. ‡1 and <1)12–15, 7.1 ± 1.3 to 6.6 ± 0.6% (P = 0.27) in the statin group, and from HbA1c decreased in 75.0% of those with an AST/ALT ratio <1 6.8 ± 1.1 to 6.5 ± 1.0% (P < 0.001) in the fibrate group. (Figure 2b). Comparisons of baseline parameters between the responders To identify factors associated with reductions in HbA1c fol- and non-responders within each treatment group are given in lowing ezetimibe treatment, we applied two-tailed chi-square Table 3. In the monotherapy group, age and the AST/ALT ratio tests to each parameter and calculated OR by cross-tabulation. were significantly lower <¼ while serum AST and ALT levels Serum ALT ‡35 IU/L (OR 4.125; 95% confidence interval [CI] were significantly higher, in HbA1c responders than in non- 1.36–12.51; P = 0.02; sensitivity 0.319; specificity 0.898) and an responders. In the statin group, HDL-C was significantly lower AST/ALT ratio <1 (OR 8.320; 95% CI 3.29–21.02; P < 0.001; in HbA1c responders than in non-responders. In the fibrate sensitivity 0.681, specificity 0.796) were significantly associated group, age and the AST/ALT ratio were significantly lower, reductions in HbA1c following 3 months ezetimibe treatment. ª 2011 Asian Association for the Study of Diabetes and Blackwell Publishing Asia Pty Ltd Journal of Diabetes Investigation Volume •• Issue •• ••• 2011 3
  • 4. 4 Table 3 | Comparisons of baseline clinical parameters between subjects with (+) or without ()) a decrease in HbA1c following 3 months treatment with ezetimibe Ezetimibe Total (n = 96) + Statin (n = 11) + Fibrate (n = 32) Ichimori et al. Ezetimibe monotherapy (n = 53) HbA1c HbA1c P-value HbA1c HbA1c P-value HbA1c HbA1c P-value HbA1c HbA1c P-value decrease (+) decrease ()) decrease (+) decrease ()) decrease (+) decrease ()) decrease (+) decrease ()) (n = 23) (n = 30) (n = 5) (n = 6) (n = 19) (n = 13) (n = 47) (n = 49) Age (years) 57.4 ± 12.1 65.2 ± 10.3 0.009 59.4 ± 12.5 66.0 ± 12.8 0.21 56.1 ± 10.0 67.2 ± 8.4 0.001 57.1 ± 11.1 65.8 ± 10.0 < 0.001 BMI (kg/m2) 25.1 ± 5.0 24.8 ± 4.0 0.39 28.1 ± 1.2 25.5 ± 4.1 0.10 26.3 ± 4.6 26.0 ± 3.8 0.41 25.9 ± 4.6 25.2 ± 3.9 0.20 LDL-C (mg/dL) 162 ± 26 157 ± 45 0.22 158 ± 48 170 ± 41 0.32 170 ± 27 179 ± 26 0.19 165 ± 29 162 ± 41 0.37 HDL-C (mg/dL) 58 ± 13 59 ± 17 0.40 44 ± 6 58 ± 10 0.01 51 ± 10 50 ± 9 0.37 54 ± 12 56 ± 15 0.17 LDL/HDL ratio 2.9 ± 0.8 2.8 ± 1.2 0.38 3.7 ± 1.3 3.0 ± 1.1 0.19 3.6 ± 1.2 3.8 ± 1.1 0.32 3.2 ± 1.0 3.1 ± 1.2 0.28 TG (mg/dL) 166 ± 77 135 ± 70 0.07 232 ± 100 198 ± 93 0.28 253 ± 129 309 ± 154 0.14 208 ± 110 189 ± 125 0.21 HbA1c (%) 6.9 ± 0.8 6.6 ± 0.9 0.17 7.1 ± 1.3 7.2 ± 1.3 0.44 6.8 ± 1.1 6.0 ± 0.8 0.01 6.9 ± 1.0 6.6 ± 1.0 0.049 AST (IU/L) 25 ± 8 21 ± 5 0.02 19 ± 5 20 ± 6 0.39 29 ± 10 34 ± 29 0.25 26 ± 9 24 ± 16 0.28 ALT (IU/L) 32 ± 25 19 ± 7 0.004 24 ± 12 22 ± 10 0.42 39 ± 20 25 ± 21 0.03 34 ± 22 21 ± 13 < 0.001 AST/ALT ratio 1.0 ± 0.4 1.2 ± 0.3 0.003 1.0 ± 0.4 1.0 ± 0.3 0.44 0.8 ± 0.2 1.6 ± 0.7 < 0.001 0.9 ± 0.3 1.3 ± 0.5 < 0.001 GGT (IU/L) 46 ± 53 30 ± 15 0.07 48 ± 30 86 ± 128 0.27 79 ± 64 44 ± 33 0.04 60 ± 57 40 ± 47 0.04 Data are the mean ± SD. BMI, body mass index; LDL-C, low-density lipoprotein–cholesterol; HDL-C, high-density lipoprotein–cholesterol; TG, triglycerides; AST, aspartate aminotransferase; Journal of Diabetes Investigation Volume •• Issue •• ••• 2011 ALT, alanine aminotransferase; GGT, c-glutamyltransferase. TG BMI AST Age GGT ΔHbA1c (%) LDL-C HDL-C HbA1c –30 –20 –10 0 10 20 30 –30 –20 –10 0 10 20 30 (c) (a) DLDL-C (%) LDL/HDL ratio DISCUSSION ΔALT (%) ALT (IU/L) r = 0.307 P = 0.002 P = 0.001 percentage changes in HbA1c r = –0.329 by several other studies16–18. –75 –50–25 0 25 50 75 100 r 0 20 40 60 80 100 120 140 –30 –20 –10 0 10 20 30 –30 –20 –10 0 10 20 30 (d) (b) 0.0448 )0.1991 )0.1225 )0.1968 )0.0373 )0.0171 )0.1422 0.2877 0.1211 0.0448 –50 –25 0 AST, aspartate aminotransferase; GGT, c-glutamyltransferase. serum ALT and (d) percentage changes in the AST/ALT ratio. P = 0.03 r = 0.306 AST/ALT ratio P = 0.003 r = –0.221 ΔAST/ALT ratio (%) tion analysis. BMI, body mass index; LDL-C, low-density lipoprotein– (a) serum alanine aminotransferase (ALT) at baseline, (b) the aspartate 0.66 0.06 0.23 0.06 0.72 0.87 0.24 0.66 0.18 25 50 75 aminotransferase (AST)/ALT ratio at baseline, (c) percentage changes in 0.005 0 0.5 1.0 1.5 2.0 2.5 3.0 3.5 Figure 1 | Correlations between the percentage change in HbA1c and cholesterol; HDL-C, high-density lipoprotein–cholesterol; TG, triglycerides; Correlations were determined using Pearson’s product–moment correla- In the present study, ezetimibe treatment improved HbA1c in to improving lipid profiles. These findings suggest that improve- ª 2011 Asian Association for the Study of Diabetes and Blackwell Publishing Asia Pty Ltd bly other risk factors, for diabetes. These findings are supported ments in lipid profiles could reduce insulin resistance, and possi- P-value patients with type 2 diabetes and liver dysfunction, in addition Table 4 | Correlations between baseline clinical characteristics and
  • 5. Ezetimibe and glucose metabolism (a) more readily in subjects with hepatic insulin resistance induced 45 45 by non-alcoholic fatty liver disease. According to a previous 40 40 study11, when subjects were analyzed according to age, the prev- 35 35 alence of fatty liver among 23,148 Japanese men was almost 30 30 unchanged in those aged between 30 and 60 years. Conversely, Subjects (n) 25 25 in 12,371 Japanese women, the prevalence of fatty liver 20 20 increased with age. However, some authors have reported that 15 15 fatty liver is more common in younger than older individu- 10 10 als19,20. Thus, the association between age and the prevalence of 5 5 fatty liver is contentious. Moreover, no studies have investigated 0 0 the correlation between age and the prevalence of fatty liver in d subjects with type 2 diabetes. It is possible that the prevalence of a se fatty liver in younger individuals was higher than in older indi- re <3 ec viduals in the present study. Although it was difficult to obtain 5 td ALT No reliable data regarding the duration of diabetes in these patients, c (IU ≥3 s ed A1 /L) 5 a Hb it may be possible that the duration of diabetes and diet therapy c re De was shorter in younger individuals than in older individuals. Future trials should investigate relationships between the preva- (b) lence of liver disease, the age of diabetic patients, and the dura- 45 45 tion of diabetes and diet therapy. Although it has been reported 40 40 that the incidence of steatosis generally increases with increases 35 35 in body mass index (BMI)11, the present study found no corre- 30 30 lation between BMI and decreases in HbA1c. This may have Subjects (n) 25 25 been because only 12.5% of the subjects in the present study 20 20 had a BMI ‡30 kg/m2, a level above which 80% of Japanese 15 15 individuals have liver steatosis11. 10 10 In the present study, HbA1c decreased significantly after 5 5 3 months treatment in the fibrate group, but not in the other 0 0 two groups, and 31 of the 32 subjects in the fibrate group were d being treated with bezafibrate. Because bezafibrate is a non- se specific agonist of peroxisome proliferator-activated receptor ea e cr <1 td (PPAR) a and actually activates all three PPAR subtypes (i.e. a, AS No c c, and d), bezafibrate may directly improve insulin sensitivity21 T/ALT d A1 rat ≥1 se Hb and alleviate liver steatosis22. Therefore, combination therapy io ea cr De with ezetimibe and bezafibrate may confer greater improve- Figure 2 | Distribution of subjects stratified according changes in ments in glucose metabolism. HbA1c and (a) serum alanine aminotransferase (ALT) at baseline or Certain limitations of the present study warrant consideration. (b) the aspartate aminotransferase (AST)/ALT ratio at baseline. First, because we did not measure markers of insulin sensitivity directly (e.g. using glucose clamp or the homeostasis model assessment of insulin resistance [HOMA-IR]) or free fatty acids On the basis of our results, markers of liver function and age (FFAs) in the present study, we cannot provide direct evidence differed significantly between HbA1c responders and non- that ezetimibe improves insulin sensitivity or FFA profiles. How- responders in the monotherapy and fibrate groups, but not in ever, it is not possible to routinely perform the glucose clamp in the statin group (which was comprised of a smaller number of clinical practice. In addition, HOMA-IR may not be a reliable subjects than the other two groups). We also found that method for determining insulin resistance in diabetic patients decreases in HbA1c were significantly correlated with serum treated with antidiabetic agents, particularly in those treated with ALT, the AST/ALT ratio, and age in the entire cohort. Subjects insulin. Second, we did not perform ultrasound echography, with ALT levels ‡35 IU/L and those with an AST/ALT ratio <1 computed tomography, or liver biopsy to evaluate the progres- experienced significant reductions in HbA1c from 6.5 ± 1.0 to sion of liver steatosis. However, because 43.8% of subjects 6.3 ± 0.8% (P = 0.001) and from 6.9 ± 1.0 to 6.6 ± 1.0% (n = 42) in the present study had an AST/ALT ratio <1, it is (P < 0.001), respectively. These findings suggest that improve- likely that most had liver steatosis. ments in hepatic insulin sensitivity as a result of suppressed In conclusion, some of the subjects in the present study expe- hepatic fat accumulation may underlie the improvements in rienced improvements in HbA1c following 3 months treatment HbA1c conferred by ezetimibe. This improvement may occur with ezetimibe. Serum ALT levels and the AST/ALT ratio were ª 2011 Asian Association for the Study of Diabetes and Blackwell Publishing Asia Pty Ltd Journal of Diabetes Investigation Volume •• Issue •• ••• 2011 5
  • 6. Ichimori et al. both predictive factors of the glucose metabolism response to 10. Seino Y, Nanjo K, Tajima N, et al. Report of the Committee ezetimibe, which appeared to reflect improvements in hepatic on the Classification and Diagnostic Criteria of Diabetes insulin sensitivity conferred by ezetimibe. Therefore, ezetimibe Mellitus. The Committee of the Japan Diabetes Society on may not only improve lipid metabolism, but also liver steatosis the Diagnostic Criteria of Diabetes Mellitus. Diabetol Int 2010; and glucose metabolism in type 2 diabetic patients with steato- 1: 2–20. sis, as indicated by serum ALT levels ‡35 IU/L or an AST/ALT 11. Kojima S, Watanabe N, Numata M, et al. Increase in the prev- ratio <1. alence of fatty liver in Japan over the past 12 years: analysis of clinical background. J Gastroenterol 2003; 38: 954–961. ACKNOWLEDGEMENT 12. Neuschwander-Tetri BA, Bacon BR. Nonalcoholic steatohepa- The authors thank to Dr Fumihiko Sakamoto (Tenjin Clinic, titis. Med Clin North Am 1996; 80: 1147–1166. Kumamoto, Japan) for his assistance with patient referral to the 13. Pinto HC, Baptista A, Camilo ME, et al. Nonalcoholic steato- present study. The authors declare no potential conflicts of hepatitis. Clinicopathological comparison with alcoholic interest relevant to this article. hepatitis in ambulatory and hospitalized patients. Dig Dis Sci 1996; 41: 172–179. REFERENCES 14. Sorbi D, Boynton J, Lindor KD. The ratio of aspartate amino- 1. Sone H, Tanaka S, Iimuro S, et al. Long-term lifestyle inter- transferase to alanine aminotransferase: potential value in vention lowers the incidence of stroke in Japanese patients differentiating nonalcoholic steatohepatitis from alcoholic with type 2 diabetes: a nationwide multicentre randomised liver disease. Am J Gastroenterol 1999; 94: 1018–1022. controlled trial (the Japan Diabetes Complications Study). 15. Wallerstedt S, Olsson R, Waldenstro J. The diagnostic signif- ¨m Diabetologia 2010; 53: 419–428. icance of a high ASAT–ALAT (GOT–GPT) ratio in patients 2. Strandberg TE, Tilvis RS, Pitkala KH, et al. Cholesterol and glu- with very high serum aminotransferase levels. Acta Med cose metabolism and recurrent cardiovascular events among Scand 1974; 195: 227–229. the elderly: a prospective study. J Am Coll Cardiol 2006; 48: 16. Bajaj M, Suraamornkul S, Kashyap S, et al. Sustained reduc- 708–714. tion in plasma free fatty acid concentration improves insulin 3. Lally S, Tan CY, Owens D, et al. mRNA levels of genes action without altering plasma adipocytokine levels in involved in dysregulation of postprandial lipoproteins in type subjects with strong family history of type 2 diabetes. J Clin 2 diabetes: the role of Niemann Pick C1-like 1, ABCG5 and Endocrinol Metab 2004; 89: 4649–4655. G8 and microsomal triglyceride transfer protein. Diabetologia 17. Santomauro AT, Boden G, Silva ME, et al. Overnight lowering 2006; 49: 1008–1016. of free fatty acids with Acipimox improves insulin resistance 4. Davies JP, Scott C, Oishi K, et al. Inactivation of NPC1L1 and glucose tolerance in obese diabetic and nondiabetic causes multiple lipid transport defects and protects against subjects. Diabetes 1999; 48: 1836–1841. diet-induced hypercholesterolemia. J Biol Chem 2005; 280: 18. Gu ¨ F, Ozmen B, Hekimsoy Z, et al. Effects of a statin ¨çlu 12710–12720. group drug, pravastatin, on the insulin resistance in patients 5. Deushi M, Nomura M, Kawakami A, et al. Ezetimibe improves with metabolic syndrome. Biomed Pharmacother 2004; 58: liver steatosis and insulin resistance in obese rat model of 614–618. metabolic syndrome. FEBS Lett 2007; 581: 5664–5670. 19. Yamada T, Fukatsu M, Suzuki S, et al. Fatty liver predicts 6. Muraoka T, Aoki K, Iwasaki T, et al. Ezetimibe decreases impaired fasting glucose and type 2 diabetes mellitus in SREBP-1c expression in liver and reverses hepatic insulin Japanese undergoing a health checkup. J Gastroenterol resistance in mice fed a high-fat diet. Metabolism 2010; 60: Hepatol 2010; 25: 352–356. 617–628. 20. Lonardo A, Lombardini S, Scaglioni F, et al. Fatty liver, carotid 7. Nozaki Y, Fujita K, Yoneda M, et al. Long-term combination disease and gallstones: a study of age-related. World J therapy of ezetimibe and acarbose for non-alcoholic fatty Gastroenterol 2006; 12: 5826–5833. liver disease. J Hepatol 2009; 51: 548–556. 21. Tenenbaum T, Fisman EZ, Boyko V, et al. Attenuation of 8. Neuschwander-Tetri BA, Caldwell SH. Nonalcoholic steato- progression of insulin resistance in patients with coronary hepatitis: summary of an AASLD Single Topic Conference. artery disease by bezafibrate. Arch Intern Med 2006; 166: Hepatology 2003; 37: 1202–1219. 737–741. 9. American Gastroenterological Association. American 22. Inoue I, Noji S, Awata T, et al. Bezafibrate has an antioxidant Gastroenterological Association medical position statement: effect: peroxisome proliferator-activated receptor alpha is nonalcoholic fatty liver disease. Gastroenterology 2002; 123: associated with Cu2+, Zn2+-superoxide dismutase in the liver. 1702–1704. Life Sci 1998; 63: 135–144. 6 Journal of Diabetes Investigation Volume •• Issue •• ••• 2011 ª 2011 Asian Association for the Study of Diabetes and Blackwell Publishing Asia Pty Ltd