1. 5
factsheet
Key • female • male
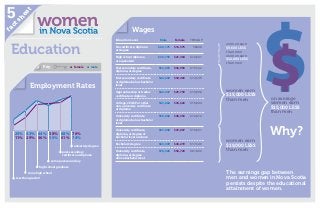
Wages
Education
Education Level Male Female THE GAP
No certificate, diploma
or degree
$ 26,175 $16,575 $9600
High school diploma
or equivalent
$ 33,735 $21,404 $12,331
Postsecondary certificate,
diploma, or degree
$52,065 $36,903 $15,162
Postsecondary certificate
or diploma below bachelor
level
$44,602 $30,463 $14,139
Apprenticeship or trades
certificate or diploma
$42,337 $25,739 $16,598
College, CEGEP or other
non-university certificate
or diploma
$45,664 $30,620 $15,044
University certificate
or diploma below bachelor
level
$50,666 $38,353 $12,313
University certificate,
diploma, or degree at
bachelor level or above
$67,068 $47,837 $19,231
Bachelor’s degree $60,339 $43,219 $17,120
University certificate,
diploma, or degree
above bachelor level
$78,326 $56,720 $21,606
Employment Rates
university degree
post-secondary
certificate or diploma
some post-secondary
high school graduate
some high school
less than grade 9
68%58%64%43%25% 76%
61%55%56%29%11% 74%
The earnings gap between
men and women in Nova Scotia
persists despite the educational
attainment of women.
on average
women earn
$15,000 LESS
than men
women earn
$15,000 LESS
than men
women earn
$9,600 LESS
than men
women earn
$12,000 LESS
than men
women earn
$19,000 LESS
than men
Why?
2. 29+42+26+381917
2082
1299
1443
20+9+19+7348423
9421014
3,000
4,000
5,000
1,000
2,000
Postsecondary
full-time enrolments
Women enrolled in mathematics, computer,
and information sciences programs made up
only 1% of all women enrolled in full-time
post-secondary programs.
• female
• male
3465
69+12+83+17843
603
4158
2005/2006 2005/20062010/2011 2010/2011 2005/2006 2010/2011
Physical and
Life Sciences and
Technology
Mathematics,
Computer, and
Information Sciences
Architecture,
Engineering, and
related Technologies
Immigrant women
Immigrant and
Aboriginal women
Aboriginal women
Non-immigrant
(a person who is a
Canadian citizen by birth)
24%
27%
87%
85% 82% 70%
22%
13%
15% 18%
30%
9%
5%
Non-Aboriginal Off Reserve On-Reserve
26%
25%
22%
27%
23%
19%
16%
24%
17%
SOURCES
Employment rates: Statistics Canada.
Table282-0004 - Labour force survey estimates
(2008-2012)
Wages: Statistics Canada, NHS (99-014-X2011040)
Postsecondary enrolments: Statistics Canada.
Table 477-0019
A University – bachelor level or above
A University – below bachelor
A College / CEGEP
A Apprenticeship or trades
A High school diploma
A No certificate, diploma or degree
Statistics current as of November, 2013 .
Immigrated
2006-2011
94%
4%
8%
14%
15%
53%
6%
Immigrant
94%
6%
7%
18%
18%
45%
6%
7% 8% 7%
5%
5% 6%