Evaluating Single Group Visits to The Noguchi Museum
•Als PPTX, PDF herunterladen•
1 gefällt mir•243 views

This was a presentation for the Mid-Atlantic Association of Museums conference in 2012.

Empfohlen
Empfohlen
Weitere ähnliche Inhalte
Was ist angesagt?
Was ist angesagt? (18)
Ähnlich wie Evaluating Single Group Visits to The Noguchi Museum
Ähnlich wie Evaluating Single Group Visits to The Noguchi Museum (20)
Kürzlich hochgeladen
Kürzlich hochgeladen (20)
Evaluating Single Group Visits to The Noguchi Museum
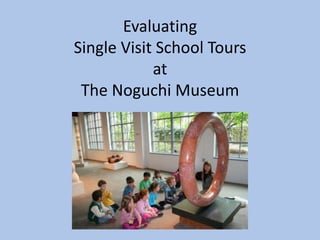
- 1. Evaluating Single Visit School Tours at The Noguchi Museum
- 2. The Process
- 4. If at first you don’t succeed…
- 5. Our Challenges: •What data is objective? •What do we really want to know? •Who collects data? •What will we do with the data? How will it be useful?
- 6. The Findings
- 8. What scored highest: •Tour guides began by explicitly asking students to look at the work and share what they notice •Tour guide modeled looking closely •Tour guide asked “what makes you say that •Tour guide demonstrated that she or he heard and understood what the students were saying •Student comments were specific to the work of art
- 9. What scored lowest: •Tour guides ask open-ended questions •Tour guides challenge students to think interpretively •Tour guides offer students the opportunity to make personal connections •Tour guides wait for responses from at least 4 students •Students focused on the work / were not distracted
- 10. The Implications
- 11. HIGHEST SCORING INDICATORS CONGRATULATE THE EDUCATORS & SHARE WITH DEVELOPMENT DEPARTMENT LOWEST SCORING INDICATORS OPPORTUNITY FOR REFLECTION & INSPIRATION FOR PROFESSIONAL DEVELOPMENT WHAT ARE WE STILL CURIOUS ABOUT? HOW DO WE FIND OUT?
- 12. LOWEST SCORING INDICATORS OPPORTUNITY FOR REFLECTION & INSPIRATION FOR PROFESSIONAL DEVELOPMENT 1. Tour guides offer students the opportunity to make personal connections 2. Students focused on the work / were not distracted
- 13. WHAT ARE WE STILL CURIOUS ABOUT? HOW DO WE FIND OUT? Tour guides challenge students to think interpretively •What does this mean? •What is a “good” interpretation?
Hinweis der Redaktion
- This presentation tells the story of the design and implementation of an in-house system to evaluate school tours. The goal was to create a useful and accurate tool that could be used by educators and administrators.
- My evaluation experience told me I needed to be specific and quantitative, as well as careful about what I measured. Noting that students were “engaged” was too vague to be accurately evaluated by an observer or participant.
- We went through multiple iterations of the data collection tool – about 4. We started with three categories: careful observation, interpretation, and understanding that there are multiple interpretations of a work of art. Ultimately, we jettisoned the categories to focus on more specific indicators, because some were redundant, and some didn’t seem to tell us anything. The only way we figured this out was by testing the instrument while watching a tour – could we more or less objectively use to capture data on what was happening in the tour? Were these questions interesting?
- We had to solve three challenges to implement the evaluation. As mentioned in the previous slide, first we had to determine what data we could collect that would be useful and objective. We decided to focus on two areas of student learning: looking closely, and understanding that it is possible to have multiple correct interpretations of a work of art. Then we needed to decide what to do with the data – data on a piece of paper in a drawer is of little use. We coded in an excel document, which allowed us to look at averages. We then mostly worked from these averages: on average, what scored highest? What lowest? We collected data from teachers, educators, and volunteers all using a similar form. The most productive method for collecting data proved to be volunteers, as they were not busy teaching or managing the group during the tour. This does not negate the importance of educator and teacher feedback, but their feedback serves different objectives.
- All of our indicatorsscored on thehigh end – all averages were at least a 3 on a 4 point scale. Also, tour guide and educator feedback were fairly closely aligned.
- Here you can see what scored highest. This indicated to us that the Noguchi Museum’s educators are really attentive to the art and to the students.
- Here you can see what scored lowest. This is really useful information. It is worth seriously considering what’s lowest, even if lowest is pretty high – this is where evaluation can help us refine our practice. We looked at each area in which we scored on the lower end – why did it score low, and what can/should we do about it?
- High scoring indicators are great. We all love positive feedback.Lower scoring indicators are useful. This is how we figure out where we can push our practice.And while considering both sets of indicators, we thoughts about what new questions emerged during this evaluation. What were we still curious about? What are the next steps for us in this pursuit?
- One area in which we scored lower was in offering students the opportunity to make personal connections. This led us to great conversations about what we meant by personal connections. What types of connections are personal? Why must students make “personal” connections? How do you balance the group and the individual? Perhaps it would be better to just look at connection-making? How are we doing with connection making more generally?A second area that scored low was student distraction. But, we noted, distraction in the galleries might indicate interest. How do we mine this interest in the larger gallery setting? How can we incorporate more of this looking around into the tours?
- While pleased with our findings, we were struck by the fact that we had not been able to evaluate the interpretations themselves. What is interpretation? What encourages students to interpret – is it explicit challenges to think interpretively? Or something more internal? This is a rich area for collaborative research and evaluation, and great discussions.