SlideShare ist ein Scribd-Unternehmen logo
1 von 11
Prepared by: Svetlana Stolyarova, Local-n-Global Realty
                Analysis of the time period between January 10th 2010 to July 15th 2010
                                  Absorption Rate Analysis of Solon, OH

                               Solon Market Absorbtion
120

100

 80

                                                                                      Column C
 60
                                                                                      Column D
                                                                                      Column E
 40
                                                                                      Column F

 20

  0
  $0- $99,999
                       $300,000 - $349,999
                                                $700,000 - $799,999

       Price Range                Units Sold       Units Sold         Units on   Months Supply
                                                                a                         Past 6
      $0- $99,999 per month
       Months                        Market
                                        3              0.5               6            12.0
      $100,000 - $149,999              11              1.8              16             8.7
      $150,000 - $199,999              23              3.8              47            12.3
      $200,000 - $249,999              10              1.7              43            25.8
      $250,000 - $299,999              16              2.7              26             9.8
      $300,000 - $349,999               8              1.3              17            12.8
      $350,000 - $399,999               3              0.5              12            24.0
      $400,000 - $499,999              11              1.8              28            15.3
      $500,000 - $599,999               7              1.2              15           12.86
      $600,000 - $699,999               5              0.8              15            18.0
      $700,000 - $799,999               1              0.2              18            108
      $800,000 - $999,999               1              0.2               6             36
      $1,000,000 - over                 1              0.2               5             30
0.0
                                                 5.0
                                                       10.0
                                                              15.0
                                                                     20.0
                                                                            25.0
                                                                                   30.0
                 $0
                      -$
                           99
                                ,9
                                   9   9
$1
     50
          ,0
             0   0
                     -$
                          19
                               9,
                                 99
                                       9
$2
     50
          ,0
             0   0
                     -$
                          29
                               9,
                                 99
                                       9
$3
     50
          ,0
             0   0
                     -$
                                                                                          Months Supply


                          39
                               9,
                                 99
                                      9
                                                   Column F
Prepared by: Svetlana Stolyarova, Local-n-Global Realty
               Analysis of the time period between April 2nd 2009 to April 1st 2010
                          Absorption Rate Analysis of Shaker Heights, OH
                                          Rochester area
                                        Months Supply
 30.0
 25.0
 20.0
 15.0
 10.0
                                                                                            Column F
  5.0
  0.0


                                                     9
          9


                                9


                                                                           9
           9


                              99


                                                   99


                                                                        99
        ,9


                            9,


                                                 9,


                                                                      9,
    99


                           19


                                                29


                                                                      39
   -$


                       -$


                                            -$


                                                                  -$
 $0


                                            0
                       0


                                                                 0
                      0


                                           0


                                                                  0
                                        ,0
                   ,0


                                                               ,0
                                       50
                  50


                                                          50
                                     $2
                $1


                                                         $3


 Price Range                        Units Sold       Units Sold            Units on   Months Supply
                                                                       a                        Past
$1 - $199,999 month
 Year      per                     Market
                                    28                   2.3                    9             3.9
$200,000 - $249,999                  7                   0.6                   11            18.9
$250,000 - $299,999                  5                   0.4                   10            24.0
$300,000 - $349,999                  7                   0.6                   13            22.3
$350,000 - $499,999                  6                   0.5                   10            20.0
$500,000 - $999,999                  4                   0.3                    9            27.0
ty


Column F


s Supply
     Past
Prepared by: Svetlana Stolyarova, Local-n-Global Realty
                                         Analysis of the time period between June 30, 2009 to June 29, 2010
                                                      Absorption Rate Analysis of Seven Hills, OH
                                                                    Rochester area
                                                           Seven Hills
                  40

                  35

                  30

                  25
Number of units


                                                                                                6 17 28 38 11 11 9
                  20
                                                                                                2 7 18 33 23 16 19
                  15                                                                            0.5 1.4 2.3 3.2 0.9
                                                                                                0.9 0.8
                  10

                   5

                   0
                                     $125,000 - $149,999             $250,000 - $299,999
                       0 - $99,999                   $175,000 - $199,999
                                                  Price range


                               Price Range        Units Sold     Units Sold     Units on     Months Supply
                                                                   a                        Past 12 Months        per
                  month         Market
                         $1 - $24,999                     2               0.2               1               6.0
                         0 - $99,999                      6               0.5               2               4.0
                         $100,000 - $124,999             17               1.4               7               4.9
                         $125,000 - $149,999             28               2.3              18               7.7
                         $150,000 - $174,999             38               3.2              33              10.4
                         $175,000 - $199,999             11               0.9              23              25.1
                         $200,000 - $249,999             11               0.9              16              17.5
                         $250,000 - $299,999              9               0.8              19              25.3
Prepared by: Svetlana Stolyarova, Local-n-Global Realty
                             Analysis of the time period between April 2nd 2009 to April 1st 2010
                                          Absorption Rate Analysis of South Euclid, OH
                                                         Rochester area
                                                          South Euclid
                  140

                  120

                  100
Number of units


                   80
                                                                                                            Column C
                   60                                                                                       Column D
                                                                                                            Column E
                   40

                   20

                     0
                                   $25,000 - $49,999       $75,000 - $99,999      $125,000 - $149,999
                         $1 - $24,999          $50,000 - $74,999      $100,000 - $124,999
                                                      Price range

                  Price Range                Units Sold          Units Sold      Units on           Months Supply
                                                                          a                            Past 6 Months
                  per month
             $1 - $24,999        Market           2                 0.2                  1                   6.0
             $25,000 - $49,999                   55                 4.6                  6                   1.3
             $50,000 - $74,999                   41                 3.4                 31                   9.1
             $75,000 - $99,999                   56                 4.7                 86                  18.4
             $100,000 - $124,999                 29                 2.4                123                  50.9
             $125,000 - $149,999                 21                 1.8                 39                  22.3
olumn C
olumn D
olumn E

Weitere ähnliche Inhalte

Was ist angesagt?

Heesen san diego venture group - 2012-01-24
Heesen   san diego venture group - 2012-01-24Heesen   san diego venture group - 2012-01-24
Heesen san diego venture group - 2012-01-24San Diego Venture Group
 
Sustainable Organisations: Can businesses solve social and environmental issu...
Sustainable Organisations: Can businesses solve social and environmental issu...Sustainable Organisations: Can businesses solve social and environmental issu...
Sustainable Organisations: Can businesses solve social and environmental issu...London Business School
 
Greensboro Housing Report 2010.1
Greensboro Housing Report 2010.1Greensboro Housing Report 2010.1
Greensboro Housing Report 2010.1trbproperties
 
Loopnet Q4 2009 Insight Report 1 16 09
Loopnet Q4 2009 Insight Report 1 16 09Loopnet Q4 2009 Insight Report 1 16 09
Loopnet Q4 2009 Insight Report 1 16 09aporrazzo
 
20 years in the life of a small tertiary education system: Attaining and sust...
20 years in the life of a small tertiary education system: Attaining and sust...20 years in the life of a small tertiary education system: Attaining and sust...
20 years in the life of a small tertiary education system: Attaining and sust...EduSkills OECD
 
Texas Market O Verview Kdh
Texas Market O Verview KdhTexas Market O Verview Kdh
Texas Market O Verview KdhBob Lowery
 
A Cheaper Hospital In Five Days
A Cheaper Hospital In Five DaysA Cheaper Hospital In Five Days
A Cheaper Hospital In Five DaysJay Arthur
 
Citrix - Alternative For Server Virtualistion
Citrix - Alternative For Server VirtualistionCitrix - Alternative For Server Virtualistion
Citrix - Alternative For Server Virtualistiondataplex systems limited
 
Simulación de Proyectos
Simulación de ProyectosSimulación de Proyectos
Simulación de ProyectosOscar Granda
 
Chicagoland Monthly Maket Pulse -Feb 2010 Attached
Chicagoland Monthly Maket Pulse -Feb 2010 AttachedChicagoland Monthly Maket Pulse -Feb 2010 Attached
Chicagoland Monthly Maket Pulse -Feb 2010 Attachedchipwags
 
Toronto EAST Real Estate statistics september 2011
Toronto EAST Real Estate statistics september 2011Toronto EAST Real Estate statistics september 2011
Toronto EAST Real Estate statistics september 2011John Helfrich
 
March 2013 Sold Data for The Woodlands
March 2013 Sold Data for The WoodlandsMarch 2013 Sold Data for The Woodlands
March 2013 Sold Data for The WoodlandsReferred Realty Group
 
Mafia Wars Expense Guide
Mafia Wars Expense GuideMafia Wars Expense Guide
Mafia Wars Expense Guideguest26cede
 

Was ist angesagt? (20)

Heesen san diego venture group - 2012-01-24
Heesen   san diego venture group - 2012-01-24Heesen   san diego venture group - 2012-01-24
Heesen san diego venture group - 2012-01-24
 
Mris3rdquarter2009
Mris3rdquarter2009Mris3rdquarter2009
Mris3rdquarter2009
 
Lunchbox Economics
Lunchbox EconomicsLunchbox Economics
Lunchbox Economics
 
Sustainable Organisations: Can businesses solve social and environmental issu...
Sustainable Organisations: Can businesses solve social and environmental issu...Sustainable Organisations: Can businesses solve social and environmental issu...
Sustainable Organisations: Can businesses solve social and environmental issu...
 
Junk food final 1
Junk food final 1Junk food final 1
Junk food final 1
 
Greensboro Housing Report 2010.1
Greensboro Housing Report 2010.1Greensboro Housing Report 2010.1
Greensboro Housing Report 2010.1
 
Loopnet Q4 2009 Insight Report 1 16 09
Loopnet Q4 2009 Insight Report 1 16 09Loopnet Q4 2009 Insight Report 1 16 09
Loopnet Q4 2009 Insight Report 1 16 09
 
20 years in the life of a small tertiary education system: Attaining and sust...
20 years in the life of a small tertiary education system: Attaining and sust...20 years in the life of a small tertiary education system: Attaining and sust...
20 years in the life of a small tertiary education system: Attaining and sust...
 
Texas Market O Verview Kdh
Texas Market O Verview KdhTexas Market O Verview Kdh
Texas Market O Verview Kdh
 
A Cheaper Hospital In Five Days
A Cheaper Hospital In Five DaysA Cheaper Hospital In Five Days
A Cheaper Hospital In Five Days
 
Citrix - Alternative For Server Virtualistion
Citrix - Alternative For Server VirtualistionCitrix - Alternative For Server Virtualistion
Citrix - Alternative For Server Virtualistion
 
Simulación de Proyectos
Simulación de ProyectosSimulación de Proyectos
Simulación de Proyectos
 
Chicagoland Monthly Maket Pulse -Feb 2010 Attached
Chicagoland Monthly Maket Pulse -Feb 2010 AttachedChicagoland Monthly Maket Pulse -Feb 2010 Attached
Chicagoland Monthly Maket Pulse -Feb 2010 Attached
 
Toronto EAST Real Estate statistics september 2011
Toronto EAST Real Estate statistics september 2011Toronto EAST Real Estate statistics september 2011
Toronto EAST Real Estate statistics september 2011
 
Berrett-Koehler Publishers - New Book P&L
Berrett-Koehler Publishers - New Book P&LBerrett-Koehler Publishers - New Book P&L
Berrett-Koehler Publishers - New Book P&L
 
TorontoMLS® residential statistics - Central Toronto
TorontoMLS® residential statistics - Central TorontoTorontoMLS® residential statistics - Central Toronto
TorontoMLS® residential statistics - Central Toronto
 
Toronto Market Watch East
Toronto Market Watch EastToronto Market Watch East
Toronto Market Watch East
 
Tmo Feb
Tmo FebTmo Feb
Tmo Feb
 
March 2013 Sold Data for The Woodlands
March 2013 Sold Data for The WoodlandsMarch 2013 Sold Data for The Woodlands
March 2013 Sold Data for The Woodlands
 
Mafia Wars Expense Guide
Mafia Wars Expense GuideMafia Wars Expense Guide
Mafia Wars Expense Guide
 

Andere mochten auch

Andere mochten auch (7)

About Allegra Print & Imaging
About Allegra Print & ImagingAbout Allegra Print & Imaging
About Allegra Print & Imaging
 
5 L Gibbons
5 L Gibbons5 L Gibbons
5 L Gibbons
 
NetBox 2014
NetBox 2014NetBox 2014
NetBox 2014
 
Photo parsa album 611
Photo parsa album 611Photo parsa album 611
Photo parsa album 611
 
Photo parsa album 610
Photo parsa album 610Photo parsa album 610
Photo parsa album 610
 
Marta dhe Maria
Marta dhe MariaMarta dhe Maria
Marta dhe Maria
 
Luka 8 - Shembelltyra e mbjellesit
Luka 8 - Shembelltyra e mbjellesitLuka 8 - Shembelltyra e mbjellesit
Luka 8 - Shembelltyra e mbjellesit
 

Ähnlich wie Solon OH Real Estate Market. How many months needed to sell existing inventory of homes for sale

H W 2011 10 At
H W 2011 10 AtH W 2011 10 At
H W 2011 10 Atchipwags
 
August 2011 Market Pulse - Detached Homes
August 2011 Market Pulse - Detached HomesAugust 2011 Market Pulse - Detached Homes
August 2011 Market Pulse - Detached Homeschipwags
 
August 2011 Market Pulse - Attached Homes
August 2011 Market Pulse - Attached HomesAugust 2011 Market Pulse - Attached Homes
August 2011 Market Pulse - Attached Homeschipwags
 
H W 2010 07 At
H W 2010 07 AtH W 2010 07 At
H W 2010 07 Atchipwags
 
H W 2010 01 At
H W 2010 01 AtH W 2010 01 At
H W 2010 01 Atchipwags
 
Northern Virginia Fairfax County Housing Market
Northern Virginia Fairfax County Housing MarketNorthern Virginia Fairfax County Housing Market
Northern Virginia Fairfax County Housing MarketBetty Plashal
 
Innovation china india_sep.07_a_panagariya
Innovation china india_sep.07_a_panagariyaInnovation china india_sep.07_a_panagariya
Innovation china india_sep.07_a_panagariyaAttaporn Ninsuwan
 
Monthly Market Commentary December 2009
Monthly Market Commentary   December 2009Monthly Market Commentary   December 2009
Monthly Market Commentary December 2009Christopher R Anderson
 
Regional demographic charts for fbidc website 2012
Regional demographic charts for fbidc website 2012Regional demographic charts for fbidc website 2012
Regional demographic charts for fbidc website 2012jfreeman809
 
Total Market Overview 106 Island Bridge Dr
Total Market Overview 106 Island Bridge DrTotal Market Overview 106 Island Bridge Dr
Total Market Overview 106 Island Bridge Drwaltdowdy
 
Trading plan
Trading planTrading plan
Trading planldfx
 
Flujo de caja hidrosoft
Flujo de caja hidrosoftFlujo de caja hidrosoft
Flujo de caja hidrosoftAldo Uribe
 
Sop control paradox slides - 07 feb12
Sop control paradox slides - 07 feb12Sop control paradox slides - 07 feb12
Sop control paradox slides - 07 feb12Steelwedge_Software
 
Gold correction represents buying opportunity skyrocketing u s federal debt ...
Gold correction represents buying opportunity skyrocketing u s  federal debt ...Gold correction represents buying opportunity skyrocketing u s  federal debt ...
Gold correction represents buying opportunity skyrocketing u s federal debt ...Lucas Litwiniuk, CFA
 
Google student survey p4
Google student survey p4Google student survey p4
Google student survey p4liana1995
 
Predicting the Housing Market with Buyer & Seller Psychology (Predictive Anal...
Predicting the Housing Market with Buyer & Seller Psychology (Predictive Anal...Predicting the Housing Market with Buyer & Seller Psychology (Predictive Anal...
Predicting the Housing Market with Buyer & Seller Psychology (Predictive Anal...Altos Research
 

Ähnlich wie Solon OH Real Estate Market. How many months needed to sell existing inventory of homes for sale (20)

H W 2011 10 At
H W 2011 10 AtH W 2011 10 At
H W 2011 10 At
 
August 2011 Market Pulse - Detached Homes
August 2011 Market Pulse - Detached HomesAugust 2011 Market Pulse - Detached Homes
August 2011 Market Pulse - Detached Homes
 
August 2011 Market Pulse - Attached Homes
August 2011 Market Pulse - Attached HomesAugust 2011 Market Pulse - Attached Homes
August 2011 Market Pulse - Attached Homes
 
H W 2010 07 At
H W 2010 07 AtH W 2010 07 At
H W 2010 07 At
 
H W 2010 01 At
H W 2010 01 AtH W 2010 01 At
H W 2010 01 At
 
Demand & supply
Demand & supplyDemand & supply
Demand & supply
 
Northern Virginia Fairfax County Housing Market
Northern Virginia Fairfax County Housing MarketNorthern Virginia Fairfax County Housing Market
Northern Virginia Fairfax County Housing Market
 
Open House Flyer 22700 Mulholland Dr
Open House Flyer  22700  Mulholland  DrOpen House Flyer  22700  Mulholland  Dr
Open House Flyer 22700 Mulholland Dr
 
Innovation china india_sep.07_a_panagariya
Innovation china india_sep.07_a_panagariyaInnovation china india_sep.07_a_panagariya
Innovation china india_sep.07_a_panagariya
 
Monthly Market Commentary December 2009
Monthly Market Commentary   December 2009Monthly Market Commentary   December 2009
Monthly Market Commentary December 2009
 
Regional demographic charts for fbidc website 2012
Regional demographic charts for fbidc website 2012Regional demographic charts for fbidc website 2012
Regional demographic charts for fbidc website 2012
 
Total Market Overview 106 Island Bridge Dr
Total Market Overview 106 Island Bridge DrTotal Market Overview 106 Island Bridge Dr
Total Market Overview 106 Island Bridge Dr
 
Utah Adult Education Report Card (2008-2009)
Utah Adult Education Report Card (2008-2009)Utah Adult Education Report Card (2008-2009)
Utah Adult Education Report Card (2008-2009)
 
Trading plan
Trading planTrading plan
Trading plan
 
Flujo de caja hidrosoft
Flujo de caja hidrosoftFlujo de caja hidrosoft
Flujo de caja hidrosoft
 
Sop control paradox slides - 07 feb12
Sop control paradox slides - 07 feb12Sop control paradox slides - 07 feb12
Sop control paradox slides - 07 feb12
 
Gold correction represents buying opportunity skyrocketing u s federal debt ...
Gold correction represents buying opportunity skyrocketing u s  federal debt ...Gold correction represents buying opportunity skyrocketing u s  federal debt ...
Gold correction represents buying opportunity skyrocketing u s federal debt ...
 
Google student survey p4
Google student survey p4Google student survey p4
Google student survey p4
 
Predicting the Housing Market with Buyer & Seller Psychology (Predictive Anal...
Predicting the Housing Market with Buyer & Seller Psychology (Predictive Anal...Predicting the Housing Market with Buyer & Seller Psychology (Predictive Anal...
Predicting the Housing Market with Buyer & Seller Psychology (Predictive Anal...
 
André Ernst
André ErnstAndré Ernst
André Ernst
 

Solon OH Real Estate Market. How many months needed to sell existing inventory of homes for sale

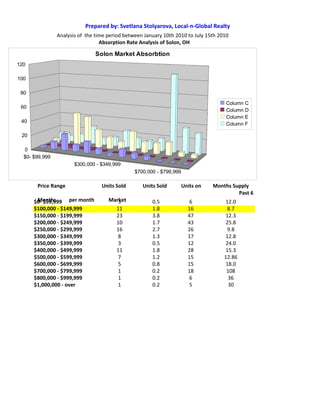
  • 1. Prepared by: Svetlana Stolyarova, Local-n-Global Realty Analysis of the time period between January 10th 2010 to July 15th 2010 Absorption Rate Analysis of Solon, OH Solon Market Absorbtion 120 100 80 Column C 60 Column D Column E 40 Column F 20 0 $0- $99,999 $300,000 - $349,999 $700,000 - $799,999 Price Range Units Sold Units Sold Units on Months Supply a Past 6 $0- $99,999 per month Months Market 3 0.5 6 12.0 $100,000 - $149,999 11 1.8 16 8.7 $150,000 - $199,999 23 3.8 47 12.3 $200,000 - $249,999 10 1.7 43 25.8 $250,000 - $299,999 16 2.7 26 9.8 $300,000 - $349,999 8 1.3 17 12.8 $350,000 - $399,999 3 0.5 12 24.0 $400,000 - $499,999 11 1.8 28 15.3 $500,000 - $599,999 7 1.2 15 12.86 $600,000 - $699,999 5 0.8 15 18.0 $700,000 - $799,999 1 0.2 18 108 $800,000 - $999,999 1 0.2 6 36 $1,000,000 - over 1 0.2 5 30
  • 2.
  • 3. 0.0 5.0 10.0 15.0 20.0 25.0 30.0 $0 -$ 99 ,9 9 9 $1 50 ,0 0 0 -$ 19 9, 99 9 $2 50 ,0 0 0 -$ 29 9, 99 9 $3 50 ,0 0 0 -$ Months Supply 39 9, 99 9 Column F
  • 4. Prepared by: Svetlana Stolyarova, Local-n-Global Realty Analysis of the time period between January 10th 2010 to July 15th 2010 Absorption Rate Analysis of Solon, OH Solon Market Absorbtion 120 100 80 Column C 60 Column D Column E 40 Column F 20 0 $0- $99,999 $300,000 - $349,999 $700,000 - $799,999 Price Range Units Sold Units Sold Units on Months Supply a Past 6 $0- $99,999 per month Months Market 3 0.5 6 12.0 $100,000 - $149,999 11 1.8 16 8.7 $150,000 - $199,999 23 3.8 47 12.3 $200,000 - $249,999 10 1.7 43 25.8 $250,000 - $299,999 16 2.7 26 9.8 $300,000 - $349,999 8 1.3 17 12.8 $350,000 - $399,999 3 0.5 12 24.0 $400,000 - $499,999 11 1.8 28 15.3 $500,000 - $599,999 7 1.2 15 12.86 $600,000 - $699,999 5 0.8 15 18.0 $700,000 - $799,999 1 0.2 18 108 $800,000 - $999,999 1 0.2 6 36 $1,000,000 - over 1 0.2 5 30
  • 5.
  • 6. 0.0 5.0 10.0 15.0 20.0 25.0 30.0 $0 -$ 99 ,9 9 9 $1 50 ,0 0 0 -$ 19 9, 99 9 $2 50 ,0 0 0 -$ 29 9, 99 9 $3 50 ,0 0 0 -$ Months Supply 39 9, 99 9 Column F
  • 7. Prepared by: Svetlana Stolyarova, Local-n-Global Realty Analysis of the time period between April 2nd 2009 to April 1st 2010 Absorption Rate Analysis of Shaker Heights, OH Rochester area Months Supply 30.0 25.0 20.0 15.0 10.0 Column F 5.0 0.0 9 9 9 9 9 99 99 99 ,9 9, 9, 9, 99 19 29 39 -$ -$ -$ -$ $0 0 0 0 0 0 0 ,0 ,0 ,0 50 50 50 $2 $1 $3 Price Range Units Sold Units Sold Units on Months Supply a Past $1 - $199,999 month Year per Market 28 2.3 9 3.9 $200,000 - $249,999 7 0.6 11 18.9 $250,000 - $299,999 5 0.4 10 24.0 $300,000 - $349,999 7 0.6 13 22.3 $350,000 - $499,999 6 0.5 10 20.0 $500,000 - $999,999 4 0.3 9 27.0
  • 9. Prepared by: Svetlana Stolyarova, Local-n-Global Realty Analysis of the time period between June 30, 2009 to June 29, 2010 Absorption Rate Analysis of Seven Hills, OH Rochester area Seven Hills 40 35 30 25 Number of units 6 17 28 38 11 11 9 20 2 7 18 33 23 16 19 15 0.5 1.4 2.3 3.2 0.9 0.9 0.8 10 5 0 $125,000 - $149,999 $250,000 - $299,999 0 - $99,999 $175,000 - $199,999 Price range Price Range Units Sold Units Sold Units on Months Supply a Past 12 Months per month Market $1 - $24,999 2 0.2 1 6.0 0 - $99,999 6 0.5 2 4.0 $100,000 - $124,999 17 1.4 7 4.9 $125,000 - $149,999 28 2.3 18 7.7 $150,000 - $174,999 38 3.2 33 10.4 $175,000 - $199,999 11 0.9 23 25.1 $200,000 - $249,999 11 0.9 16 17.5 $250,000 - $299,999 9 0.8 19 25.3
  • 10. Prepared by: Svetlana Stolyarova, Local-n-Global Realty Analysis of the time period between April 2nd 2009 to April 1st 2010 Absorption Rate Analysis of South Euclid, OH Rochester area South Euclid 140 120 100 Number of units 80 Column C 60 Column D Column E 40 20 0 $25,000 - $49,999 $75,000 - $99,999 $125,000 - $149,999 $1 - $24,999 $50,000 - $74,999 $100,000 - $124,999 Price range Price Range Units Sold Units Sold Units on Months Supply a Past 6 Months per month $1 - $24,999 Market 2 0.2 1 6.0 $25,000 - $49,999 55 4.6 6 1.3 $50,000 - $74,999 41 3.4 31 9.1 $75,000 - $99,999 56 4.7 86 18.4 $100,000 - $124,999 29 2.4 123 50.9 $125,000 - $149,999 21 1.8 39 22.3