
Empfohlen
Weitere ähnliche Inhalte
Andere mochten auch
Andere mochten auch (9)
Ähnlich wie 4a.3 assessing competitiveness
Ähnlich wie 4a.3 assessing competitiveness (20)
Kürzlich hochgeladen
Kürzlich hochgeladen (20)
4a.3 assessing competitiveness
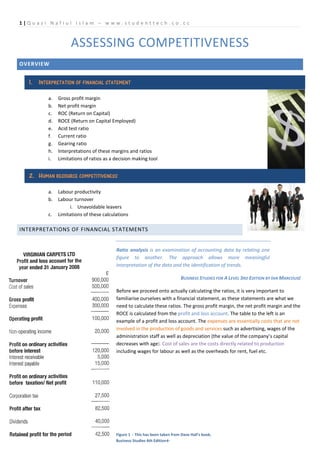
- 1. 1|Q u az i N a f i u l I sl a m – w w w . s t u d e n t t e c h .c o . c c ASSESSING COMPETITIVENESS OVERVIEW 1. INTERPRETATION OF FINANCIAL STATEMENT a. Gross profit margin b. Net profit margin c. ROC (Return on Capital) d. ROCE (Return on Capital Employed) e. Acid test ratio f. Current ratio g. Gearing ratio h. Interpretations of these margins and ratios i. Limitations of ratios as a decision making tool 2. HUMAN RESOURCE COMPETITIVENESS a. Labour productivity b. Labour turnover i. Unavoidable leavers c. Limitations of these calculations INTERPRETATIONS OF FINANCIAL STATEMENTS Ratio analysis is an examination of accounting data by relating one figure to another. The approach allows more meaningful interpretation of the data and the identification of trends. BUSINESS STUDIES FOR A LEVEL 3RD EDITION BY IAN MARCOUSÉ Before we proceed onto actually calculating the ratios, it is very important to familiarise ourselves with a financial statement, as these statements are what we need to calculate these ratios. The gross profit margin, the net profit margin and the ROCE is calculated from the profit and loss account. The table to the left is an example of a profit and loss account. The expenses are essentially costs that are not involved in the production of goods and services such as advertising, wages of the administration staff as well as depreciation (the value of the company’s capital decreases with age). Cost of sales are the costs directly related to production including wages for labour as well as the overheads for rent, fuel etc. Figure 1 - This has been taken from Dave Hall's book, Business Studies 4th Edition←
- 2. 2|Q u az i N a f i u l I sl a m – w w w . s t u d e n t t e c h .c o . c c GROSS PROFIT MARGIN First, we need to calculate the gross profit, and then we can calculate the margin. ������������������������������ ������������������������������������ = ������������������������������ ������������������������������������������ (������������������������ ������������������������������ ������������ ������������������������������������������������) − ������������������������ ������������ ������������������������������ ������������������������������ ������������������������������������ ������������������������������ ������������������������������������ ������������������������������������ = × 100 ������������������������������ ������������������������������������������ (������������������������ ������������������������ ������������ ������������������������������������������������) £400,000 4 ������������������������������ ������������������������������������ ������������������������������������ = × 100 = 44 % £900,000 9 ������������������������������ ������������������������������������ ������������������������������������ ≈ 44% NET PROFIT MARGIN First, we need to calculate the net profit, and then we calculate the margin. As a simple rule of thumb, the net profit is the profit before tax – essentially, after you have taken all the costs, other expenses not directly linked to the production of the product as well as interest payable, you get the net profit: the value that the business is taxed on. The net profit will be very clearly stated in the tables that the exam board will provide, because its exact location can vary depending on the financial transactions of each individual business. ������������������ ������������������������������������ ������������������ ������������������������������������ ������������������������������������ = × 100 ������������������������������ ������������������������������������������ (������������������������ ������������������������������ ������������ ������������������������������������������������) £110,000 2 ������������������ ������������������������������������ ������������������������������������ = = 12 % £900,000 9 ������������������ ������������������������������������ ������������������������������������ ≈ 12% ROCE (THE RETURN ON CAPITAL EMPLOYED) To calculate this value, we need to be familiar with the balance sheet. The balance sheet is essentially a financial statement that lists a firm’s assets and liabilities: in simple terms, it’s what a business owns and owes. We need to remind ourselves that long term loans are also counted as investment into the business and therefore do count as capital employed into the business. The business made an operating profit of £5,600,000. • Fixed assets are assets that the business will have in the long term i.e. buildings, machinery etc. basically, assets that the business will have for more than a year. • Current Assets are assets that will last for less than a year. These assets are the most liquid assets the business has; examples include things such as cash etc. ������������������������������������������ ������������������������������������������ (������������������ ������������������������������������) = ������������������������������������������ ������������������������������������ − ������������������������������������������ ������������������������������������������������������������ ������������������ ������������������������������������ = ������������������������������ ������������������������������������ + (������������������������������������������ ������������������������������������ − ������������������������������������������ ������������������������������������������������������������) ������������������������������������������ ������������������������������������������������ = ������������������ ������������������������������������ + ������������������������ ������������������������ ������������������������������������������������������������������ ������������������������������������������������������ ������������������������������������ ������������������������ = × 100 ������������������������������������������ ������������������������������������������������ £5,600,000 ������������������������ = × 100 ≈ 22% (£17,400,000 + £8,000,000)
- 3. 3|Q u az i N a f i u l I sl a m – w w w . s t u d e n t t e c h .c o . c c ROC (RETURN ON CAPITAL) This essentially measures the profitability of a business. If a business invests into a project, it will want to know the profitability of the project. ������������������ ������������������������������������ ������������������ (������������������������������������ ������������ ������������������������������������������) = × 100 ������������������������������������������ ������������������������������������������������ This value is expressed as a percentage. THE CURRENT RATIO AND THE ACID TEST RATIO Both these ratio assess the liquidity of a business i.e. how easily a business’ assets can be turned into cash. Again, this is another ratio that is concerned with the balances sheets a business publishes. CURRENT RATIO The current ratio of a business is essentially the ratio between its current asses and its current liabilities. ������������������������������������������ ������������������������������������ ������������������������������������������ ������������������������������ = ������������������������������������������ ������������������������������������������������������������������ ACID TEST RATIO The acid test ratio takes into account that stocks are the least liquid of all the current assets and should not be counted as an asset that can be easily liquefied. ������������������������������������������ ������������������������������������ − ������������������������������ ������������������������ ������������������������ ������������������������������ = ������������������������������������������ ������������������������������������������������������������������ GEARING RATIO This essentially is a ratio that gives an indication of how much debt the business is under, giving insight into the long term stability of the organisation. ������������������������-������������������������ ������������������������������ ������������������������������������������ (������������������������ ������������������������������ ������������ ������������������������������������������������)������������������������������ = × 100 ������������������������������������������ ������������������������������������������������ This value (like every other ratio that is multiplied by 100) is expressed as a percentage. In boom times, investors and banks find gearing a good thing, as the business is focusing on growth, however this entails great risk. However, if a recession suddenly hits, then the business will be in grave danger because now the business still has to pay back the interest with a reduced income from battered sales.
- 4. 4|Q u az i N a f i u l I sl a m – w w w . s t u d e n t t e c h .c o . c c INTERPRETATIONS OF THESE MARGINS ANS RATIOS RATIO OR MARGIN ANALYSIS The gross profit will differ from industry to industry and hence needs to be looked at with the context of the business in mind. Can be improved by: GROSS PROFIT MARGIN • Raising sales revenue without increasing total costs – i.e. make production cheaper e.g. can be done via automation. Similarly to the gross profit margin, this will vary from industry to industry and has to be looked at with the context of the business in mind. For example, the food industry has both a NET PROFIT MARGIN low gross and net profit margins, but since there is a very high volume sold, it is not a problem. Can be improved by: • Same as gross profit margin. This is a fundamental ratio that essentially shows how well the business is making use of its resources and essentially, how lucrative it is for investment. The ROCE of a business needs to be compared with previous years to identify a trend in its growth. Also, if the ROCE is less than 6 %, then there is little incentive to invest as if an investor were to invest this money into ROCE (RETURN ON CAPITAL EMPLOYED) the bank instead, then the person would be much better off still making money with no risk. Can be improved by: • Increasing the efficiency of the business through generating greater profits from the same amount of capital invested. This measures the profitability of a project or operation and thus is a good indicator of how ROC (RETURN ON CAPITAL) successful the project was to the business. Shows the ratio between assets and liabilities. The business would do best to keep this at 1.5:1. However if this is too high, it means that the business has too much money that it is not investing. However, having too low a current ratio means that it may not be able pay back debts in times of crisis such as a downturn. Can be improved by: CURRENT RATIO • Selling under-used fixed assets • Selling shares to gain more share capital • Postpone or reduce planned investments • Take long term-loans Arguably, the best ratio is 1:1. A result that is too low means that that the business may not be able to pay off its short term debts. However, companies such as supermarkets operate with very low liquidity ratios. In fact, some of the major companies such as BP, Imperial Tobacco and TESCO have very low acid test ratios. ACID TEST RATIO • Adopting JIT, this way you have not stock to worry about – and you can divert more capital into production • Selling under-used capital or selling old machinery • Selling shares to increase share capital • Take long term loans The more geared the business is, the more debt it has. By this, it means that investing in this business is risky as well as it will be hard for the business to gain finances from banks. However, whether a business that is geared will get investment will also depend on the state of the industry. Can be improved by: GEARING RATIO • Issue more shares to raise share capital • Buy back debentures (bonds) • Retain more profit • Repay loans
- 5. 5|Q u az i N a f i u l I sl a m – w w w . s t u d e n t t e c h .c o . c c VALUE AND LIMITATIONS OF THESE RATIOS AS A DECISION MAKING TOOL VALUE LIMITATIONS Comparisons have to be made with businesses that are similar (same industry, similar operations) and also businesses in the same time frame in order to get a fair comparison. Ratios are very simple to calculate, most of them have a consistent Sometimes, businesses in the same industry are vastly different. formula. Sainsbury focuses on food and groceries alone, while TESCO is moving onto home appliances – these new products will have a different gross profit margin and will affect comparisons. Businesses might also have different accounting techniques, which Analysis can be carried out very quickly as they are very simple to will determine how their financial statements are made – financial calculate and demand only basic financial statements. statements determine ratios. Can be used to compare one company with another; they can be The ratios are limited to the quality of the balance sheets – the used to compare businesses in the same industry. Comparisons balance sheet represents a ‘snapshot’ of the business at the end can also be made within the companies as it may have many on- of a financial year and is not representative of the business’ going projects. circumstance over the entire year. Qualitative information is ignored, making it quite ineffective in Can be used by decision makers to identify the strengths and the service industry. weaknesses of a business. For example, if gross profit margin is very high, but the Net profit margin is very low, then the business may try to reduce operational costs as well as reduce its debts. The ratios are only as good as the financial accounts. Inflation can make a business’ assets look more valuable – when there might not actually be a change in real value. WINDOW DRESSING Window dressing is the legal manipulation of company accounts by a business to present a financial picture which is to its benefit. BUSINESS STUDIES 4TH EDITION, DAVE HALL • Business managers may want to paint a good financial image of the business in order to attract investors. • Businesses might manipulate the financial picture to look bleak for the short term to make it look better in the long term – business tend to choose to get over with a financial crisis quickly than having poor financial performance for a long time; if the business shows strength in coming out of a financial crisis then they will become a favourite with investors. • Making financial statements look worse can be used to reduce the tax on a business. • Businesses trying to sell itself or one of its operations will do their best to manipulate accounts in order to get the best possible value for the business.
- 6. 6|Q u az i N a f i u l I sl a m – w w w . s t u d e n t t e c h .c o . c c HUMAN RESOURCE COMETITIVENESS Both labour productivity and turnover show the effectiveness of the work force and can be a very useful yard-stick for measuring the efficiency of the business in question. LABOUR PRODUCTIVITY ������������������������������ ������������������������������������ (������������������ ������������������������������������ ������������ ������������������������) ������������������������������������ ������������������������������������������������������������������������ = ������������������������������������������ ������������������������������������ ������������ ������������������������������������������������������ (������������������ ������������������������������������ ������������ ������������������������) This essentially measures the how many products (on average) a worker produces over a specific period of time. There can be many ways to improve this: • Making production more capital intensive will reduce the need to labour as well as produce at a cheaper rate as machines can work continuously unlike workers. • Often, changing the type of production can improve the efficiency of a business; using cell production instead of assembly line production is an example as it meets worker’s social needs. • Training can make workers more able, allowing them to perform their work more efficiently. • Overall, increasing the motivation of workers by giving them more power or authority is also a great way to increase productivity, as they can highlight the main problems with the production process and can therefore come up with a better solution. High labour productivity will drive the costs of the business down and hence the business can sell cheaper products to gain greater sales or keep prices the same and get more profit – depending on the elasticity of the product. However, even after adoption these measures, often businesses are unable to compete: • Often competing businesses may offshore production to places such as China, where the labour cost is very cheap. • Rivals may be able to increase productivity at an even faster rate, than the business, through a combination of technology and cheap labour. • Rival might also enhance the quality of the product while at the same time increasing the productivity of the business. LABOUR TURNOVER ������������������������������������ ������������ ������������������������������ ������������������������������������������ (������������������������ ������ ������������������������������������ ������������ ������������������������) ������������������������������������ ������������������������������������������������ = × 100 ������������������������������������������ ������������������������������������ ������������ ������������������������������ ������������ ������������������������ ������������ ������������������������ (������������������������ ������ ������������������������������������ ������������ ������������������������) Labour turnover can be caused by a variety of reasons. Some being: Problems with recruiting new staff: • The company paying staff low wages • Relatively few training programmes • It takes time and has high administration costs o Induction programmed given by large • Poor methods in recruitment and selection companies increase the cost of process recruitment • Poor working conditions – unsafe, bullying etc. • Lack of transport may also be a reason Why turnover may be a good thing: • Some turnover is unavoidable as some businesses may have passed the working age. • New staff bring in new ideas • Some workers may be ineffective • If a business is shrinking, reducing business size can be good in cutting costs. • If a business pays low wages, it might prefer hiring new workers than increasing the wage.
- 7. 7|Q u az i N a f i u l I sl a m – w w w . s t u d e n t t e c h .c o . c c USES AND LIMITATIONS • These ratios give an indication of a problem in the business, but does not give any specific detail about the problems that the business and often business have to carry out additional research to get to the root of the problem.