3. Forward-looking statements
This presentation and subsequent discussion may contain certain
forward-looking statements with respect to the financial condition, results
of operations and business of the Group. These forward-looking statements
represent the Group’s expectations or beliefs concerning future events and
involve known and unknown risks and uncertainty that could cause actual
results, performance or events to differ materially from those expressed or
implied in such statements. Additional detailed information concerning
important factors that could cause actual results to differ materially is available
in our Annual Report.
3
5. Key achievements
Managing for growth
• Strong organic revenue growth
• Contained increase in costs to below revenue growth
• Improved return on invested capital with strengthened tier one ratio
• Deposits grew faster than customer lending
• Positioned for future expansion
5
6. 2006 interim results
(US$ millions) 1H05 1H06 % Change
Net operating income before loan impairment charges 28,029 32,185 +15
Net operating income 24,752 28,295 +14
Total operating expenses (14,420) (16,139) +12
Profit before tax 10,640 12,517 +18
Profit attributable to shareholders 7,596 8,729 +15
Earnings per share (US$) 0.69 0.78 +13
Dividend per share (US$), first and second interim dividends 0.28 0.30 +7
Tier 1 ratio (%) 8.7 9.4
6
7. Movement in profit attributable to shareholders
9,000
8,729
1,017
8,000
163
(47)
7,596 7,596
385
165
US$m
106
6,940
7,000
6,000
5,000
Attributable profit H105 FX translation Acquisitions/Investments Underlying growth Attributable profit 1H06
2005 interim results
7
8. Improving capital efficiency
Generated 24%
annualised return from
additional US$9bn of
capital US$102bn
Return on invested capital (%)
100 20
US$93bn
90 15
US$bn
(%)
US$84bn
Tier 1 ratio (%)
80 10
70 5
1H04 2H04 1H05 2H05 1H06
Average invested capital employed (US$bn) Return on invested capital (%) Tier 1 ratio (%)
8
9. Strength of operating franchise by geography
Profit before tax
1H05 1H06
3% 3%
27% Europe 29%
34%
35% Hong Kong
Rest of Asia Pacific
North America
23% 21%
South America 13%
12%
US$10.6bn US$12.5bn
Growth in profit, 1H06 vs 1H05
+25
Europe
Hong Kong +10
Rest of Asia-Pacific +29
+15
North America
South America -2
Group +18
(%)
-5 0 5 10 15 20 25 30
9
10. Strong growth in emerging markets
Profit before tax (US$ millions) 1H05 1H06 % change
Mexico 428 515 +20
Middle East 204 378 +85
Mainland China 161 280 +74
Brazil 185 251 +36
India 108 215 +99
Saudi Arabia 128 181 +41
Malaysia 103 128 +24
Turkey 133 120 -10
Argentina 165 83 -50
South Korea 55 48 -13
Philippines 19 43 +126
Indonesia 55 27 -51
Thailand 31 24 -23
Taiwan 48 (43) n/a
Total 1,823 2,250 +23
10
11. Strength of operating franchise by customer group
Pre-tax profits
1H05 1H06
4% 3% 5%
Personal Financial Services
23%
22% Corporate, Investment Banking and Markets
47%
49% Commercial Banking
Private Banking
22% 25%
Other
US$10.6bn US$12.5bn
Growth in profit, 1H06 vs 1H05
Personal Financial Services +13
+37
Corporate, Investment Banking and Markets
+21
Commercial Banking
+33
Private Banking
+18
Group
(%)
0 5 10 15 20 25 30 35 40
11
12. Personal Financial Services
1H06 v 1H05
Underlying
% change1
(US$ millions) 1H05 2H05 1H06 % change
Net operating income before loan impairment charges 16,325 17,399 18,517 +13 +10
Loan impairment and other (charges) (3,163) (4,374) (3,709) +17 +12
Net operating income 13,162 13,025 14,808 +13 +10
Total operating expenses (8,029) (8,398) (9,073) +13 +10
Profit before tax 5,219 4,685 5,908 +13 +10
Cost efficiency ratio2 49.2% 48.3% 49.0%
• Strong growth in deposit gathering in the US, UK and Rest of Asia-Pacific
• US and UK lending grew strongly, particularly in mortgages with Rest of Asia-Pacific strong across the board
• We invested to improve our distribution network in the UK, US, Mexico and Mainland China
• Credit quality remained generally good
(1) Constant currency excluding acquisitions
(2) Total operating expenses / Net operating income before loan impairment charges
12
13. Commercial Banking
1H06 v 1H05
Underlying
% change1
(US$ millions) 1H05 2H05 1H06 % change
Net operating income before loan impairment charges 4,669 5,115 5,363 +15 +15
Loan impairment and other (charges) (204) (343) (260) +28 +27
Net operating income 4,465 4,772 5,103 +14 +15
Total operating expenses (2,180) (2,273) (2,385) +9 +10
Profit before tax 2,374 2,587 2,862 +21 +21
Cost efficiency ratio2 46.7% 44.4% 44.5%
• Strong growth in customer deposits exceeded growth in customer loans contributing to improved capital utilisation
• Continued improvement in cost efficiency
• Progress towards establishing HSBC as the ‘International Business Bank’
• Reinforces HSBC’s strategy to ‘Be the Best Bank for Small Business’
• Grew commercial internet banking usage – over 1 million customers
(1) Constant currency excluding acquisitions
(2) Total operating expenses / Net operating income before loan impairment charges
13
14. Corporate, Investment Banking and Markets
1H06 v 1H05
Underlying
% change1
(US$ millions) 1H05 2H05 1H06 % change
Net operating income before loan impairment recoveries 5,415 6,042 6,751 +25 +26
Loan impairment recoveries 77 195 109 +42 +44
Net operating income 5,492 6,237 6,860 +25 +27
Total operating expenses (3,311) (3,527) (3,740) +13 +15
Profit before tax 2,301 2,862 3,144 +37 +37
Cost efficiency ratio2 61.1% 58.4% 55.4%
• Transitioned to execution phase of CIBM plan
• Strong growth in areas in which we have invested
• Cost growth slowed with significant improvement in cost efficiency ratio
• Management structure has been streamlined
(1) Constant currency excluding acquisitions
(2) Total operating expenses / Net operating income before loan impairment charges
14
15. Private Banking
1H06 v 1H05
Underlying
% change1
(US$ millions) 1H05 2H05 1H06 % change
Net operating income before loan impairment charges 1,162 1,204 1,460 +26 +27
Loan impairment and other (charges) / recoveries 12 - (29) n/a n/a
Net operating income 1,174 1,204 1,431 +22 +24
Total operating expenses (723) (743) (831) +15 +16
Profit before tax 451 461 600 +33 +35
Cost efficiency ratio2 62.2% 61.7% 56.9%
• Continued the success of transforming the business
• Strong growth in client assets and lending
• Strong improvement in operational efficiency
• Increased cross-referrals from within the Group
(1) Constant currency excluding acquisitions
(2) Total operating expenses / Net operating income before loan impairment charges
15
16. Rapid growth of direct businesses
• Direct business is growing in all customer groups and all markets
• 20,000 large corporate clients in 123 countries use hsbc.net
• Strong SME take up of commercial internet banking
– Over 1m registered users
– 40% of registered users are in Mexico, Brazil and Turkey
• 14m active personal internet banking customers, up 30%
– 3.3m product sales on-line, up 60%
– hsbc.direct in the US attracted US$5bn in deposits
16
18. Underlying growth, 1H06 v 1H05
Restated Acquisitions/ Rest of
1H051 investments2
(US$ millions) 1H06 HSBC % change
Net operating income before
loan impairment charges 27,929 32,185 499 31,686 +13.4
Loan impairment & other charges (3,294) (3,890) (167) (3,723) +13.0
Net operating income 24,635 28,295 332 27,963 +13.5
Total operating expenses (14,365) (16,139) (203) (15,936) +10.9
Associates 309 361 79 282 -8.7
Profit before tax 10,579 12,517 208 12,309 +16.4
(1) At constant currency
(2) Includes Metris and investment in Ping An
18
19. Underlying growth, 1H06 v 2H05
Restated Acquisitions/ Rest of
2H051 investments2
(US$ millions) 1H06 HSBC % change
Net operating income before
loan impairment charges 29,875 32,185 499 31,686 +6.1
Loan impairment & other charges (4,548) (3,890) (167) (3,723) -18.1
Net operating income 25,327 28,295 332 27,963 +10.4
Total operating expenses (15,246) (16,139) (203) (15,936) +4.5
Associates 340 361 61 300 -11.8
Profit before tax 10,421 12,517 190 12,327 +18.3
(1) At constant currency
(2) Includes Metris and investment in Ping An
19
20. Investment spend focused on higher growth markets
Harvest Grow
0
10
20
Malaysia
1
30
Cost efficiency ratio
Hong
Kong
40 UAE
Canada
48.8%2
US
50
UK
Mexico
60 Turkey
Brazil
Argentina India
70
France
80
Mainland China
90
Re-engineer Invest
12.5%2
100
-40 -30 -20 -10 0 10 20 30 40 50 60 70 80
1
Revenue growth
Note: Size of circle represents profit contribution
(1) Excluding Corporate, Investment Banking and Markets
(2) Group average figure, excluding Corporate, Investment Banking and Markets
20
21. US$m
0
5
10
15
20
25
30
-8 to -4
-4 to 0
revenues
0 to 4
4 to 8
8 to 12
12 to 16
16 to 20
20 to 24
24 to 28
1H06
21
28 to 32
32 to 36
36 to 40
Number of days 40 to 44
1H05 44 to 48
48 to 52
52 to 56
56 to 60
60 to 64
64 to 68
1H05, US$19.7m
1H06, US$22.3m
68 to 72
Average revenue per day:
Daily distribution of Global Markets and other trading
72 to 76
22. Loan portfolio
1H05 1H06
7% 8%
Residential mortgages
31%
32%
Other personal lending
38% 38%
Corporate & Commercial lending
Financial institutions 23%
23%
US$718.8bn US$825.6bn
1H06 vs 1H05 underlying growth1 (%)
+9
Residential mortgages
+13
Other personal lending
+11
Corporate & Commercial lending
Group Total1 +11
(%)
0 5 10 15
(1) Underlying growth: at constant currency, excluding acquisitions and financial institutions
22
23. Loan impairment charges
Net charge as % of average advances
6 2%
4
1.30%
1.02% 1.04%
US$bn
2 1%
5.7
4.4 5.1
0
(1.1) (1.1) (1.2)
(2) 0%
1H05 2H05 1H06
New provisions Releases and recoveries Net charge as % of average advances
23
24. Loan impairment charge and other credit risk provisions –
Personal Financial Services and Commercial Banking by region
As a % of average
US$ millions advances (annualised)
1H05 1H06 1H05 1H06
Personal Financial Services
Europe 810 847 1.37 1.37
Hong Kong (47) 55 (0.28) 0.32
Rest of Asia-Pacific 76 289 0.63 2.07
North America 2,097 2,197 2.15 2.04
South America 227 321 11.14 12.15
Total 3,163 3,709 1.69 1.82
Commercial Banking
Europe 160 145 0.48 0.43
Hong Kong 110 38 1.15 0.37
Rest of Asia-Pacific (49) (19) (0.58) (0.20)
North America (40) 42 (0.29) 0.25
South America 23 54 1.97 2.98
Total 204 260 0.31 0.36
24
26. North America (USA & Canada)
Personal Financial Services
underlying
% change1
1H05 1H06
Net operating income before loan impairment charges 7,580 8,742 +15
Loan impairment and other (charges) (2,101) (2,118) +1
Net operating income 5,479 6,624 +21
Total operating expenses (3,073) (3,618) +17
Profit before tax 2,407 3,008 +25
Cost efficiency ratio 40.5% 41.4%
• Good customer loan growth across all businesses and a stable US economy drove the improved performance
• Higher credit card fees and improved portfolio yield, driven by re-pricing efforts, contributed to net operating
income growth
• Operating expenses increased to support consumer finance growth, deposit growth, and branch expansion in the
US Bank
• Good progress has been made in our cross sell and deposit initiatives. On-line deposits now over US$5bn
(1) Constant currency excluding acquisitions
26
27. North America (USA & Canada)
Commercial Banking
underlying
% change1
1H05 1H06
Net operating income before loan impairment charges 659 802 +17
Loan impairment and other (charges) / recoveries 35 (35) n/a
Net operating income 694 767 +6
Total operating expenses (311) (370) +16
Profit before tax 383 426 +7
Cost efficiency ratio 47.2% 46.1%
• New branches and products drove growth in loan and net operating income
• Strong Commercial deposit growth and momentum in transaction banking
• Operating expenses increased to support growth and expansion of distribution channels
• Continued favourable credit environment
(1) Constant currency excluding acquisitions
27
29. US residential first mortgages & 2nd lien lending market
(US$ billions) 1H05 2H05 1H06
US residential first mortgages & 2nd lien lending 112 118 126
Recent trends
• Housing market showing signs of slowing. Increased loan impairment charges in 1H06 due to
deteriorating performance in the 2005 vintages within our wholesale/correspondent business
• Overall, the first lien mortgage book shows stable credit
Geographical and composition1 considerations at 30 June, 2006
(%) of portfolio Consumer Overall Composition Bank Consumer Finance
by State Bank Finance portfolio
California 19 14 16 Total book (US$bn) 38 89
New York 23 5 10 Adjustable rate 77% 27%
Florida 5 8 7 Interest only 24% 7%
Second lien 10% 18%
(1) Percentages are based on stated portfolio. Certain loans may be included in more than one classification.
Interest rate only balances are included in adjustable rate balances.
29
31. Europe – Personal Financial Services
underlying
% change1
(US$ millions) 1H05 1H06
Net operating income before loan impairment charges 4,286 4,425 +7
Loan impairment and other charges (810) (847) +8
Net operating income 3,476 3,578 +7
Total operating expenses (2,590) (2,666) +7
Profit before tax 889 912 +8
Cost efficiency ratio 60.4% 60.2%
• Personal Financial Services growing across Europe
– Strong growth in UK deposits, particularly online savings and packaged current accounts, and UK mortgage
loans
– Re-branding in France supported customer acquisition, with balance sheet and fee income growth
– Strong growth in credit cards, personal lending and insurance products in Turkey
(1) Constant currency excluding acquisitions
31
32. Europe – Commercial Banking
underlying
% change1
(US$ millions) 1H05 1H06
Net operating income before loan impairment charges 2,325 2,347 +5
Loan impairment and other charges (160) (145) -8
Net operating income 2,165 2,202 +6
Total operating expenses (1,191) (1,126) -1
Profit before tax 977 1,076 +15
Cost efficiency ratio 51.2% 48.0%
• Growth in profit before tax from Commercial Banking was good with credit quality stable
– Strong deposit growth and successful attraction of switchers in the UK
– Successful development of SME business in Turkey
– Strengthened relationship management in France
(1) Constant currency excluding acquisitions
32
33. UK unsecured consumer credit
% of impairment charge from bankruptcy/IVAs
500 35%
Impairment charge from bankruptcy/IVAs
30%
400
UK PFS credit losses (£m)
25%
300
20%
15%
200
10%
100
5%
0 0%
1H05 2H05 1H06
Credit Losses % of impairment charge from bankruptcy/IVAs (rhs)
IVA = individual voluntary arrangement
33
34. HSBC – changing the face of UK banking
• £400m investment in UK retail and commercial distribution network
• Five unique ‘Megastores’ planned – over 175,000sq ft of retail space
• 500 new ATMs, 250 new Express terminals, 400 new paying-in machines
• HSBC the most recommended big bank by personal and commercial customers
34
36. Hong Kong – Personal Financial Services
underlying
% change1
(US$ millions) 1H05 1H06
Net operating income before loan impairment charges 1,907 2,139 +12
Loan impairment recoveries/(charges) 47 (55) n/a
Net operating income 1,954 2,084 +6
Total operating expenses (625) (666) +6
Pre-tax profit 1,331 1,420 +6
Cost efficiency ratio 32.8% 31.1%
• Solid set of results – leading position in deposits, mortgages, credit cards and wealth management services
• New simplified mortgage offer – HSBC bank market share of new lending rose significantly
• Successful card acquisition campaign – raises card base to 4.4 million
• Buoyant equity markets in 1Q06 – greater equity linked fee revenues
• Broad product and service base – well positioned to cope with changing markets and customer needs
(1) Constant currency excluding acquisitions
36
37. Hong Kong – Commercial Banking
underlying
% change1
(US$ millions) 1H05 1H06
Net operating income before loan impairment charges 708 857 +20
Loan impairment (charges) (110) (38) -66
Net operating income 598 819 +36
Total operating expenses (204) (232) +13
Pre-tax profit 394 587 +48
Cost efficiency ratio 28.8% 27.1%
• Growth in deposits, loans and wealth management products
• Higher insurance revenue – new dedicated CMB direct sales force
• Strengthened SME proposition – new dedicated SME centres, more relationship managers, new SME
lending programme
(1) Constant currency excluding acquisitions
37
38. Rest of Asia-Pacific – Personal Financial Services
underlying
% change1
(US$ millions) 1H05 1H06
Net operating income before loan impairment charges 806 1,030 +28
Loan impairment and other (charges) (76) (289) +281
Net operating income 730 741 +2
Total operating expenses (559) (707) +27
Pre-tax profit 252 205 -50
Cost efficiency ratio 69.4% 68.6%
• Solid progress – continued investment in customer acquisition and new product and business developments
• Provisioning – Taiwan and Indonesia affected by deteriorating consumer credit and regulatory intervention
• Consumer finance – rolled out in India and Australia
(1) Constant currency excluding acquisitions
38
39. Rest of Asia-Pacific – Commercial Banking
underlying
% change1
(US$ millions) 1H05 1H06
Net operating income before loan impairment charges 473 617 +30
Loan impairment and other recoveries 49 19 -62
Net operating income 522 636 +22
Total operating expenses (202) (252) +25
Pre-tax profit 406 498 +22
Cost efficiency ratio 42.7% 40.8%
• Client base expansion – marketing of deposits, trade finance and cash management services amid
buoyant economies
• Cost growth – recruitment and business development throughout the region
(1) Constant currency excluding acquisitions
39
40. Mainland China results
underlying
% change1
(US$ millions) 1H05 1H06
Net operating income before loan impairment charges 93 133 +51
Loan impairment recoveries/(charges) 4 (2) n/a
Net operating income 97 131 +31
Total operating expenses (49) (79) +55
China branch profits 48 52 +6
Associates and other 113 228 +28
Profit before tax 161 280 +22
• Strong growth – expanded branch network and investments
• Significant progress at BoCom – joint credit card reaching over 1 million
• New Commercial Banking initiatives – business referral agreement with Ping An; revolving-credit product
with BoCom
• Corporate, Investment Banking and Markets – Transaction Banking and FX businesses benefited from buoyant
economy and corporate activity
(1) Constant currency excluding acquisitions and investments
40
48. HSBC outlook
Outlook
• World economy remains fundamentally strong
• Growth prospects restrained by higher interest rates, increased energy
prices, and slowing housing markets
• Our diversification combined with capital strength positions us well to take
advantage of opportunities as they arise
48
49. Our main focus going forward
Customer
on
O
i
ut
rg
b
tri
an
is
is
at
D
io
n
Te
ch
no
re
tu
lo
gy
ul
C
Brand
49
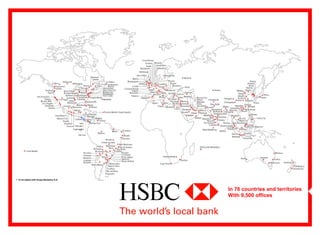
50. Managua
Bogotá
San
Salvador
Tegucigalpa
San Jose
To be added with Grupo Banistmo S.A.
In 76 countries and territories
With 9,500 offices
50
51. Our main focus going forward
Customer
on
O
i
ut
rg
b
tri
an
is
is
at
D
io
n
Te
ch
no
re
tu
lo
gy
ul
C
Brand
51
52. Key achievements
Managing for growth
• Strong organic revenue growth
• Contained increase in costs to below revenue growth
• Improved return on invested capital with strengthened tier one ratio
• Deposits grew faster than customer lending
• Positioned for future expansion
52
53. Managua
Bogotá
San
Salvador
Tegucigalpa
San Jose
To be added with Grupo Banistmo S.A.
In 76 countries and territories
With 9,500 offices
53