(INDIRA) Call Girl Mumbai Call Now 8250077686 Mumbai Escorts 24x7
Weekly market report
1. Page 1 of 5
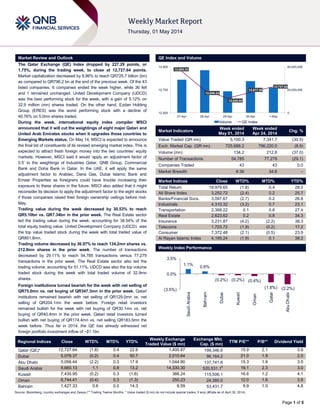
Market Review and Outlook QE Index and Volume
The Qatar Exchange (QE) Index dropped by 227.29 points, or
1.75%, during the trading week, to close at 12,727.64 points.
Market capitalization decreased by 8.86% to reach QR725.7 billion (bn)
as compared to QR796.2 bn at the end of the previous week. Of the 43
listed companies, 6 companies ended the week higher, while 36 fell
and 1 remained unchanged. United Development Company (UDCD)
was the best performing stock for the week, with a gain of 5.12% on
32.9 million (mn) shares traded. On the other hand, Ezdan Holding
Group (ERES) was the worst performing stock with a decline of
40.76% on 5.0mn shares traded.
During the week, international equity index compiler MSCI
announced that it will cut the weightings of eight major Qatari and
United Arab Emirates stocks when it upgrades those countries to
Emerging Markets status. On May 14, MSCI is expected to announce
the final list of constituents of its revised emerging market index. This is
expected to attract fresh foreign money into the two countries’ equity
markets. However, MSCI said it would ‘apply an adjustment factor of
0.5’ to the weightings of Industries Qatar, QNB Group, Commercial
Bank and Doha Bank in Qatar. In the UAE, it will apply the same
adjustment factor to Arabtec, Dana Gas, Dubai Islamic Bank and
Emaar Properties as foreigners could have trouble increasing their
exposure to these shares in the future. MSCI also added that it might
reconsider its decision to apply the adjustment factor to the eight stocks
if those companies raised their foreign ownership ceilings before mid-
May.
Trading value during the week decreased by 30.53% to reach
QR5.10bn vs. QR7.34bn in the prior week. The Real Estate sector
led the trading value during the week, accounting for 38.54% of the
total equity trading value. United Development Company (UDCD) was
the top value traded stock during the week with total traded value of
QR851.8mn.
Trading volume decreased by 36.97% to reach 134.2mn shares vs.
212.8mn shares in the prior week. The number of transactions
decreased by 29.11% to reach 54,785 transactions versus 77,279
transactions in the prior week. The Real Estate sector also led the
trading volume, accounting for 51.11%. UDCD was also the top volume
traded stock during the week with total traded volume of 32.9mn
shares.
Foreign institutions turned bearish for the week with net selling of
QR75.0mn vs. net buying of QR347.3mn in the prior week. Qatari
institutions remained bearish with net selling of QR129.0mn vs. net
selling of QR204.1mn the week before. Foreign retail investors
remained bullish for the week with net buying of QR30.1mn vs. net
buying of QR40.4mn in the prior week. Qatari retail investors turned
bullish with net buying of QR174.4mn vs. net selling QR183.5mn the
week before. Thus far in 2014, the QE has already witnessed net
foreign portfolio investment inflow of ~$1.1bn.
Market Indicators
Week ended
May 01, 2014
Week ended
Apr 24, 2014
Chg. %
Value Traded (QR mn) 5,100.3 7,341.7 (30.5)
Exch. Market Cap. (QR mn) 725,688.2 796,220.0 (8.9)
Volume (mn) 134.2 212.8 (37.0)
Number of Transactions 54,785 77,279 (29.1)
Companies Traded 43 43 0.0
Market Breadth 6:36 34:8 –
Market Indices Close WTD% MTD% YTD%
Total Return 18,979.65 (1.8) 0.4 28.0
All Share Index 3,252.72 (2.4) 0.2 25.7
Banks/Financial Svcs. 3,097.67 (2.7) 0.2 26.8
Industrials 4,310.32 (3.2) 0.7 23.1
Transportation 2,368.22 0.1 0.8 27.4
Real Estate 2,623.62 0.2 0.8 34.3
Insurance 3,231.87 (4.2) (2.2) 38.3
Telecoms 1,703.72 (1.9) (0.2) 17.2
Consumer 7,372.48 (2.1) (0.5) 23.9
Al Rayan Islamic Index 4,195.24 (1.9) 0.1 38.2
Market Indices
Weekly Index Performance
Regional Indices Close WTD% MTD% YTD%
Weekly Exchange
Traded Value ($ mn)
Exchange Mkt.
Cap. ($ mn)
TTM P/E** P/B** Dividend Yield
Qatar (QE)* 12,727.64 (1.8) 0.4 22.6 1,400.87 199,346.6 15.9 2.1 3.9
Dubai 5,078.37 (0.2) 0.4 50.7 2,010.64 96,164.2 21.0 1.9 2.0
Abu Dhabi 5,058.44 (2.2) 0.3 17.9 1,044.90 137,741.6 15.3 1.9 3.5
Saudi Arabia 9,660.13 1.1 0.8 13.2 14,330.30 520,531.1#
19.1 2.3 3.0
Kuwait 7,430.95 (0.2) 0.3 (1.6) 366.24 115,506.1 16.6 1.2 4.1
Oman 6,744.41 (0.4) 0.3 (1.3) 250.23 24,385.0 12.0 1.6 3.9
Bahrain 1,427.33 0.6 0.0 14.3 6.59 53,431.7 9.9 1.0 4.8
Source: Bloomberg, country exchanges and Zawya (** Trailing Twelve Months; * Value traded ($ mn) do not include special trades, if any) (#Data as of April 30, 2014)
12,860.34
12,696.24
12,626.95
12,677.59
12,727.64
0
20,000,000
40,000,000
12,500
12,700
12,900
27-Apr 28-Apr 29-Apr 30-Apr 1-May
Volume QE Index
1.1%
0.6%
(0.2%) (0.2%) (0.4%)
(1.8%) (2.2%)(3.5%)
0.0%
3.5%
SaudiArabia
Bahrain
Dubai
Kuwait
Oman
Qatar
AbuDhabi
2. Page 2 of 5
News
Market & Corporate News
MSCI will cut weights of some Qatar, UAE stocks –
International equity index compiler MSCI will cut the weightings
of eight major Qatar and United Arab Emirates stocks when it
upgrades those countries to emerging market status, according
to a document seen by Reuters. The document, sent by MSCI
to financial firms at the end of last week, said the weightings of
those stocks — four in Qatar and four in the UAE — would be
reduced “as they may pose accessibility issues to international
institutional investors”. Repeated calls to MSCI’s London offices
for comment were not answered yesterday. MSCI decided last
year to lift Qatar and the UAE to emerging market from frontier
market status at the end of May 2014. On May 14, it is to
announce the final list of constituents of its revised emerging
market index. This is expected to attract fresh foreign money to
the two countries; some analysts have estimated each country
could draw over $2bn. Significant amounts of new money have
already started arriving. But in its document, MSCI said it would
“apply an adjustment factor of 0.5” to the weightings of
Industries Qatar, QNB Group, Commercial Bank and Doha
Bank. It said that as foreign money entered Qatar, overseas
investors might run out of room to buy shares in these
companies because of low ceilings for foreign ownership of
them. Some Qatari firms have been lifting their ceilings but for
Industries Qatar and QNB Group they are still low, MSCI said.
Investors have not said the UAE is as problematic as Qatar for
ownership ceilings, MSCI said. But it will apply the same
adjustment factor to Arabtec, Dana Gas, Dubai Islamic Bank
and Emaar Properties as foreigners could have trouble buying
their shares in future. MSCI added that it might reconsider its
decision to apply the adjustment factor to the eight stocks if
those companies raised their foreign ownership ceilings before
mid-May. (Reuters)
CBQK’s 1Q2014 profitability QoQ driven by a sharp drop in
net provisions and operating expenses – CBQK posted a
net profit of QR548mn, broadly in-line with our estimate of
QR532mn (Bloomberg consensus: QR447mn), up by ~8.3%
YoY (+ ~82.7% QoQ). Profitability on a QoQ basis was
primarily driven by a significant drop in net provisions and
operating expenses. The bank’s net provisions dropped by
~77.7% QoQ (down 14.7% YoY) to QR59.3mn. Moreover,
operating expenses also witnessed a sharp decline, dropping
by ~23.2% QoQ (+ ~66.8% YoY) to QR406.9mn. Net Interest
income slipped by ~1.8% QoQ (+36.8% YoY) to QR620.8mn.
Moreover, operating income was down ~7.8% QoQ (+24.3%
YoY) mainly due to muted investment income. Loans grew at a
healthy pace YTD. CBQK’s loan book grew by ~2.7% YTD,
reaching QR68.7bn. On the other hand, deposits receded by
~2.1% YTD to QR62.1bn. As such, the LDR jumped to 111% in
1Q2014 vs. 106% at the end of 2013. ABank contributed
~17.6% and ~13.8% to overall loans and deposits, respectively.
Asset quality marginally improved. CBQK’s NPL ratio
marginally improved in 1Q2014 to 3.55% vs. 3.65% at the end
of 2013. Moreover, the bank’s coverage ratio also improved,
climbing to 65.2% vs. 63.0% at the end of 2013. We maintain
our target price of QR79.02/share and rate the stock an
Accumulate. CBQK currently trades at a P/E and P/TBV of
11.1x and 1.4x on our 2014 estimates, respectively. (QNBFS
Research, CBQK Press Release)
IQCD posts QR1.59bn net profit in 1Q2014 missing our
estimate by 5.6% and consensus by 12.3% – Industries
Qatar (IQCD) posted a net profit of QR1.59bn in 1Q2014 vs.
our estimate of QR1.68bn and Bloomberg consensus estimate
of QR1.81bn. The group reported revenue of QR1.32bn (steel
segment only) for 1Q2014, down 20.6% as compared to
1Q2013. However, on a like-for-like basis, management
reporting revenue - assuming proportionate consolidation - was
QR4.2bn, a decrease of QR1.1bn (-20.9%). Results in the
quarter were impacted by planned maintenance-related
shutdowns. The Minister of Energy & Industry and IQCD
Chairman and Managing Director, HE Dr Mohamed bin Saleh
al-Sada said the timely completion of a significant proportion of
the group’s 2014 shut-down plan is an important development,
as it assures shareholders on the importance placed on regular
and thorough maintenance of the group’s assets. We maintain
our Market Perform rating along with a price target of
QR195.77. (QNBFS Research, Gulf-Times.com, Peninsula
Qatar)
ORDS reports QR887mn net profit in 1Q2014, up 73.9%
QoQ – Ooredoo (ORDS) reported a net profit of QR886.6mn in
1Q2014, up 73.9% on a QoQ basis (+9.7% YoY), supported by
an “other income” of QR395.8mn during the quarter. Other
income was mainly driven by positive FX trends in Indonesia
and sale of 5% stake in TBIG tower business leading to a gain
of QR131.8mn. The revenue decreased by 1.2% QoQ to
QR8,102.6mn in 1Q2014. On a YoY basis revenue fell by 3.4%
due to the challenging operating environment and depreciation
of the Indonesian Rupiah compared to 1Q2013, which was
partially offset by strong growth in data revenue. EPS
amounted to QR2.77 in 1Q2014 versus QR2.52 in 1Q2013.
ORDS’ customer base increase by 6.3% YoY to 96.7mn in the
1Q2014. Robust results were seen in Ooredoo operations in
Qatar, Oman and Algeria during the quarter. (ORDS Press
release, Gulf-Base.com)
MRDS reports QR22.3mn net profit in 1Q2014 – Mazaya
Qatar Real Estate Development Company (MRDS) posted a
net profit of QR22.3mn in 1Q2014 vs. QR2mn for the
corresponding period in 2013. EPS amounted to QR0.22 vs.
QR0.02 in 1Q2013. (QE)
QFLS reports QR229.3mn net profit in 1Q2014 – The Qatar
Fuel Company (QFLS) has posted a net profit of QR229.3mn in
1Q2014, up 12.3% vs. 1Q2013. EPS for 1Q2014 stood at
QR3.0 as compared to QR2.4 for 1Q2013. QFLS’ total assets
stood at QR9.1bn as compared to QR9.5bn for the same period
in 1Q2013. (Gulf-Times.com)
BRES reports QR265.1mn net profit in 1Q2014 – Barwa Real
Estate Company (BRES) has reported a net profit of
QR265.1mn in 1Q2014 as compared to QR158.5mn for the
corresponding period in 2013. EPS amounted to QR0.68 in
1Q2014 versus QR0.41 in 1Q2013. (QE)
S&P: Insurance sector carries intermediate risk – Standard
& Poor’s Ratings Services (S&P) in its latest insurance industry
and country risk assessment has assessed Qatar as
‘intermediate’. S&P noted that its assessment reflects the risks
typically faced by (property/casualty) insurers operating in
Qatar and is derived from its view of intermediate country risk
and intermediate industry risk for the P/C insurance sector.
S&P added that the market is highly competitive, particularly in
commoditized segments such as motor vehicle and medical
insurance, although product risk in these segments is low.
Nevertheless, S&P expects profitability and growth prospects to
remain favorable, particularly in commercial lines as the level of
insurable activity in Qatar increases. (GulfBase.com)
3. Page 3 of 5
Qatar Exchange
Top 5 Gainers Top 5 Decliners
Source: Qatar Exchange (QE) Source: Qatar Exchange (QE)
Most Active Shares by Value (QR Million) Most Active Shares by Volume (Million)
Source: Qatar Exchange (QE) Source: Qatar Exchange (QE)
Investor Trading Percentage to Total Value Traded Net Traded Value by Nationality (QR Million)
Source: Qatar Exchange (QE) Source: Qatar Exchange (QE)
5.1%
4.7%
3.3%
3.1%
2.1%
0.0%
2.0%
4.0%
6.0%
United
Development
Medicare
Group
Zad Holding Qatar Gas
Transport
(Nakilat)
Islamic Holding
Group
-40.8%
-19.0%
-13.5%
-12.1%
-7.9%
-45.0%
-30.0%
-15.0%
0.0%
Ezdan Real
Estate
Aamal Mannai Corp. National
Leasing
Qatar German
Co. for Medical
Devices
851.8
664.1
346.8
278.8 273.3
0.0
300.0
600.0
900.0
United
Development
Barwa Real
Estate
Industries
Qatar
Masraf Al
Rayan
Mazaya Qatar
32.9
17.3
13.4
8.2
7.0
0.0
15.0
30.0
45.0
United
Development
Barwa Real
Estate
Mazaya Qatar Qatar Gas
Transport
(Nakilat)
Vodafone Qatar
0%
20%
40%
60%
80%
100%
Buy Sell
54.79% 51.37%
16.60% 19.13%
16.03% 15.44%
12.59% 14.06%
Qatari Individuals Qatari Institutions
Non-Qatari Individuals Non-Qatari Institutions
3,641
1,460
3,596
1,505
45
(45)
(500) - 500 1,000 1,500 2,000 2,500 3,000 3,500 4,000
Qatari
Non-Qatari
Net Investment Total Sold Total Bought
4. Page 4 of 5
TECHNICAL ANALYSIS OF THE QE INDEX
Source: Bloomberg
The QE Index snapped its six-week winning streak and declined around 227 points to close at 12,727.64, registering a fall of 1.8% over last week. The
index failed to make any further headway after recording an all-time high of 12,968.46. Thereafter, the index moved south for the first three trading sessions
as traders booked profits at a higher level. However, the index witnessed a bounce back on Wednesday and Thursday, as it made a smart recovery from its
weekly low of 12,515.43 on the back of sustained buying interest. This helped the index to recover majority of its losses experienced during the week. In the
previous week, the index faced a lot of volatility and corrected itself, which is a good sign on a long-term basis. We believe the uptrend of the index remains
intact until its trades above 12,500.0. Further, the index faces its immediate important resistance near 12,770.0, which it needs to surpass in order to gain
further momentum and continue its rally toward 12,940.0. On the downside, if the index penetrates below the support near 12,680.0, it could test the next
strong support close to the 12,500.0 level, which is also in proximity to the 21-day moving average (currently at 12,511.85) where buyers can re-enter.
Meanwhile, both the momentum indicators are providing mixed signals. Thus, we expect the volatility to continue for the week.
DEFINITIONS OF KEY TERMS USED IN TECHNICAL ANALYSIS
RSI (Relative Strength Index) indicator – RSI is a momentum oscillator that measures the speed and change of price movements. The RSI oscillates
between 0 to 100. The index is deemed to be overbought once the RSI approaches the 70 level, indicating that a correction is likely. On the other hand, if
the RSI approaches 30, it is an indication that the index may be getting oversold and therefore likely to bounce back.
MACD (Moving Average Convergence Divergence) indicator – The indicator consists of the MACD line and a signal line. The divergence or the
convergence of the MACD line with the signal line indicates the strength in the momentum during the uptrend or downtrend, as the case may be. When the
MACD crosses the signal line from below and trades above it, it gives a positive indication. The reverse is the situation for a bearish trend.
Candlestick chart – A candlestick chart is a price chart that displays the high, low, open, and close for a security. The ‘body’ of the chart is portion between
the open and close price, while the high and low intraday movements form the ‘shadow’. The candlestick may represent any time frame. We use a one-day
candlestick chart (every candlestick represents one trading day) in our analysis.
Doji candlestick pattern – A Doji candlestick is formed when a security's open and close are practically equal. The pattern indicates indecisiveness, and
based on preceding price actions and future confirmation, may indicate a bullish or bearish trend reversal.
Shooting Star/Inverted Hammer candlestick patterns – These candlestick patterns have a small real body (open price and close price are near to each
other), and a long upper shadow (large intraday movement on the upside). The Shooting Star is a bearish reversal pattern that forms after a rally. The
Inverted Hammer looks exactly like a Shooting Star, but forms after a downtrend. Inverted Hammers represent a potential bullish trend reversal.
5. Contacts
Saugata Sarkar Keith Whitney Sahbi Kasraoui
Head of Research Head of Sales Manager - HNWI
Tel: (+974) 4476 6534 Tel: (+974) 4476 6533 Tel: (+974) 4476 6544
saugata.sarkar@qnbfs.com.qa keith.whitney@qnbfs.com.qa sahbi.alkasraoui@qnbfs.com.qa
QNB Financial Services SPC
Contact Center: (+974) 4476 6666
PO Box 24025, Doha, Qatar
DISCLAIMER: This publication has been prepared by QNB Financial Services SPC (“QNBFS”) a wholly-owned subsidiary of Qatar National Bank (“QNB”). QNBFS is regulated by the Qatar
Financial Markets Authority and the Qatar Exchange; QNB is regulated by the Qatar Central Bank. This publication expresses the views and opinions of QNBFS at a given time only. It is not an
offer, promotion or recommendation to buy or sell securities or other investments, nor is it intended to constitute legal, tax, accounting, or financial advice. We therefore strongly advise potential
investors to seek independent professional advice before making any investment decision. Although the information in this report has been obtained from sources that QNBFS believes to be
reliable, we have not independently verified such information and it may not be accurate or complete. While this publication has been prepared with the utmost degree of care by our analysts,
QNBFS does not make any representations warranties as to the accuracy and completeness of the information it may contain, and declines any liability in that respect. QNBFS reserves the right
to amend the views and opinions expressed in this publication at any time. It may also express viewpoints or make investment decisions that differ significantly from, or even contradict, the views
and opinions included in this report.
COPYRIGHT: No part of this document may be reproduced without the explicit written permission of QNBFS.
Page 5 of 5
Source: Bloomberg
Company Name
Price
(May 01)
% Change
5-Day
% Change
YTD
Market Cap.
QR Million TTM P/E P/B Div. Yield
Qatar National Bank 191.50 (3.04) 11.34 133,998 13.7 2.7 3.7
Qatar Islamic Bank 87.20 (1.47) 26.38 20,605 15.0 1.8 4.6
Commercial Bank of Qatar 68.50 (2.56) 16.10 20,340 12.5 1.3 2.4
Doha Bank 65.00 (3.85) 11.68 16,794 11.8 1.5 6.9
Al Ahli Bank 53.00 0.00 25.27 8,755 16.2 2.3 N/A
Qatar International Islamic Bank 84.40 (1.63) 36.79 12,776 16.6 2.6 4.4
Masraf Al Rayan 47.45 (2.47) 51.60 35,588 20.5 3.6 3.2
Al Khaliji Bank 22.60 (2.59) 13.06 8,136 15.4 1.5 4.4
National Leasing 28.75 (12.08) (4.64) 1,423 16.3 1.1 5.2
Dlala Holding 33.30 (5.80) 50.68 739 N/M 3.3 N/A
Qatar & Oman Investment 14.75 (2.64) 17.81 465 23.4 1.4 4.1
Islamic Holding Group 72.00 2.13 56.52 288 29.1 4.9 2.4
Banking and Financial Services 259,906
Zad Holding 79.00 3.27 13.67 1,033 12.0 0.8 4.4
Qatar German Co. for Medical Devices 14.19 (7.86) 2.45 164 N/M 0.9 N/A
Salam International Investment 14.25 (3.06) 9.53 1,629 14.3 1.0 7.0
Medicare Group 89.00 4.71 69.52 2,505 25.2 3.3 2.0
Qatar Cinema & Film Distribution 41.00 (3.53) 2.24 234 20.5 1.6 N/A
Qatar Fuel 245.90 (3.15) 12.52 20,769 17.2 3.5 3.1
Qatar Meat and Livestock 60.50 (2.42) 17.02 1,089 20.3 4.4 3.5
Al Meera Consumer Goods 185.80 (1.64) 39.38 3,716 16.9 3.0 4.3
Consumer Goods and Services 31,139
Qatar Industrial Manufacturing 46.60 (4.02) 10.51 2,214 10.7 1.6 N/A
Qatar National Cement 143.00 (0.69) 20.17 7,021 15.7 2.7 4.2
Industries Qatar 182.40 (1.41) 7.99 110,352 15.7 3.8 6.0
Qatari Investors Group 66.00 (1.64) 51.03 8,206 36.3 3.9 1.1
Qatar Electricity and Water 183.30 (1.45) 10.85 20,163 13.6 3.5 3.7
Mannai Corp. 105.40 (13.54) 17.24 4,808 9.5 2.2 5.2
Aamal 16.22 (18.98) 8.13 9,732 19.3 1.4 N/A
Gulf International Services 89.30 (0.78) 82.99 16,596 22.8 5.6 1.8
Mesaieed Petrochemical Holding 34.60 (3.22) N/A 43,469 N/M 3.2 1.0
Industrials 222,561
Qatar Insurance 75.40 (3.33) 41.73 12,105 15.0 2.3 2.7
Doha Insurance 24.27 (7.37) (2.92) 625 9.1 1.1 8.2
Qatar General Insurance & Reinsurance 43.00 (5.49) 7.72 2,975 1.4 0.6 2.9
Al Khaleej Takaful Insurance 38.00 (5.00) 35.34 844 12.8 1.4 N/A
Qatar Islamic Insurance 74.20 (5.60) 28.15 1,113 17.5 4.0 5.1
Insurance 17,661
United Development 25.65 5.12 19.12 9,082 19.6 0.9 3.7
Barw a Real Estate 38.15 (1.68) 28.02 14,845 10.0 1.1 5.2
Ezdan Real Estate 29.80 (40.76) 75.29 79,044 N/M 2.7 1.0
Mazaya Qatar Real Estate Development 20.23 (5.91) 80.95 2,023 15.1 1.7 3.7
Real Estate 104,995
Qatar Telecom 147.00 (0.68) 7.14 47,087 17.7 1.9 2.7
Vodafone Qatar 16.79 (6.51) 56.77 14,194 N/M 2.4 N/A
Telecoms 61,281
Qatar Navigation (Milaha) 97.00 (3.96) 16.87 11,109 11.6 0.9 5.2
Gulf Warehousing 56.30 1.26 35.66 2,678 24.3 3.5 2.7
Qatar Gas Transport (Nakilat) 24.59 3.10 21.43 13,770 17.9 3.8 4.5
Transportation 27,557
Qatar Exchange 725,099