The Abortion pills for sale in Qatar@Doha [+27737758557] []Deira Dubai Kuwait
Weekly Market Report
1. Market Review and Outlook
QE Index and Volume
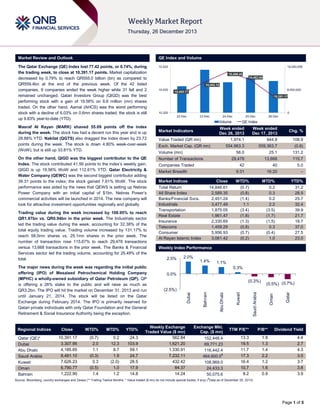
The Qatar Exchange (QE) Index lost 77.42 points, or 0.74%, during
the trading week, to close at 10,391.17 points. Market capitalization
decreased by 0.79% to reach QR555.0 billion (bn) as compared to
QR559.4bn at the end of the previous week. Of the 42 listed
companies, 9 companies ended the week higher while 31 fell and 2
remained unchanged. Qatari Investors Group (QIGD) was the best
performing stock with a gain of 19.56% on 6.6 million (mn) shares
traded. On the other hand, Aamal (AHCS) was the worst performing
stock with a decline of 6.03% on 0.6mn shares traded; the stock is still
up 9.83% year-to-date (YTD).
10,520
Regional Indices
Qatar (QE)*
Dubai
Abu Dhabi
Saudi Arabia
Kuwait
Oman
Bahrain
Close
10,391.17
3,307.95
4,185.65
8,481.10
7,626.23
6,790.77
1,222.90
WTD%
MTD%
YTD%
(0.7)
2.0
1.1
(0.3)
0.3
(0.5)
1.4
0.2
12.3
8.7
1.9
(2.0)
1.0
1.2
24.3
103.9
59.1
24.7
28.5
17.9
14.8
10,391.17
10,320
0
22-Dec
23-Dec
24-Dec
25-Dec
Volume
26-Dec
QE Index
Week ended
Dec 26, 2013
1,974.1
Week ended
Dec 17, 2013
944.8
554,963.3
559,363.7
(0.8)
58.0
25.1
131.2
29,478
13,668
115.7
42
40
5.0
Market Breadth
9:31
16:20
–
Market Indices
Close
Total Return
14,846.61
All Share Index
2,589.35
Banks/Financial Svcs.
2,451.24
Industrials
3,477.49
Transportation
1,875.05
Real Estate
1,961.47
Insurance
2,330.69
Telecoms
1,459.29
Consumer
5,956.93
Al Rayan Islamic Index
3,061.42
Market Indices
Weekly Index Performance
WTD%
(0.7)
(0.8)
(1.4)
1.1
(3.4)
(1.8)
(1.3)
(0.8)
(0.7)
(0.2)
Market Indicators
Value Traded (QR mn)
Exch. Market Cap. (QR mn)
Volume (mn)
Number of Transactions
Companies Traded
2.5%
2.0%
1.4%
Chg. %
108.9
MTD%
0.2
0.3
0.2
2.2
(3.5)
(1.7)
(1.5)
0.3
(0.4)
1.0
YTD%
31.2
28.5
25.7
32.4
39.9
21.7
18.7
37.0
27.5
23.0
1.1%
0.3%
0.0%
Weekly Exchange
Traded Value ($ mn)
562.84
1,621.20
1,330.91
7,232.11
432.42
84.37
14.24
Qatar
(0.5%) (0.7%)
Oman
(2.5%)
Saudi Arabia
(0.3%)
Kuwait
The major news during the week was regarding the initial public
offering (IPO) of Mesaieed Petrochemical Holding Company
(MPHC) a wholly-owned subsidiary of Qatar Petroleum (QP). QP
is offering a 26% stake to the public and will raise as much as
QR3.2bn. The IPO will hit the market on December 31, 2013 and run
until January 21, 2014. The stock will be listed on the Qatar
Exchange during February 2014. The IPO is primarily reserved for
Qatari private individuals with only Qatar Foundation and the General
Retirement & Social Insurance Authority being the exception.
8,000,000
10,402.77
Abu Dhabi
Trading value during the week increased by 108.95% to reach
QR1.97bn vs. QR0.94bn in the prior week. The Industrials sector
led the trading value during the week, accounting for 32.38% of the
total equity trading value. Trading volume increased by 131.17% to
reach 58.0mn shares vs. 25.1mn shares in the prior week. The
number of transaction rose 115.67% to reach 29,478 transactions
versus 13,668 transactions in the prior week. The Banks & Financial
Services sector led the trading volume, accounting for 25.49% of the
total.
10,453.15
10,420
Bahrain
On the other hand, QIGD was the biggest contributor to the QE
Index. The stock contributed 41.56 points to the index‟s weekly gain.
QIGD is up 19.56% WoW and 112.61% YTD. Qatar Electricity &
Water Company (QEWC) was the second biggest contributor adding
39.31 points to the index; the stock gained 7.91% WoW. The stock
performance was aided by the news that QEWS is setting up Nebras
Power Company with an initial capital of $1bn. Nebras Power‟s
commercial activities will be launched in 2014. The new company will
look for attractive investment opportunities regionally and globally.
10,462.54
Dubai
Masraf Al Rayan (MARK) shaved 55.09 points off the index
during the week. The stock has had a decent run this year and is up
28.88% YTD. Nakilat (QGTS) also dragged the index down by 23.72
points during the week. The stock is down 4.80% week-over-week
(WoW), but is still up 33.81% YTD.
16,000,000
10,498.45
Exchange Mkt.
Cap. ($ mn)
TTM P/E**
P/B**
Dividend Yield
152,448.4
69,771.23
116,442.4
464,600.0#
108,969.0
24,433.3
50,075.6
13.3
19.5
11.7
17.3
16.4
10.7
8.2
1.8
1.3
1.4
2.2
1.2
1.6
0.9
4.4
2.7
4.3
3.5
3.7
3.8
3.9
#
Source: Bloomberg, country exchanges and Zawya (** Trailing Twelve Months; * Value traded ($ mn) do not include special trades, if any) ( Data as of December 25, 2013)
Page 1 of 5
2. News
Economic News
MDPS: Qatar forex reserves strong enough to cover for 6month imports – According to a report released by the Ministry
of Development Planning & Statistics (MDPS), Qatar‟s foreign
exchange cover is likely to remain “strong”, equivalent to
around six months of total imports. The ministry asserted this in
its report, which, however, found the country‟s external current
account surplus to drift down in 2013 and 2014, but remain
sizeable at 26.6% and 22.7% of GDP in 2013 and 2014,
respectively. The report said an expected decline in
hydrocarbon export revenue, coupled with higher imports on
the back of stronger domestic demand, will narrow the surplus.
Since a bulk of these surpluses are recycled in overseas
investments funded by export earnings, the overall surplus on
the balance of payments will be much smaller than the current
account surplus and is likely to fall to $5.5bn in 2013 and to
$1.5bn in 2014. Qatar posted a trade surplus of QR200.3bn in
1H2013, equivalent to 54.7% of nominal GDP. In contrast to the
sharp import growth in 2011 and 1H2012, Qatar Central Bank‟s
estimate of imports fell in 2H2012 and subsequently fell further
by 9.4% in 1H2013. The report indicated that the decline may
reflect a strong base effect as a consequence of sizeable
imports of machinery and materials in 2011 and 2012, although
it could be a reflection of short-run or seasonal influences that
will dissipate. The report stated that export revenues rose 4.4%
in 1H2013, mainly on oil & gas as non-hydrocarbon exports are
still small, accounting for just 12.2% of the total. According to
the report, the deficits on income & services accounts and large
outward remittances (19.3% of nominal GDP), yielded a “stout”
current account surplus of 35.4%. According to MDPS
estimates, on the real effective exchange rate (REER), Qatar‟s
REER stood 3.1% lower in June 2013 as compared to the 2012
period. This was largely because the US dollar (to which the
riyal is pegged) lost value against the currencies of Qatar‟s
major trading partners. (Gulf-Times.com)
Qatar CPI unchanged in November – According to a report by
the Ministry of Development Planning & Statistics (MDPS), the
Consumer Price Index that denotes inflation remained
unchanged in November at 115.5 as compared to the previous
month. However, the index showed an increase of 2.8% when
compared to the CPI of November, 2012. With the exception of
the group that comprises rent, fuel and energy, all others
declined in terms of prices. The index pertaining to rent, fuel,
and energy showed an increase of 0.7%. (Gulf-Times.com)
Market & Corporate News
MPHC offers 26% stake to raise QR3.2bn – Mesaieed
Petrochemical Holding Company (MPHC) – a wholly-owned
subsidiary of Qatar Petroleum (QP) – is offering a 26% stake to
the public to raise as much as QR3.2bn. The IPO, which will hit
the market on December 31 and run until January 21, will
eventually see MPHC – a holding entity for Q-Chem I, Q-Chem
II and Qatar Vinyl Company (QVC) – getting listed on the Qatar
Exchange by February 2014. MPHC is offering 323.19mn
ordinary shares at QR10.2 per share (including the listing fees
of QR0.2). The minimum subscription for individual investors is
50 shares and the maximum is 1mn. The maiden offer is being
undertaken as part of QP‟s 10-year investment and savings
program intended to encourage long-term investments and
personal savings among its citizens. The IPO is primarily
reserved for Qatari private individuals, which Qatari private
institutions or corporations cannot subscribe. But, Qatar
Foundation and the General Retirement & Social Insurance
Authority can partake in the subscription. Moreover, QP, which
will retain 74% stake after the IPO, is also offering “incentive”
shares to Qatari nationals, who subscribe in the IPO, after five
and 10 years (2018 and 2023 respectively), provided they
retain at least 50% of their shares purchased in the offering at
all times. For each share purchase in the IPO, each qualifying
investors will receive one additional incentive share, free of
charge over the period, thus encouraging long-term
investments. The lead receiving banks for the IPO are QNB (all
branches), Ahlibank Qatar (ABQK), Al khaliji (KCBK), Arab
Bank, Barwa Bank, Commercial Bank (CBQK), Doha Bank
(DHBK), Qatar International Islamic Bank (QIIK), Mashreq
Bank, Masraf Al Rayan (MARK), International Bank of Qatar
and Qatar Islamic Bank (QIBK) (selected branches). (GulfTimes.com)
QE geared up to trade MPHC shares – Qatar Exchange CEO
Rashid Al Mansouri said the exchange is well-equipped to trade
the 300mn plus shares of Mesaieed Petrochemical Holding
Company (MPHC), entering the primary market from December
31, 2013. The bourse is well prepared for trading of the shares
in February 2014, when the MPHC listing is expected. He
further added that the entry of MPHC shares in the market will
help boost the bourse‟s average trading volume. The local
market is capable of absorbing more IPOs. (Peninsula Qatar)
QEWS unveils near launch of commercial activities of
Nebras Power – Qatar Electricity & Water Company‟s (QEWS)
General Manager Fahad Hamad Al Mohannadi has unveiled
the near launch of commercial activities of Nebras Power
Company with an initial capital of $1bn. Al Mohannadi said
Nebras Power‟s commercial activities will be launched in
1H2014. The company will immediately look for attractive
investment opportunities regionally and globally. Al Mohannadi
further added that a five-year plan will be developed, which will
be effective from 1Q2014. Meanwhile, QEWS has two
investment streams to invest in the electricity and water
sectors, one locally through QEWS and another internationally
through Nebras Power. (QE)
Nakilat Shipyard JVs receive QR583mn financing from Al
Khaliji – Nakilat Shipyard JVs have received a total financing of
QR583mn from Al Khaliji. Al Khaliji has provided QR437mn
financing to Nakilat-Keppel Offshore & Marine (N-KOM) and
QR146mn to Nakilat Damen Shipyards Qatar (NDSQ). (GulfTimes.com)
Capital Intelligence upgrades Ahlibank financial strength
rating to “A-” – Capital Intelligence (CI) has upgraded
Ahlibank‟s financial strength rating upgraded to “A-” from
“BBB+” and support rating to “1” from “2”. The agency raised
the bank‟s long-term foreign currency rating (FCR) to “A” from
“A-”, while affirming the short-term FCR at “A2”. (GulfTimes.com)
Qatar Steel International to build iron & steel complex in
Bellara – Qatar Steel International and Algerian company Sider
have signed a partnership agreement for the construction of an
iron & steel complex in Bellara, Jijel, 359 kilometers east of
Algiers. The $2bn project is expected to be completed in three
years. (Gulf-Times.com)
Ooredoo rolls out commercial 3G network in Algeria –
Ooredoo has launched the first commercial 3G network in
Algeria. Within hours of receiving the final regulatory approval,
Ooredoo Algeria has launched its commercial 3G services for
millions of customers in 10 major cities across the country.
(Peninsula Qatar)
Page 2 of 5
3. Qatar Exchange
Top 5 Gainers
Top 5 Decliners
0.0%
20.0%
19.6%
-2.0%
15.0%
-3.1%
-4.0%
10.0%
7.9%
7.9%
5.5%
-4.9%
-4.8%
Qatar German
Co. for
Medical
Devices
Qatar Gas
Transport
(Nakilat)
-5.2%
5.4%
-6.0%
5.0%
-6.0%
0.0%
-8.0%
Qatari
Investors
Group
Salam
Qatar
Islamic
Qatar National
International Electricity and Holding Group
Cement
Investment
Water
Source: Qatar Exchange (QE)
Aamal
Masraf Al
Rayan
United
Development
Source: Qatar Exchange (QE)
Most Active Shares by Value (QR Million)
Most Active Shares by Volume (Million)
400.0
10.0
323.8
8.4
300.0
275.3
8.0
7.9
7.5
200.0
6.6
4.6
5.0
134.8
131.4
104.7
100.0
2.5
0.0
0.0
Qatari
Investors
Group
Masraf Al
Rayan
Barwa Real
Estate
Industries
Qatar
United
Development
Source: Qatar Exchange (QE)
80%
15.46%
15.61%
Vodafone
Qatar
Salam
International
Investment
United
Development
Net Traded Value by Nationality (QR Million)
127
9.86%
14.77%
Non-Qatari
486
613
27.97%
60%
Qatari
Investors
Group
Source: Qatar Exchange (QE)
Investor Trading Percentage to Total Value Traded
100%
Masraf Al
Rayan
28.19%
40%
40.74%
(127)
47.41%
20%
Qatari
1,488
1,361
0%
Buy
Sell
Qatari Individuals
Qatari Institutions
Non-Qatari Individuals
Non-Qatari Institutions
Source: Qatar Exchange (QE)
(400)
(200)
-
200
Net Investment
400
600
800
Total Sold
1,000 1,200 1,400 1,600
Total Bought
Source: Qatar Exchange (QE)
Page 3 of 5
4. TECHNICAL ANALYSIS OF THE QE INDEX
Source: Bloomberg
The QE Index ended last week‟s volatile session on a negative note as bears proved to be more dominant than the bulls. The index started the week on a
bearish note but recouped its losses on Monday and Tuesday as it witnessed a stunning recovery near the 10,320.0 level, pushing it to a higher level.
However, the rally was short-lived as the index erased all its gains on Wednesday and Thursday as it failed to make any further headway above 10,520.0,
and drifted lower penetrating below the important supports of 10,445.44 and the 21-day moving average (currently at 10,421.20). The index is currently
trading close to the key support of the long-term ascending trendline. If the index dips below this trendline, it may result in a lower move and test the
immediate support near the 10,360.0 level. Any sustained weakness below this level may have bearish implications, resulting in a pullback toward the
10,300.0 level. We believe the bears may continue to overpower the bulls as long as it trades below the 21-day moving average and the 10,445.44 level.
Bulls may only come in action when the index surpasses these two levels. Meanwhile, both momentum indicators are moving down and are providing
bearish signals, suggesting a likely downmove.
DEFINITIONS OF KEY TERMS USED IN TECHNICAL ANALYSIS
RSI (Relative Strength Index) indicator – RSI is a momentum oscillator that measures the speed and change of price movements. The RSI oscillates
between 0 to 100. The index is deemed to be overbought once the RSI approaches the 70 level, indicating that a correction is likely. On the other hand, if
the RSI approaches 30, it is an indication that the index may be getting oversold and therefore likely to bounce back.
MACD (Moving Average Convergence Divergence) indicator – The indicator consists of the MACD line and a signal line. The divergence or the
convergence of the MACD line with the signal line indicates the strength in the momentum during the uptrend or downtrend, as the case may be. When the
MACD crosses the signal line from below and trades above it, it gives a positive indication. The reverse is the situation for a bearish trend.
Candlestick chart – A candlestick chart is a price chart that displays the high, low, open, and close for a security. The „body‟ of the chart is portion between
the open and close price, while the high and low intraday movements form the „shadow‟. The candlestick may represent any time frame. We use a one-day
candlestick chart (every candlestick represents one trading day) in our analysis.
Doji candlestick pattern – A Doji candlestick is formed when a security's open and close are practically equal. The pattern indicates indecisiveness, and
based on preceding price actions and future confirmation, may indicate a bullish or bearish trend reversal.
Shooting Star/Inverted Hammer candlestick patterns – These candlestick patterns have a small real body (open price and close price are near to each
other), and a long upper shadow (large intraday movement on the upside). The Shooting Star is a bearish reversal pattern that forms after a rally. The
Inverted Hammer looks exactly like a Shooting Star, but forms after a downtrend. Inverted Hammers represent a potential bullish trend reversal.
Page 4 of 5
5. Price % Change 5(Dec 26)
Day
% Change
YTD
Market Cap.
QR Million
TTM P/E
P/B
Div. Yield
120,843
13.1
2.4
3.5
(8.00)
16,304
15.1
1.4
5.4
0.14
(0.85)
17,395
9.9
1.3
8.5
58.00
0.17
25.10
14,986
10.2
1.7
7.2
Al Ahli Bank
56.00
0.00
14.29
7,116
13.7
2.1
5.4
Qatar International Islamic Bank
60.20
(0.33)
15.77
9,112
12.7
1.8
5.8
Masraf Al Rayan
31.95
(5.19)
28.88
23,963
14.3
2.4
3.1
Al Khaliji Bank
19.80
(0.85)
16.54
7,128
13.4
1.3
5.1
National Leasing
30.00
(2.60)
(33.63)
1,484
12.7
1.1
6.7
Dlala Holding
23.10
3.59
(25.68)
513
N/M
2.3
N/A
Qatar & Oman Investment
12.62
0.00
1.86
398
26.5
1.2
4.0
Islamic Holding Group
44.00
5.52
15.79
176
23.6
3.1
2.6
Company Name
172.70
(0.75)
31.93
Qatar Islamic Bank
69.00
(1.43)
Commercial Bank of Qatar
70.30
Doha Bank
Qatar National Bank
219,418
Banking and Financial Services
Zad Holding
68.50
(1.15)
16.50
896
9.1
0.7
5.8
Qatar German Co. for Medical Devices
13.70
(4.86)
(7.31)
158
N/M
0.8
N/A
Salam International Investment
13.35
7.92
5.45
1,526
11.8
0.9
5.2
Medicare Group
52.60
(0.75)
47.34
1,480
24.1
1.9
3.4
Qatar Cinema & Film Distribution
40.20
(0.74)
(29.35)
230
30.7
1.7
5.0
284.00
(1.39)
29.09
18,451
15.4
3.1
3.5
53.40
(2.02)
(9.18)
961
16.0
3.9
7.5
132.00
(0.38)
7.84
2,640
18.1
2.1
6.1
Qatar Fuel
Qatar Meat and Livestock
Al Meera Consumer Goods
26,343
Consumer Goods and Services
(0.20)
(5.08)
1,996
9.5
1.5
6.0
Qatar National Cement
117.50
50.40
5.38
9.81
5,769
13.5
2.3
5.1
Industries Qatar
166.00
(0.90)
17.73
100,430
12.4
3.1
4.7
Qatar Industrial Manufacturing
48.90
19.56
112.61
6,080
26.1
2.9
1.5
180.00
7.91
35.95
18,000
11.9
3.2
4.1
Mannai Corp.
90.00
2.97
11.11
4,106
8.9
1.8
5.3
Aamal
14.95
(6.03)
9.83
8,970
14.2
1.3
N/A
Gulf International Services
59.90
(2.12)
99.67
8,905
14.7
3.1
2.5
Qatari Investors Group
Qatar Electricity and Water
154,256
Industrials
Qatar Insurance
65.60
(1.35)
21.59
8,425
10.3
1.7
3.1
Doha Insurance
25.15
(1.76)
2.46
647
11.5
1.3
3.6
Qatar General Insurance & Reinsurance
49.00
(1.01)
6.52
2,825
3.3
0.8
1.8
Al Khaleej Takaful Insurance
38.75
(0.13)
5.68
662
13.8
1.1
2.2
Qatar Islamic Insurance
57.00
(2.06)
(8.06)
855
13.4
3.1
6.1
13,414
Insurance
United Development
22.51
(3.14)
26.46
7,591
9.3
0.7
4.4
Barwa Real Estate
30.05
(0.99)
9.47
11,693
17.1
0.9
5.0
Ezdan Real Estate
16.90
(2.03)
(7.14)
44,827
N/M
1.6
0.8
Mazaya Qatar Real Estate Development
11.42
(0.09)
3.82
1,142
17.3
1.1
5.3
65,253
Real Estate
137.00
(0.51)
31.73
43,884
16.6
1.8
3.6
11.08
(2.38)
32.69
9,367
N/M
1.6
N/A
Qatar Navigation (Milaha)
84.20
(2.09)
33.44
9,643
9.9
0.8
4.5
Gulf Warehousing
41.00
(1.20)
22.39
1,950
19.6
2.5
N/A
Qatar Gas Transport (Nakilat)
Transportation
20.42
(4.80)
33.81
11,435
15.0
3.2
4.9
Qatar Telecom
Vodafone Qatar
53,251
Telecoms
23,028
Qatar Exchange
554,963
Source: Bloomberg
Contacts
Saugata Sarkar
Ahmed M. Shehada
Keith Whitney
Sahbi Kasraoui
Head of Research
Head of Trading
Head of Sales
Manager - HNWI
Tel: (+974) 4476 6534
Tel: (+974) 4476 6535
Tel: (+974) 4476 6533
Tel: (+974) 4476 6544
saugata.sarkar@qnbfs.com.qa
ahmed.shehada@qnbfs.com.qa
keith.whitney@qnbfs.com.qa
sahbi.alkasraoui@qnbfs.com.qa
QNB Financial Services SPC
Contact Center: (+974) 4476 6666
PO Box 24025, Doha, Qatar
DISCLAIMER: This publication has been prepared by QNB Financial Services SPC (“QNBFS”) a wholly-owned subsidiary of Qatar National Bank (“QNB”). QNBFS is regulated by the Qatar
Financial Markets Authority and the Qatar Exchange; QNB is regulated by the Qatar Central Bank. This publication expresses the views and opinions of QNBFS at a given time only. It is not an
offer, promotion or recommendation to buy or sell securities or other investments, nor is it intended to constitute legal, tax, accounting, or financial advice. We therefore strongly advise potential
investors to seek independent professional advice before making any investment decision. Although the information in this report has been obtained from sources that QNBFS believes to be
reliable, we have not independently verified such information and it may not be accurate or complete. While this publication has been prepared with the utmost degree of care by our analysts,
QNBFS does not make any representations warranties as to the accuracy and completeness of the information it may contain, and declines any liability in that respect. QNBFS reserves the right
to amend the views and opinions expressed in this publication at any time. It may also express viewpoints or make investment decisions that differ significantly from, or even contradict, the views
and opinions included in this report.
COPYRIGHT: No part of this document may be reproduced without the explicit written permission of QNBFS.
Page 5 of 5