Weekly market report
•
1 gefällt mir•490 views

The Qatar Exchange Index lost 2.94% over the week to close at 9,580.77 points, as market capitalization decreased by 2.85% to QR522 billion. Of the 42 listed companies, 8 increased while 32 declined and 2 remained unchanged. Trading value decreased 17.39% to QR1.4 billion while trading volume fell 36.38% to 27.3 million shares. Foreign institutions were net sellers of QR103.7 million worth of equities. We remain positive on the long-term outlook for Qatari equities and recommend accumulating strong companies on dips.

Empfohlen
Weitere ähnliche Inhalte
Was ist angesagt?
Was ist angesagt? (20)
Andere mochten auch
Ähnlich wie Weekly market report
Ähnlich wie Weekly market report (20)
Mehr von QNB Group
Mehr von QNB Group (20)
Kürzlich hochgeladen
Kürzlich hochgeladen (20)
Weekly market report
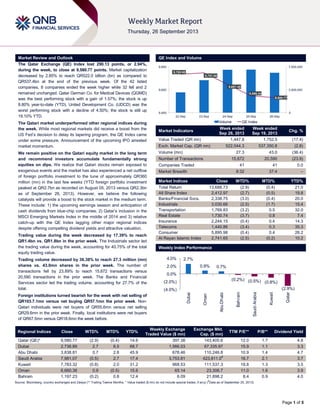
- 1. Page 1 of 5 Market Review and Outlook QE Index and Volume The Qatar Exchange (QE) Index lost 290.13 points, or 2.94%, during the week, to close at 9,580.77 points. Market capitalization decreased by 2.85% to reach QR522.0 billion (bn) as compared to QR537.4bn at the end of the previous week. Of the 42 listed companies, 8 companies ended the week higher while 32 fell and 2 remained unchanged. Qatar German Co. for Medical Devices (QGMD) was the best performing stock with a gain of 1.57%; the stock is up 8.80% year-to-date (YTD). United Development Co. (UDCD) was the worst performing stock with a decline of 4.50%; the stock is still up 19.10% YTD. The Qatari market underperformed other regional indices during the week. While most regional markets did receive a boost from the US Fed‟s decision to delay its tapering program, the QE Index came under some pressure. Announcement of the upcoming IPO arrested market momentum. We remain positive on the Qatari equity market in the long term and recommend investors accumulate fundamentally strong equities on dips. We realize that Qatari stocks remain exposed to exogenous events and the market has also experienced a net outflow of foreign portfolio investment to the tune of approximately QR360 million (mn) in the last few weeks (YTD foreign portfolio investment peaked at QR2.7bn as recorded on August 05, 2013 versus QR2.3bn as of September 26, 2013). However, we believe the following catalysts will provide a boost to the stock market in the medium term. These include: 1) the upcoming earnings season and anticipation of cash dividends from blue-chip companies; 2) Qatar‟s inclusion in the MSCI Emerging Markets Index in the middle of 2014 and 3) relative catch-up with the QE Index lagging other major regional indices despite offering compelling dividend yields and attractive valuation. Trading value during the week decreased by 17.39% to reach QR1.4bn vs. QR1.8bn in the prior week. The Industrials sector led the trading value during the week, accounting for 40.75% of the total equity trading value. Trading volume decreased by 36.38% to reach 27.3 million (mn) shares vs. 43.0mn shares in the prior week. The number of transactions fell by 23.89% to reach 15,672 transactions versus 20,590 transactions in the prior week. The Banks and Financial Services sector led the trading volume, accounting for 27.7% of the total. Foreign institutions turned bearish for the week with net selling of QR103.7.1mn versus net buying QR57.1mn the prior week. Non- Qatari individuals were net buyers of QR55.6mn versus net selling QR29.6mn in the prior week. Finally, local institutions were net buyers of QR67.5mn versus QR18.6mn the week before. Market Indicators Week ended Sep 26, 2013 Week ended Sep 19, 2013 Chg. % Value Traded (QR mn) 1,447.8 1,752.5 (17.4) Exch. Market Cap. (QR mn) 522,044.3 537,350.8 (2.8) Volume (mn) 27.3 43.0 (36.4) Number of Transactions 15,672 20,590 (23.9) Companies Traded 41 41 0.0 Market Breadth 8:32 37:4 – Market Indices Close WTD% MTD% YTD% Total Return 13,688.73 (2.9) (0.4) 21.0 All Share Index 2,412.97 (2.7) (0.5) 19.8 Banks/Financial Svcs. 2,338.75 (3.0) (0.4) 20.0 Industrials 3,030.66 (2.5) (1.7) 15.4 Transportation 1,769.83 (3.2) 0.5 32.0 Real Estate 1,730.74 (3.7) 0.8 7.4 Insurance 2,244.15 (0.4) 0.4 14.3 Telecoms 1,440.86 (3.4) 0.3 35.3 Consumer 5,895.98 (0.4) 0.4 26.2 Al Rayan Islamic Index 2,741.65 (2.5) (0.2) 10.2 Market Indices Weekly Index Performance Regional Indices Close WTD% MTD% YTD% Weekly Exchange Traded Value ($ mn) Exchange Mkt. Cap. ($ mn) TTM P/E** P/B** Dividend Yield Qatar (QE)* 9,580.77 (2.9) (0.4) 14.6 397.38 143,405.6 12.0 1.7 4.8 Dubai 2,736.89 2.7 8.5 68.7 1,566.03 67,335.97 15.9 1.1 3.3 Abu Dhabi 3,838.81 0.7 2.8 45.9 678.46 110,246.8 10.9 1.4 4.7 Saudi Arabia 7,981.07 (0.5) 2.7 17.4 3,753.81 423,811.0# 16.7 2.1 3.7 Kuwait 7,783.32 (0.8) 2.0 31.2 968.53 111,537.3 18.8 1.3 3.5 Oman 6,660.36 0.9 (0.5) 15.6 65.14 23,306.7 11.0 1.6 3.9 Bahrain 1,197.23 (0.2) 0.8 12.4 6.09 21,898.2 8.4 0.9 4.0 Source: Bloomberg, country exchanges and Zawya (** Trailing Twelve Months; * Value traded ($ mn) do not include special trades, if any) ( # Data as of September 25, 2013) 9,785.90 9,797.88 9,697.49 9,596.34 9,580.77 0 3,500,000 7,000,000 9,450 9,650 9,850 22-Sep 23-Sep 24-Sep 25-Sep 26-Sep Volume QE Index 2.7% 0.9% 0.7% (0.2%) (0.5%) (0.8%) (2.9%)(4.0%) (2.0%) 0.0% 2.0% 4.0% Dubai Oman AbuDhabi Bahrain SaudiArabia Kuwait Qatar
- 2. Page 2 of 5 News Economic News Qatar banks well prepared to deal with Basel III norms – Ratings agency S&P said Qatar‟s banking sector will not have any major capitalization issues to deal with when the new Basel III capital norms are introduced. Last month, the Qatar Central Bank sent a draft circular on new Basel III capital rules to all Qatari banks. Building on the Basel I and Basel II norms, the Basel III norms seek to improve the sector‟s ability to deal with financial and economic stress, risk management as well as strengthen banking transparency. (Gulf-Times.com) Market & Corporate News Qatar put on watch for upgrade to emerging-market status at FTSE – According to a report published by FTSE, Qatar‟s stocks may be promoted to secondary-emerging market status at global index compiler from frontier ranking. Qatar may be upgraded based on improvements in the settlement processes. FTSE said further improvements are required in increasing foreign ownership limits and improving broad market liquidity to meet secondary emerging eligibility requirements in full. Moreover, Kuwait is put on watch list for potential inclusion as secondary-emerging market and Morocco on watch list for possible demotion from secondary-emerging market status to frontier due to continued decline in broad market liquidity below the level sufficient to support sizable global investment. FTSE has ranked Egypt, UAE as secondary-emerging markets and Bahrain, Jordan, Oman, Tunisia as frontier markets. (Bloomberg) QP appoints QNB Group, Deutsche Bank to arrange QR3.2bn IPO for its unit – Qatar Petroleum (QP) has appointed QNB Group and Deutsche Bank to help arrange for an IPO of shares in one of its units. The issue could be worth around QR3.2bn ($880mn). Mesaieed Petrochemical Holding Company may issue its IPO on the Qatar stock exchange within 2013, subject to necessary approvals. QNB Group has been appointed to manage this offer, while Deutsche Bank will act as a financial adviser. The sale of shares will be restricted to Qatari nationals, although foreign investors will be allowed to buy a certain percentage of the firm once it has been listed. (Reuters, Gulf-Times.com) QNB Group and UDCD sign 10-year loan agreement – The United Development Company (UDCD) has signed a 10-year loan facility agreement worth QR1.5bn with QNB Group. The loan facility has been granted for the purpose of financing UDCD‟s purchase of the remaining residential units at Qanat Quartier in the Pearl-Qatar Island. (AME Info) New senior management for QFC Regulatory Tribunal – The Rt Hon Sir David Keene has been appointed as the Chairman of the Qatar Financial Center‟s (QFC) Regulatory Tribunal. Meanwhile, Justice Frances Kirkham CBE, will head “Q-Construct,” a specialist fast-track construction dispute resolution scheme. Christopher Grout has been promoted from Acting Registrar to Registrar, who will perform a legal, judicial and managerial role for the Qatar International Court & Dispute Resolution Centre (QICDRC). (Peninsula Qatar) QE listed insurers’ assets totaled QR15.9bn in 2012 – According to a report by the Qatar Central Bank (QCB), five national insurance companies listed on the Qatar Exchange (QE) held assets worth QR15.9bn in 2012, equivalent to roughly 2.3% of the country‟s GDP. These five national insurance companies are: Al Khaleej Takaful, Doha Insurance, Qatar Islamic Insurance, Qatar General Insurance and Qatar Insurance. The total gross premium earned by these five underwriters in 2012 amounted to QR3.92bn, accounting for roughly 0.6% of last year‟s GDP. A QCB analysis of their balance sheets indicated that their total assets grew by 6.7% during 2012 as compared to 3.6% in 2011. Moreover, these five insurance companies maintained their profit levels, as their net profit increased by 2.9% in 2012 as compared to 2.7% in 2011. (Gulf-Times.com) Barwa Village shop rents likely to go up – Barwa Real Estate Company (BRES) has hinted a possible hike in the rentals of shops in Barwa Village. Barwa‟s leasing subsidiary, Waseef‟s CEO Abdullah Jabara Al Rumaihi said the rents of commercial spaces in Barwa Village are much lower compared to the current market rates. (Peninsula Qatar) VFQS appoints new Strategy Director, Head of fixed Services – Vodafone Qatar (VFQS) has appointed Dalia Ahmed Al Khalaf as its new Strategy Director. Al-Khalaf‟s first priority is to focus on the long-term strategy for VFQS in Qatar. She has an extensive experience of 13 years working in various companies in Qatar including Enterprise Qatar, QInvest, Al Khaliji Bank, Maersk Oil and the International Projects Development Company etc. Further, VFQS has appointed Simone Eliantonio as the new Head of Fixed Services, as the company ramps up its entry into Qatari fixed services market. Eliantonio will join VFQS from Vodafone Group Technology Networks, where he was working as the Principal Manager for Fixed Mobile Convergence Service Delivery. (QE) Credit Suisse, Qatar venture to target derivatives, equities – Aventicum Capital Management, the JV of Credit Suisse Group and Qatar Holding, is planning to target assets such as equities and derivatives in its second investment fund to be launched by the end of 2013. Aventicum‟s CEO Hashem Montasser said the company will invest its second fund in the same region as well as Turkey and other frontier markets. He also said that the venture is hoping to have $250-300mn worth of assets under management by December 2013. (Gulf- Times.com) QA signs frequent flyer deal with American Airlines – Qatar Airways (QA) has entered into a reciprocal frequent flyer program agreement with American Airlines (AA). Under this agreement, the members of American Airlines‟ AAdvantage Program and QA‟s Privilege Club members can earn and redeem miles on any flights operated by these airlines. (Bloomberg) Qatar Foundation appoints new President, CEO – Qatar Foundation for Education, Science & Community Development‟s Chairman HH Sheikha Moza bint Nasser announced the appointment of Saad al-Muhannadi as its new President and Rashid al-Naimi as the CEO of Qatar Foundation Investments. (Gulf-Times.com) ABQK to disclose its 3Q2013 results on October 13 – Ahli Bank (ABQK) will disclose its 3Q2013 financial results for the period ending September 30, 2013 on October 13, 2013. (QE) NLCS to disclose its 3Q2013 results on October 9 – Alijarah Holding (NLCS) will disclose its 3Q2013 financial results for the period ending September 30, 2013 on October 9, 2013. (QE) Nakilat to disclose its 3Q2013 results on October 6 – Nakilat (QGTS) will disclose the financial results for 3Q2013 on October 6, 2013. (QE) Doha Bank to disclose its 3Q2013 financial results on October 21 – Doha Bank (DHBK) will disclose its 3Q2013 financial results on October 21, 2013. (QE)
- 3. Page 3 of 5 Qatar Exchange Top 5 Gainers Top 5 Decliners Source: Qatar Exchange (QE) Source: Qatar Exchange (QE) Most Active Shares by Value (QR Million) Most Active Shares by Volume (Million) Source: Qatar Exchange (QE) Source: Qatar Exchange (QE) Investor Trading Percentage to Total Value Traded Net Traded Value by Nationality (QR Million) Source: Qatar Exchange (QE) Source: Qatar Exchange (QE) 1.6% 1.4% 1.2% 1.0% 0.8% 0.0% 1.0% 2.0% 3.0% Qatar German Co. for Medical Devices Gulf International Services Mannai Corp. Qatar Meat and Livestock Qatar General Insurance & Reinsurance -4.5% -4.4% -4.1% -4.0% -3.7% -6.0% -4.0% -2.0% 0.0% United Development QNB Group Qatar Gas Transport (Nakilat) Industries Qatar Ooredoo 464.7 107.6 101.9 93.7 92.9 0.0 200.0 400.0 600.0 Industries Qatar QNB Group Medicare Group Masraf Al Rayan United Development 4.3 3.2 3.1 2.0 1.7 0.0 2.0 4.0 6.0 United Development Masraf Al Rayan Industries Qatar Medicare Group Qatar Gas Transport (Nakilat) 0% 20% 40% 60% 80% 100% Buy Sell 33.73% 35.06% 22.48% 17.82% 14.12% 10.28% 29.67% 36.83% Qatari Individuals Qatari Institutions Non-Qatari Individuals Non-Qatari Institutions 814 634 766 682 48 (48) (200) - 200 400 600 800 1,000 Qatari Non-Qatari Net Investment Total Sold Total Bought
- 4. Page 4 of 5 TECHNICAL ANALYSIS OF THE QE INDEX Source: Bloomberg The QE Index failed to make any further headway above the 9,900.0 mark last week and retreated by around 291 points erasing the consecutive gains witnessed in the past two weeks, thus dashing the hopes of reaching the psychological 10,000.0 level. The bears proved to be too strong for the bulls as the index witnessed sustained selling pressure throughout the week except on Monday. The index penetrated below few important psychological levels (9,800.0, 9,700.0 and 9,600.0) and both the 21-day and 55-day moving averages last week and showed no reversal signs. On the downside, the important level now for the traders to watch out is the band near 9532.0-9500.0, which is a psychological as well as a technical support area. A breakdown below this level may have bearish implications, which may result in bears taking full command over the bulls and pull the index to test 9,400.0. Any sustained weakness below this level may prompt the index to test 9,300.0. On the flip side, the index needs to move upward and reclaim the 9,600.0 psychological level and both the moving averages in the coming week, in order to keep its upward hopes alive. Meanwhile, both momentum indicators are giving bearish signals, thus suggesting a further downside. Thus, traders may keep a low profile but must also keep a close watch on the 9,600.0 level and the moving averages for any reversal signs. DEFINITIONS OF KEY TERMS USED IN TECHNICAL ANALYSIS RSI (Relative Strength Index) indicator – RSI is a momentum oscillator that measures the speed and change of price movements. The RSI oscillates between 0 to 100. The index is deemed to be overbought once the RSI approaches the 70 level, indicating that a correction is likely. On the other hand, if the RSI approaches 30, it is an indication that the index may be getting oversold and therefore likely to bounce back. MACD (Moving Average Convergence Divergence) indicator – The indicator consists of the MACD line and a signal line. The divergence or the convergence of the MACD line with the signal line indicates the strength in the momentum during the uptrend or downtrend, as the case may be. When the MACD crosses the signal line from below and trades above it, it gives a positive indication. The reverse is the situation for a bearish trend. Candlestick chart – A candlestick chart is a price chart that displays the high, low, open, and close for a security. The „body‟ of the chart is portion between the open and close price, while the high and low intraday movements form the „shadow‟. The candlestick may represent any time frame. We use a one-day candlestick chart (every candlestick represents one trading day) in our analysis. Doji candlestick pattern – A Doji candlestick is formed when a security's open and close are practically equal. The pattern indicates indecisiveness, and based on preceding price actions and future confirmation, may indicate a bullish or bearish trend reversal. Shooting Star/Inverted Hammer candlestick patterns – These candlestick patterns have a small real body (open price and close price are near to each other), and a long upper shadow (large intraday movement on the upside). The Shooting Star is a bearish reversal pattern that forms after a rally. The Inverted Hammer looks exactly like a Shooting Star, but forms after a downtrend. Inverted Hammers represent a potential bullish trend reversal.
- 5. Contacts Saugata Sarkar Ahmed M. Shehada Keith Whitney Sahbi Kasraoui Head of Research Head of Trading Head of Sales Manager - HNWI Tel: (+974) 4476 6534 Tel: (+974) 4476 6535 Tel: (+974) 4476 6533 Tel: (+974) 4476 6544 saugata.sarkar@qnbfs.com.qa ahmed.shehada@qnbfs.com.qa keith.whitney@qnbfs.com.qa sahbi.alkasraoui@qnbfs.com.qa QNB Financial Services SPC Contact Center: (+974) 4476 6666 PO Box 24025, Doha, Qatar DISCLAIMER: This publication has been prepared by QNB Financial Services SPC (“QNBFS”) a wholly-owned subsidiary of Qatar National Bank (“QNB”). QNBFS is regulated by the Qatar Financial Markets Authority and the Qatar Exchange; QNB is regulated by the Qatar Central Bank. This publication expresses the views and opinions of QNBFS at a given time only. It is not an offer, promotion or recommendation to buy or sell securities or other investments, nor is it intended to constitute legal, tax, accounting, or financial advice. We therefore strongly advise potential investors to seek independent professional advice before making any investment decision. Although the information in this report has been obtained from sources that QNBFS believes to be reliable, we have not independently verified such information and it may not be accurate or complete. While this publication has been prepared with the utmost degree of care by our analysts, QNBFS does not make any representations warranties as to the accuracy and completeness of the information it may contain, and declines any liability in that respect. QNBFS reserves the right to amend the views and opinions expressed in this publication at any time. It may also express viewpoints or make investment decisions that differ significantly from, or even contradict, the views and opinions included in this report. COPYRIGHT: No part of this document may be reproduced without the explicit written permission of QNBFS. Page 5 of 5 Source: Bloomberg Company Name Price (Sep 26) % Change 5- Day % Change Monthly Market Cap. QR Million TTM P/E P/B Div. Yield Qatar National Bank 166.90 (4.41) (0.36) 116,785 13.0 2.4 3.6 Qatar Islamic Bank 68.40 (0.87) (2.01) 16,162 14.3 1.4 5.5 Commercial Bank of Qatar 68.30 (1.44) (0.15) 16,901 8.4 1.2 8.8 Doha Bank 53.90 (1.10) 0.37 13,926 9.3 1.6 7.7 Al Ahli Bank 54.00 0.00 (1.82) 6,862 13.3 2.1 5.5 Qatar International Islamic Bank 55.60 (2.28) 0.18 8,416 11.9 1.7 6.3 Masraf Al Rayan 28.70 (3.37) (0.69) 21,525 13.5 2.2 3.5 Al Khaliji Bank 18.50 (1.86) 0.05 6,660 12.3 1.3 5.4 National Leasing 34.35 (0.58) 0.44 1,700 10.0 1.3 5.8 Dlala Holding 21.50 (1.47) 11.63 477 N/A 2.2 N/A Qatar & Oman Investment 12.80 (1.69) 2.81 403 21.0 1.3 3.9 Islamic Holding Group 41.40 0.49 6.70 166 26.4 3.2 2.7 Banking and Financial Services 209,983 Zad Holding 65.00 (0.31) 3.17 850 7.7 0.7 6.2 Qatar German Co. for Medical Devices 15.49 1.57 7.57 179 N/A 0.9 N/A Salam International Investment 12.08 (0.17) (3.21) 1,381 22.9 0.9 5.8 Medicare Group 48.30 (3.40) 0.73 1,359 22.9 1.8 3.7 Qatar Cinema & Film Distribution 50.00 0.00 1.83 285 30.3 2.1 4.0 Qatar Fuel 284.50 (0.18) 0.57 18,484 16.2 3.3 3.5 Qatar Meat and Livestock 52.30 0.97 (0.76) 941 14.3 4.1 7.7 Al Meera Consumer Goods 131.90 (1.49) 0.30 2,638 17.3 2.1 6.1 Consumer Goods and Services 26,118 Qatar Industrial Manufacturing 50.20 0.40 4.37 1,988 11.7 1.5 6.0 Qatar National Cement 101.30 (0.78) (0.88) 4,974 11.4 2.1 5.9 Industries Qatar 147.50 (3.97) (3.91) 89,238 9.9 2.9 5.2 Qatari Investors Group 29.00 (2.36) 3.39 3,605 18.1 1.8 2.6 Qatar Electricity and Water 156.50 (2.19) (0.95) 15,650 10.9 3.0 4.7 Mannai Corp. 84.50 1.20 0.60 3,855 8.9 1.7 5.6 Aamal 14.40 (1.03) (1.37) 8,640 13.5 1.3 N/A Gulf International Services 51.20 1.39 6.67 7,612 13.6 2.8 2.9 Industrials 135,562 Qatar Insurance 60.00 (0.83) 0.00 7,706 9.3 1.6 3.4 Doha Insurance 25.70 (0.96) (1.15) 662 12.0 1.3 3.5 Qatar General Insurance & Reinsurance 52.70 0.76 2.73 3,038 3.6 0.9 1.7 Al Khaleej Takaful Insurance 39.75 (0.63) (1.85) 679 14.3 1.2 2.1 Qatar Islamic Insurance 57.20 0.35 (0.35) 858 14.5 3.3 6.1 Insurance 12,942 United Development 21.20 (4.50) (0.93) 7,149 9.4 0.7 4.7 Barwa Real Estate 24.98 (3.37) 1.96 9,720 16.2 0.8 6.0 Ezdan Real Estate 17.11 (1.67) (1.89) 45,384 N/M 1.6 0.8 Mazaya Qatar Real Estate Development 11.55 (1.28) 1.94 1,155 17.3 1.1 5.2 Real Estate 63,409 Qatar Telecom 139.50 (3.73) 0.36 44,685 13.3 1.8 3.6 Vodafone Qatar 9.00 (1.42) (0.22) 7,609 N/A 1.3 N/A Telecoms 52,293 Qatar Navigation (Milaha) 79.80 (2.09) 2.31 9,139 9.4 0.8 4.7 Gulf Warehousing 40.00 (3.50) 0.63 1,902 19.7 2.5 N/A Qatar Gas Transport (Nakilat) 19.10 (4.07) (0.98) 10,696 14.2 3.3 5.2 Transportation 21,738 Qatar Exchange 522,044